

Abstract
When measured behaviorally, older adults with normal hearing have poorer intensity discrimination thresholds than younger adults, but only at lower frequencies. Poor intensity discrimination at lower but not higher frequencies for older adults can be associated with an age-related decline in temporal processing. The current study was designed to assess age-related effects on intensity discrimination at 500 and 3000 Hz using the cortical auditory evoked potential, N1-P2. Subjects were 10 younger and 10 older adults with normal hearing. The N1-P2 was elicited by an intensity increase in an otherwise continuous pure tone presented at 70 dB SPL. Intensity increments ranged from 0 dB to 5 dB at 500 Hz and from 0 dB to 8 dB at 3000 Hz in 1-dB steps. Intensity discrimination threshold was defined as the smallest intensity change needed to evoke an N1-P2 response. Consistent with behavioral measures, N1-P2 response thresholds were significantly higher for older subjects than younger subjects at 500 Hz but did not differ significantly at 3000 Hz. In addition, N1 and P2 latencies for older subjects were significantly prolonged at 500 Hz, but not at 3000 Hz. As intensity increments increased above threshold, amplitudes tended to be larger in older than in younger subjects, however, these differences were not statistically significant. In older subjects, response latencies and amplitudes were significantly larger at 500 Hz than at 3000 Hz. In younger subjects, response latencies and amplitudes were similar across frequency. Similar intensity discrimination thresholds and age-related differences for behavioral measures and evoked potentials support the notion that the N1-P2 measures reflect the physiological detection of intensity change which in turn relates to intensity discrimination. A possible explanation for the decreased intensity discrimination at low frequencies, and enhanced amplitudes with prolonged latencies in older subjects is an age-related decline in inhibitory control within the central auditory nervous system.
Keywords: Aging and cortical potentials, Auditory evoked potentials, Aging and intensity discrimination
1. Introduction
A common complaint of older adults with and without hearing loss is difficulty understanding speech, especially in complex listening environments (Dubno et al., 1997). Speech is characterized by rapid changes in frequency and intensity over time. Age-related declines in the ability to detect changes in intensity may account for some of the age-related declines in speech recognition. However, results from studies examining the effects of age on intensity discrimination are equivocal. As reviewed by Humes (1996), a series of studies examining the effects of age and hearing loss on intensity discrimination, using a tonal complex showed that older subjects demonstrated poorer performance for an intensity discrimination task than younger normal-hearing subjects. However, when differences in hearing levels between subject groups were minimized by introducing a high-pass masker for younger subjects, differences in intensity discrimination between younger and older subjects were negligible (Christopherson et al., 1992; Humes, 1996; Humes et al., 1991). In contrast, He et al. (1998) reported that older adults with normal hearing had poorer intensity discrimination than younger adults, but only at lower frequencies. Based on a spectrotemporal model of auditory processing, intensity discrimination at lower frequencies is based primarily on temporal information and may be related to phase-locking properties of the neural fiber response, whereas spectral cues dominate performance at higher frequencies where phase-locking cues are diminished. Therefore, poor intensity discrimination at lower but not higher frequencies for older adults may be associated with an age-related decline in temporal processing.
The aforementioned studies assessed intensity discrimination using behavioral measures. Behavioral measures may be affected by both age-related changes in auditory processing as well as changes in cognitive processing, such as level of attention, or by the tasks and response criteria used (He et al., 1998; Turner et al., 1982). As such, electrophysiologic measures, such as cortical auditory evoked potentials, may be a more objective method of assessing age-related changes in auditory processing. The N1-P2, a cortical auditory evoked potential, can be elicited by changes in an ongoing stimulus without active subject participation. Several studies have suggested that the N1-P2 response may serve as an objective measure of the capacity for auditory discrimination in human listeners (Martin et al., 1999; Martin et al., 2000; Ostroff et al., 1998). The N1-P2 is thought to reflect synchronous neuronal activation of structures in the thalamic-cortical segment of the central auditory system (Naatanen et al., 1987; Wolpaw et al., 1975; Woods, 1995).
The N1-P2 response is sensitive to changes in amplitude modulation and changes in intensity (Arlinger et al., 1979; Jerger et al., 1970; Martin et al., 2000; McCandless et al., 1970; Pantev et al., 1989). Although not always a linear relationship, N1-P2 responses become more robust (decreased latencies and increased amplitudes) as the change in intensity becomes larger. Additionally, N1-P2 response amplitudes appear larger in response to intensity increments than to intensity decrements (Martin et al., 2000; McCandless et al., 1970). Thus, the presence of the N1-P2 response reflects the physiological detection of the intensity change at the level of the auditory cortex, which in turn has been shown to relate to intensity discrimination abilities. Consistent with this assumption, intensity discrimination thresholds measured with the N1-P2 elicited by tones and speech-like stimuli are very similar to those measured behaviorally (McCandless et al., 1970; Martin et al., 2000). Therefore, “N1-P2 intensity discrimination threshold” is used here to refer to the lowest intensity change required to elicit an N1-P2 response.
The results reviewed above demonstrate the utility of the N1-P2 as an electrophysiologic measure of intensity discrimination in young normal-hearing listeners. If age-related declines in intensity discrimination observed behaviorally result from changes in auditory processing, then these age effects should also be reflected in intensity discrimination thresholds measured electrophysiologically with the N1-P2. Based on the frequency-dependent aging effect for intensity discrimination measured behaviorally (He et al., 1998), we predicted that intensity discrimination thresholds measured using the N1-P2, would be significantly poorer for older than younger subjects, but only at lower frequencies.
Amplitude and latency characteristics of the N1-P2 response may also reveal underlying changes in brain activity that are associated with age-related declines in intensity discrimination. However, the effects of aging in response to the onset of sound (clicks, tone-bursts, speech-like stimuli) on the N1-P2 response are equivocal. Differences across studies have been attributed to methodology differences as well as differences in hearing status across subjects. Nevertheless, N1 and/or P2 latencies are frequently reported to be delayed in older adults as compared to younger adults (Anderer et al., 1996; Boutros et al., 2000; Laffont et al., 1989; Pfefferbaum et al., 1980; Schroeder et al., 1995; Tremblay et al., 2004; Woods, 1992). Increased N1 and/or P2 latencies have been associated with a general slowing of neuronal processing, as well as changes in excitatory and inhibitory processes, which can result in decreased neuronal synchrony or temporal jitter within the auditory pathway. With regard to amplitudes, some studies report similar N1-P2 amplitudes for younger and older subjects (Barrett et al., 1987; Brown et al., 1983; Picton et al., 1984; Tremblay et al., 2004), whereas others report an age-related increase in amplitudes (Anderer et al., 1996; Harkrider et al., 2005; Pfefferbaum et al., 1980). Like the N1-P2, age-related increases in amplitude have been reported for other cortical potentials (Boettcher et al., 2001; Woods et al., 1986). Similar to the age-related changes in response latency, unusually large N1-P2 amplitudes have been interpreted to represent an age-related decline in inhibitory control. These changes in N1-P2 response amplitudes and latencies are consistent with results from animal studies that show age-related changes in temporal processing (Boettcher et al., 1996; Shaddock Palombi et al., 2001; Walton et al., 2002; Walton et al., 1997) and declines in inhibitory neurotransmittors (Caspary et al., 1995; Caspary et al., 1999; Ling et al., 2005; Milbrandt et al., 1994; Milbrandt et al., 1997). Less is known about the age-related effects on response amplitudes and latencies when the N1-P2 response is used to measure acoustic changes contained within a signal, such as used in the current study (intensity change).
The goal of this experiment was to assess age-related changes in auditory processing for an intensity discrimination task, while minimizing the contribution of cognitive factors, such as attention. Based on previous behavioral studies of intensity discrimination, it was predicted that intensity discrimination thresholds as measured using the N1-P2 response would be poorer for older than younger subjects, but only at low frequencies. Furthermore, electrophysiologic measures would reveal underlying changes in brain activity that may be associated with declines in intensity discrimination. Older subjects were predicted to exhibit prolonged N1 and P2 latencies and increased amplitudes as compared to younger subjects, consistent with declines in inhibitory control.
2. Methods
2.1 Subjects
Two groups of human subjects were included: younger (18–30 years, n = 10) and older (64–76 years, n =10). Each older subject received the Short Portable Mental Status Questionnaire; all subjects had two or fewer errors, signifying intact intellectual functioning (Pfeiffer, 1975). Several authors have hypothesized a link between N1-P2 amplitudes and tinnitus (Attias et al., 1993; Hoke et al., 1989; Kadner et al., 2002). Therefore, each subject was subjectively questioned as to their history of tinnitus; only one older subject reported a significant history of tinnitus. Prior to electrophysiologic testing, conventional pure-tone thresholds were measured with a Madsen OB922 clinical audiometer calibrated to appropriate ANSI standards (ANSI,1996) and equipped with TDH-39 headphones. Thresholds were measured in 5-dB steps.
2.2 Apparatus and stimuli
The N1-P2 response was elicited by a brief intensity increase in an otherwise continuous pure tone (500 and 3000 Hz). The continuous tone was presented monaurally at a level of 70 dB SPL. The intensity increment was 150 msec (10 msec rise/fall time, 130 ms plateau) in duration and varied randomly from +0 dB (no change) to +5 dB (75 dB SPL) at 500 Hz and from +0 dB to +8 dB at 3000 Hz. Intensity increments were measured electrically at the input to the earphones (oscilloscope) and acoustically calibrated with the earphone placed in a coupler using a Larson-Davis sound level meter. The interval between intensity increments was 3 sec, selected to minimize age-related rate effects (Tremblay et al., 2004). The signals were generated using Tucker-Davis Technologies (TDT) System 3 modules (sampling rate 25 kHz). The system incorporated a programmable attenuator and a head phone buffer/interface for impedance matching. The signals were presented monaurally through a TDH-39 headphone. A break (no auditory stimulation) was provided every 20 minutes or as requested by the subject.
2.3 Data collection and analysis
Testing was conducted in a sound-treated booth. Subjects sat in a reclining chair and read quietly during electrophysiologic testing. Surface electrodes were placed at the vertex (Cz) and on each mastoid. The active electrode was the vertex, the reference electrode was the ipsilateral (stimulated) ear, and the ground electrode was the contralateral (non-stimulated) ear. The average inter-electrode impedance was < 5 kΩ. The responses from the electrodes were amplified 100,000x (Grass Model 12 Neurodata Acquisition System), filtered from 3 Hz (high-pass filter, 6 dB/octave) to 30 Hz (low-pass filter, 6 dB/octave), and routed to a 24-bit A/D converter. Averaging was triggered by the change in intensity in the continuous pure tone. Data were collected and stored for analysis using a TDT BioSig system.
Responses (100 sweeps per response) were averaged across a 1000 msec time window. Two responses were obtained for each condition and averaged. Threshold was determined as the smallest ΔI that elicited a repeatable N1-P2 response. Epochs with artifact measuring in excess of ± 50 μV were excluded from the average waveform. N1 and P2 peak latencies and amplitudes were determined. The group average waveforms were used to determine the latency windows for identification of N1 and P2. Latencies were determined from the onset of the change in intensity, and peak amplitudes for N1 and P2 as well as the as the difference between the amplitudes of N1 and P2 were measured.
Differences between subject groups, increment size, and signal frequency were assessed using t-tests and repeated measures analyses of variance (ANOVA); p values of <0.05 were considered significant.
3. Results
3.1 Audiometric thresholds
All subjects had normal hearing (defined as thresholds ≤ 25 dB HL at 250, 500, 1000defined as thresholds ≤ 25 dB HL at 250, 500, 2000, 3000 and 4000 Hz) and normal immittance. Mean pure-tone audiometric thresholds (±1 S.E.M.) are shown in Figure 1. Mean group differences in thresholds ranged from 0.4 to 9 dB from 250 through 4000 Hz. At 8000 Hz, mean threshold differences were 22.3 dB, as some older subjects had thresholds above 25 dB HL. Differences in audiometric thresholds between older and younger subjects at each frequency were assessed using independent sample t-tests. Older subjects had significantly higher thresholds than younger subjects at 4000 and 8000 Hz [t(18)= −2.795, p=0.012 and t(18)= −5.790, p<.01 for 4000 and 8000 Hz respectively].
Figure 1.
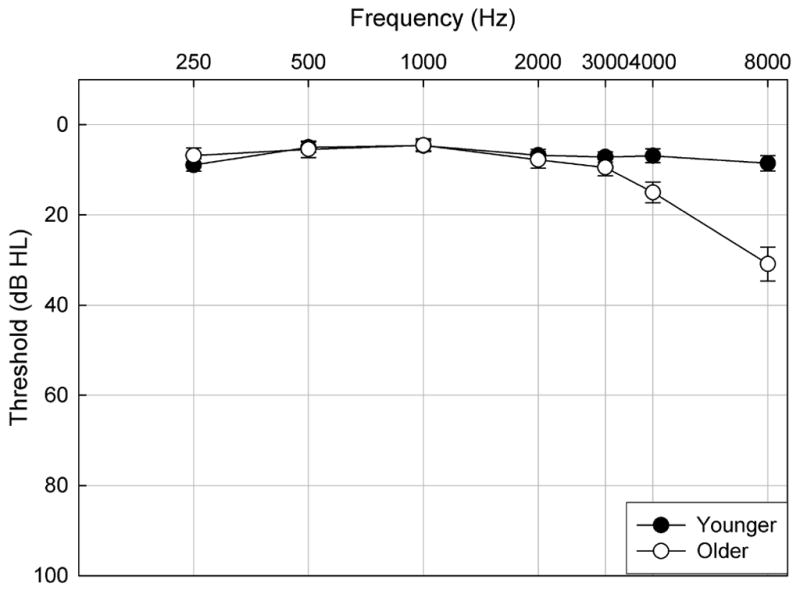
Mean pure-tone thresholds (±1 S.E.M.) for the test ear of younger subjects (closed) and older subjects (open) plotted as a function of frequency.
3.2 ΔI thresholds
All subjects demonstrated an N1-P2 response within the range of ΔI values included in this experiment. Figure 2 shows a typical series of N1-P2 responses as a function of ΔI; threshold has been labeled. Figure 3 illustrates the ΔI threshold distribution at 500 Hz (A) and 3000 Hz (B) for younger subjects (black bars) and older subjects (gray bars). ΔI thresholds at 500 Hz ranged from 2–3 dB in younger subjects and 2–4 dB in older subjects. ΔI thresholds at 3000 Hz ranged from 2–4 dB in younger subjects and were significantly higher than their thresholds at 500 Hz [t(9)=−3.25, p<.01]. ΔI thresholds at 3000 Hz ranged from 2–6 dB in older subjects and were not significantly different than their thresholds at 500 Hz [t(9)=−1.5, p=.168]. Older subjects had significantly higher ΔI thresholds than younger subjects at 500 Hz [t(18)=2.33, p=.031], but not at 3000 Hz [t(18)=1.07, p=.299]. This frequency-dependent aging effect is consistent with behavioral measures of intensity discrimination (He et al.,1998).
Figure 2.
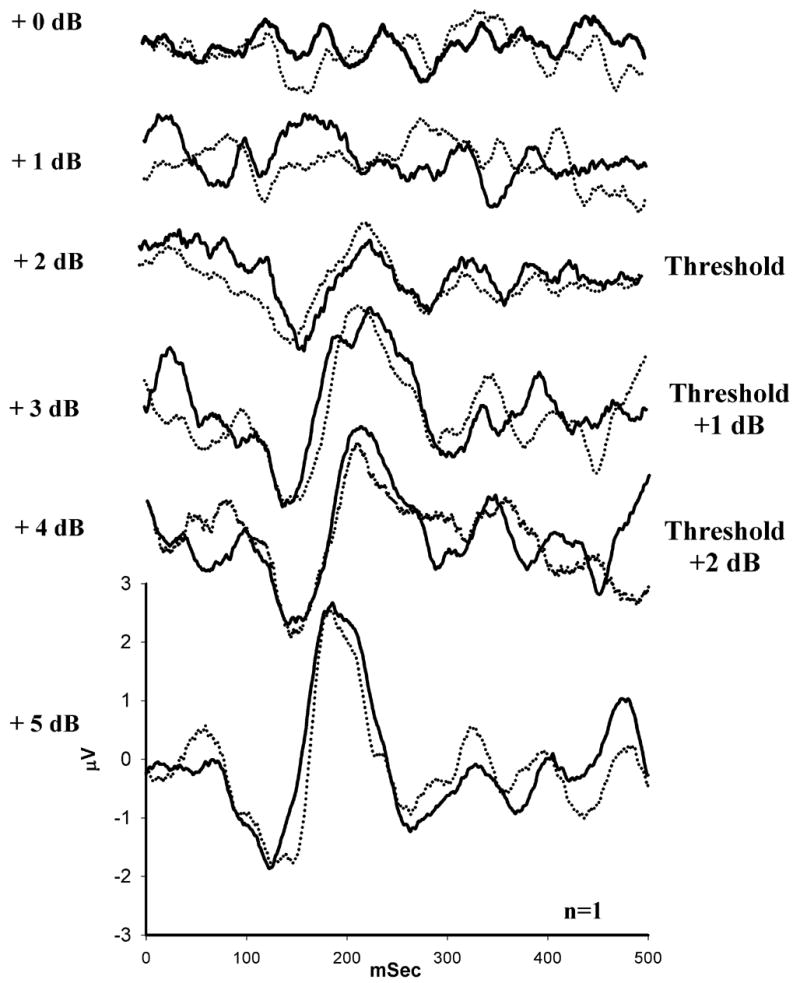
Representative waveforms recorded from a young subject (n=1) in response to a range of intensity increments (+0 dB to +5 dB) at 500 Hz. The subject’s intensity discrimination threshold was determined to be +2 dB (as labeled). Threshold was defined as the smallest intensity increment that elicited a repeatable N1-P2 response.
Figure 3.
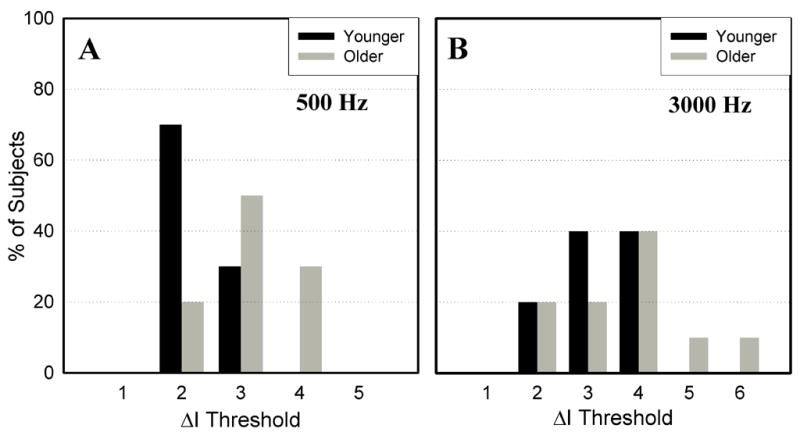
ΔI threshold distribution at 500 Hz (A) and 3000 Hz (B). Younger subjects are represented by black bars and older subjects are represented by gray bars. Older subjects had significantly higher ΔI thresholds at 500 Hz but not at 3000 Hz.
3.3 N1 and P2 response latencies and amplitudes
Figure 4 depicts the group average N1-P2 waveforms (Cz) elicited by a ΔI of +0 to +5 dB at 500 Hz. A small P1-N1-P21 response is first visible at a ΔI of +1 dB for younger subjects (solid lines), but at a ΔI of +2 dB for older subjects (dashed lines). For both subject groups, N1 and P2 latencies decreased and amplitudes increased with increasing ΔI intensity. When present, N1 and P2 latencies for older subjects appeared prolonged relative to younger subjects. Peak latency values and standard errors (± 1 S.E.M.) of N1 and P2 for each age group are plotted in Figure 5 for younger subjects (closed circles) and older subjects (open circles) in response to the largest increments for 500 Hz (+5 dB) and 3000 Hz (+8 dB). A repeated measures ANOVA, with signal frequency as a repeated measure and age as a grouping factor, revealed a significant main effect of age [F (1,18)= 5.998, p=.025] and a frequency by age interaction [F(1,18) =19.26, p<.001]. Post-hoc independent samples t-tests indicated that both the N1 and P2 latencies were significantly prolonged in older subjects as compared to younger subjects at 500 Hz [t(18)=−4.61, p<.0001 and t(18)=−2.193, p=0.042 for N1 and P2, respectively], but not at 3000 Hz [t(18)=1.866, p=.08 and t(18)=.716, p=.483 for N1 and P2, respectively]. Statistical analysis was not performed on response characteristics to lower intensity increments due to the large number of missing values for older subjects, which is likely a result of their higher ΔI thresholds.
Figure 4.
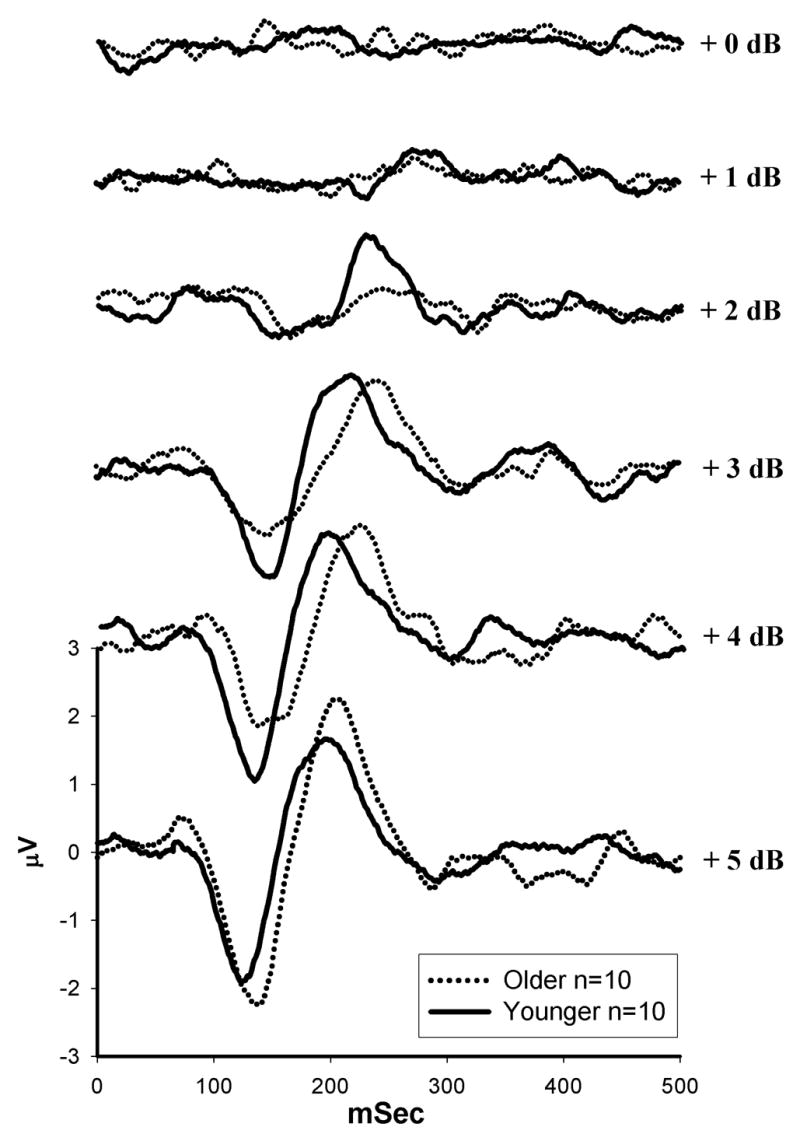
Group averaged waveforms for younger subjects (solid) (n=10) and older subjects (dashed) (n=10), recorded from electrode Cz.
Figure 5.
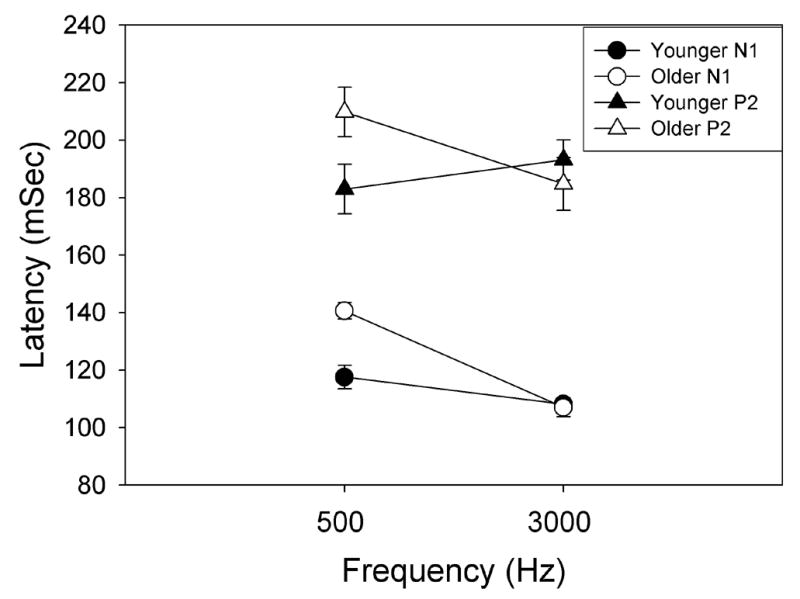
Mean N1 (circles) and P2 (triangles) latencies and standard errors are plotted for younger subjects (closed symbols) and older subjects (open symbols) in response to the largest intensity increments 500 Hz (+5 dB) and at 3000 Hz (+8 dB). N1 and P2 latencies were significantly prolonged in older subjects as compared to younger subjects at 500 Hz, but not at 3000 Hz.
As shown in the group averaged waveforms (Figure 4), amplitudes appear smaller for older subjects as compared to younger subjects at smaller increments (2–4 dB), likely due to higher ΔI thresholds in older subjects. In contrast, for the +5-dB increment, amplitudes appear larger for older than younger subjects. Figure 6 shows the mean N1-P2, N1 and P2 amplitudes and standard errors (± 1 S.E.M) for younger subjects (closed circles) and older subjects (open circles) in response to the largest increment for 500 Hz (+5 dB) and 3000 Hz (+8 dB). Differences in mean N1 and P2 and the combined N1-P2 response amplitudes between groups and frequencies did not reach statistical significance. However, although older subjects had higher ΔI thresholds, the largest amplitudes for the 500 Hz signal were found in older subjects, suggesting that above ΔI threshold, response amplitudes may increase more with increasing increment size for older than younger subjects. Although both N1 and P2 response amplitudes were generally larger in older subjects than younger subjects at 500 Hz, differences between groups were greater for the N1 response relative to P2 (Figures 6B and 6C). Statistical analysis was not performed on response characteristics to lower intensity increments due to the large number of missing values for older subjects, likely a result of their higher ΔI thresholds.
Figure 6.
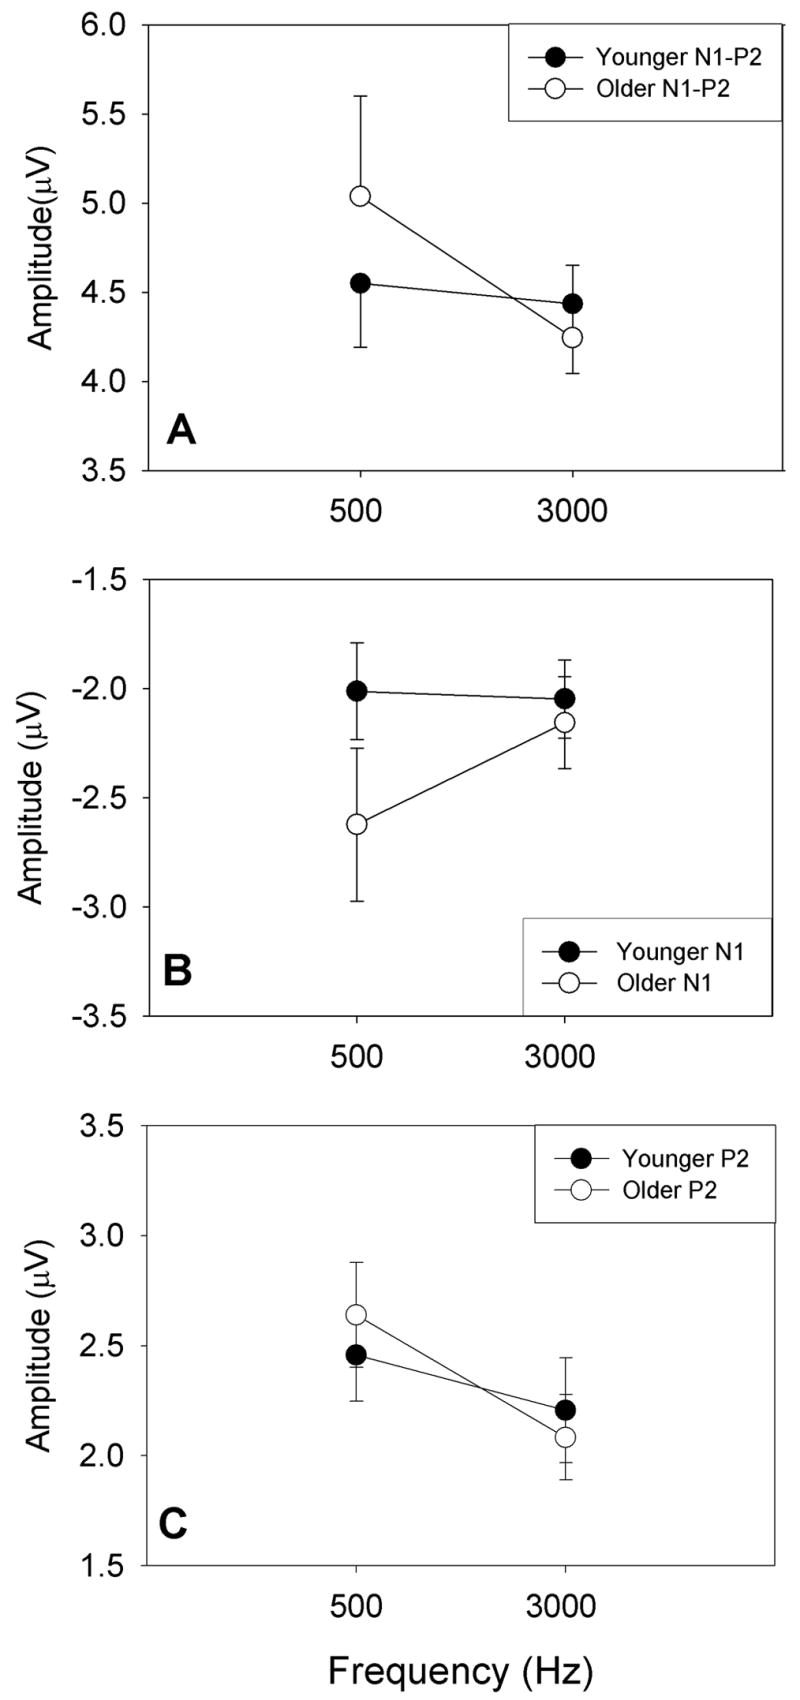
Mean N1-P2 (A), N1 (B), and P2 (C) amplitudes and standard errors for younger subjects (closed circles) and older subjects (open circles) in response to the largest intensity increment at 500 Hz (+5 dB) and 3000 Hz (+8 dB).
3.4 N1 and P2 response latencies and amplitudes adjusted for threshold
As described above, ΔI thresholds varied across subjects, which may affect differences in response latencies and amplitudes at the largest ΔI increment. Therefore, N1-P2 response latencies and amplitudes were adjusted for each individual’s ΔI threshold (see Figure 3) and compared. Figure 7 shows the average N1 and P2 peak latency values at 500 and 3000 Hz plotted relative to each subject’s ΔI threshold (designated as +0 dB re: threshold). N1 latencies were significantly prolonged in older subjects as compared to younger subjects at 500 Hz [F(1,18)= 4.539, p =0.047; Figure 7A], but not at 3000 Hz [F(1,18)=3.051, p=0.098; Figure 7B]. Similarly, P2 latencies for older subjects appeared prolonged at 500 Hz (Figure 7C) as compared to younger subjects, but latencies were similar between the two age groups at 3000 Hz (Figure 7D). Differences in P2 latencies between younger and older subjects did not reach statistical significance, (p=.230 and p=.093 for 500 Hz and 3000 Hz, respectively).
Figure 7.
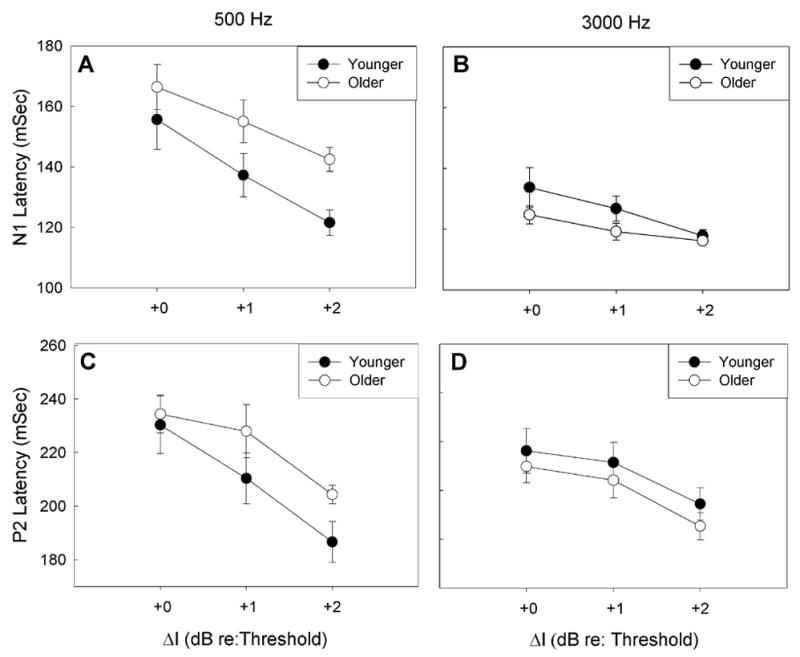
Mean N1 (A and B) and P2 (C and D) latencies and standard errors for younger subjects (closed circles) and older subjects (open circles). Latencies are shown for 500 Hz (A and C) and 3000 Hz (B and D). Data are plotted in reference to each subject’s ΔI threshold. N1 and P2 latencies were prolonged in older subjects as compared to younger subjects at 500 Hz, but not at 3000 Hz. For younger subjects, N1 and P2 latencies did not differ significantly at 500 Hz and 3000 Hz. For older subjects, N1 and P2 latencies were significantly larger at 500 Hz than at 3000 Hz.
Frequency effects were not uniform across older and younger subject groups. Response latencies remained relatively constant across frequency in younger subjects, with no significant effects of frequency on N1 [F(1,18)=3.949, p= 0.062] or P2 [F(1,18)= .096, p=0.760]. However, in older subjects, N1 and P2 latencies were longer at 500 Hz than at 3000 Hz [F(1,18)=40.724, p<.0001 and F(1,18)=8.845, p=0.008 for N1 and P2, respectively].
Figure 8 shows the mean N1-P2, N1, P2 amplitudes and standard errors (± 1 S.E.M) for younger subjects (closed symbols) and older subjects (open symbols) at 500 Hz (Figure 8A, C and E) and 3000 Hz (Figure 8B, D and F). Data are plotted relative to each subject’s ΔI threshold. As expected, amplitudes at threshold were similar for older and younger subjects. As ΔI increased above threshold, amplitudes increased more for older subjects than for younger subjects, but only at 500 Hz. These age-related differences in amplitude did not reach statistical significance at 500 Hz [F(1,18)=0.291, p=0.596, F(1,18)=1.070, p=.315, F(1,18)=.013, p=.911, for N1-P2, N1 and P2 respectively] or at 3000 Hz [F(1,18)=0.192, p=0.666, F(1,18)=.086, p=.773, F(1,18)=.201, p=.659 for N1-P2, N1 and P2 respectively].
Figure 8.
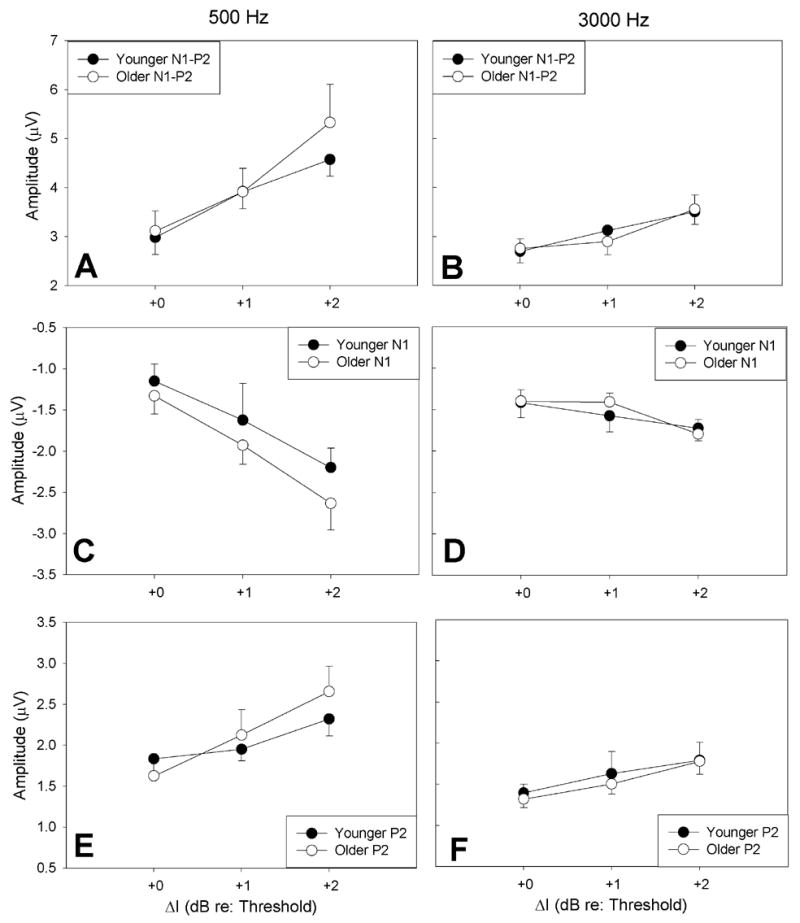
Mean N1-P2 (A and B), N1 (C and D) and P2 (E and F) amplitudes and standard errors for younger (closed circles) and older subjects (open circles). Amplitudes are shown for 500 Hz (A) and 3000 Hz (B). Data are plotted in reference to each subject’s ΔI threshold. At ΔI threshold, amplitudes were similar for older and younger subjects. As ΔI was increased above threshold, amplitudes increased more for older subjects than for younger subjects, but only at 500Hz. For older subjects, amplitudes were significantly larger at 500 Hz than at 3000 Hz. In younger subjects, amplitudes did not differ significantly across frequency.
At suprathreshold levels (+1 and +2 dB re: threshold), response amplitudes were larger at 500 Hz than at 3000 Hz for both older and younger groups. This frequency effect on response amplitudes was significant for older subject’s such that N1-P2 response amplitudes were significantly larger at 500 Hz than at 3000 Hz [F(1,18)=4.929, p=0.039] (Figure 8A–B). Differences in N1-P2 response amplitudes at 500 and 3000 Hz were not significant in younger subjects [F(1,18)=3.033, p=0.099]. Differences in N1 and P2 response amplitudes (Figures 8C–F) across frequency were not significant for younger [F(1,18)=.108, p=.747 and F(1,18)=2.731, p=.116 for N1 and P2 respectively] or older subjects [F(1,18)=3.727, p=.069 and F(1,18)=3.910, p=.064.
3.5 Effect of hearing loss
Pearson correlation coefficients were calculated to determine the extent to which intensity discrimination thresholds and N1-P2 response characteristics varied with audiometric thresholds in older subjects. Correlations were small to modest (and not statistically significant) between older subjects’ thresholds at 4000 and 8000 Hz and ΔI thresholds, and N1, P2 latencies and amplitudes at +5 dB for the 500 Hz signal (Pearson correlation coefficients ranged from −0.202 to 0.488; p>0.05).
4. Discussion
The main finding of the present study was that intensity discrimination was reduced in older subjects at 500 Hz but not at 3000 Hz, as assessed by the cortical evoked potential, N1-P2. A similar frequency-dependent aging effect was observed for N1-P2 response latencies and amplitudes. That is, latencies were longer and amplitudes were generally larger for older than younger subjects at 500 Hz but not at 3000 Hz. As audiometric thresholds at 500 Hz and 3000 Hz were closely matched for older and younger subjects, differences in intensity discrimination can not be attributed to audibility differences between the two age groups.
4.1 N1-P2 as an electrophysiological measure of intensity discrimination
The N1-P2 has been used previously to assess the capacity for intensity discrimination in younger normal-hearing subjects (Martin et al., 2000). In the current study, the N1-P2 was elicited by a brief increase in intensity in an otherwise continuous pure tone, and threshold was determined as the smallest change in intensity required to elicit a response. N1-P2 intensity discrimination thresholds in the current study ranged from 2–3 dB at 500 Hz and 2–4 dB at 3000 Hz in younger subjects. Despite differences in stimuli and procedure, thresholds obtained in the present study were similar to those obtained to speech stimuli in the study by Martin et al. (2000), who reported that an amplitude change of at least +2 dB was required to produce an N1-P2 response in young adults. A goal of this study was to assess whether the N1-P2 thresholds in response to intensity change approximates intensity discrimination thresholds measured behaviorally. He et al. (1998) reported that intensity discrimination thresholds measured behaviorally were higher for older than younger subjects at lower frequencies but not at higher frequencies. The current study showed a similar frequency-dependent aging effect, wherein N1-P2 intensity discrimination thresholds were significantly higher for older subjects as compared to younger subjects at 500 Hz but not at 3000 Hz. Furthermore, electrophysiological thresholds measured in the current study were similar in magnitude to behavioral thresholds reported by He et al. (1998).
4.2 Effect of thresholds, age, and frequency on the N1-P2
Several studies have shown that hearing loss can affect intensity discrimination (Christopherson et al., 1992; Florentine, 1983; Florentine et al., 1993; Humes et al., 1991) as well as N1 and P2 response latencies and amplitudes (Tremblay et al., 2003). Therefore, it was important to determine whether those subjects with higher audiometric thresholds were also the subjects with higher ΔI thresholds, and/or increased response latencies and amplitudes. In the current study, there were no significant correlations between pure-tone thresholds at 4000 or 8000 Hz and ΔI thresholds, peak amplitudes, or peak response latencies. This suggests that the elevated ΔI thresholds, as well as abnormal response latencies and amplitudes, were associated with either age-related changes in the central auditory system or to altered central activity due to more subtle changes in the auditory periphery.
Age-related changes were noted for both latency and amplitude, but were frequency dependent. That is, N1 and P2 latencies were significantly prolonged and mean amplitudes tended to be larger for older subjects than younger subjects at 500 Hz but not at 3000 Hz. In older subjects, N1-P2 latencies and amplitudes were affected by frequency, such that N1 and P2 latencies were significantly prolonged and N1-P2 amplitudes were significantly larger at 500 Hz as compared to 3000 Hz. In younger subjects, N1 and P2 response latencies were similar at 500 Hz and 3000 Hz. While response amplitudes were slightly larger at 500 Hz than at 3000 Hz, differences due to frequency were not statistically significant. The lack of a significant effect of frequency on the response amplitudes and latencies in younger subjects is in contrast to previous electrophysiologic studies. These studies examined the effects of frequency using pure-tone stimuli, and reported a frequency effect on the amplitude and latency of N1 and P2, such that both amplitude (Antinoro et al., 1969; Jacobson et al., 1992; Wunderlich et al., 2001) and latency (Alain et al., 1997; Jacobson et al., 1992; Wunderlich et al., 2001) decreased as frequency increased. Differences between these studies and the current study may be attributed to differences in procedures, such that in the current study, averaging was triggered not by a change in frequency or the onset of pure tone, but by small intensity increments imbedded in a continuous pure tone. Therefore, response latencies and amplitudes were more likely to be related to intensity discrimination abilities at a particular frequency. Consistent with previous electrophysiologic studies of intensity discrimination, response amplitudes and latencies appeared to be related to the magnitude of the intensity change, such that amplitudes increased and latencies decreased as ΔI increased.
4.3 Effect of age on N1 and P2 response latencies
At 500 Hz, both N1 and P2 latencies were significantly prolonged in older subjects as compared to younger subjects. Prolonged N1 and/or P2 latencies have been associated with a general slowing of neuronal processing, as well as decreased neuronal synchrony or temporal jitter within the central auditory nervous system. Age-related changes in response latency appear to occur in a task dependent manner. Furthermore, several lines of evidence suggest that spectral and temporal cues may be processed, at least partially, by different neural populations (Giard, 1995; Paavilainen et al., 1991; Pekkonen et al., 1996; Rao et al., 2001; Schroeder et al., 1995). Tremblay et al. (2004) reported that N1 latencies were prolonged in older subjects in response to speech stimuli with varying voice onset time but not to a simple pure-tone stimulus. Based on these results, the authors hypothesized that prolonged latencies for the N1-P2 response in older subjects may be due to reduced neural synchrony in response to temporal cues (Tremblay et al., 2003). Results from the current study support this hypothesis, as intensity discrimination at low frequencies, where older subjects exhibited prolonged latencies, is likely based on phase-locking and processing of temporal information, whereas spectral cues dominate performance at high frequencies. More general changes, such as decreased neuronal processing speed, would be more likely to result in prolonged latencies to intensity changes at both 500 and 3000 Hz.
4.4 Effect of age on N1 and P2 response amplitudes
Despite consistent reports of age-related decreases in response amplitudes of the compound action potential (Hellstrom et al., 1990) and the auditory brainstem response (Boettcher et al., 1993; Mills et al., 1990), several studies have reported increased N1 and/or P2 amplitudes in older subjects (Anderer et al., 1996; Harkrider et al., 2005; Pfefferbaum et al., 1980). Age-related changes in N1 and P2 response amplitudes appear to occur somewhat independently of changes in the periphery, and have been attributed to an increase in neural activity in the central auditory nervous system (Harkrider et al., 2005). In the current study, response amplitudes were significantly larger in older subjects at 500 Hz as compared to 3000 Hz. At 500 Hz, older subjects tended to have larger amplitudes than younger subjects at suprathreshold levels, although the effects were not statistically significant. Age-related differences in amplitude appeared to increase as intensity increased above threshold (Figure 8). The lack of a significant age-related difference in amplitude may be due, in part, to higher intensity discrimination thresholds of older subjects. That is, the largest intensity increment examined at 500 Hz was +5 dB, a level that was only slightly above ΔI threshold for many older subjects. The relatively large variance observed in amplitude measures of the older subject group at suprathreshold levels may also have contributed to the lack of a statistically significant age-related difference in amplitude.
4.5 Conclusions
In conclusion, results from the current study, showing decreased intensity discrimination at low frequencies with enhanced amplitudes but prolonged latencies in some older subjects, supports the hypothesis that aging may result in decreased inhibitory control of the central auditory nervous system. Changes in inhibition may affect neuronal synchrony and neuronal suppression, resulting in prolonged latencies, increased amplitudes, and decreased temporal acuity. These changes are consistent with results from animal studies that show age-related changes in temporal processing (Boettcher et al., 1996; Shaddock Palombi et al., 2001; Walton et al., 2002; Walton et al., 1997) and declines in inhibitory neurotransmittors, such as γ-Aminobutyric acid (GABA), in the central auditory system (Caspary et al., 1995; Caspary et al., 1999; Ling et al., 2005; Milbrandt et al., 1994; Milbrandt et al., 1997). In addition, several animal studies have suggested that manipulating inhibitory control by increasing or decreasing GABA can selectively alter temporal processing (Caspary et al., 2002; Gleich et al., 2003) and neuronal response latencies and amplitudes (Knight et al., 1990).
Although the current study assessed the effects of age on cortical evoked potentials, age-related changes in temporal processing are likely to occur in other areas of the auditory system. For example, cortical potentials, such as the N1-P2, are contingent on the resolution of the auditory periphery through the auditory cortex. Therefore, the age-related changes in intensity discrimination and response latencies and amplitudes reported in the current study may be the result of declines in auditory processing throughout the auditory system or a combination of peripheral and more central changes. Furthermore, although the current results support a theory of decreased inhibition, this hypothesis needs to be tested more directly in future studies, as there have been numerous studies that have reported physiologic as well as histologic changes in the central auditory system with age that may also affect auditory processing.
Acknowledgments
This investigation was supported by NIH/NIDCD P50 DC00422 and conducted in a facility constructed with support from Research Facilities Improvement Program Grant Number C06 RR-14516 from the National Center for Research Resources, National Institutes of Health. Helpful contributions from Elizabeth Poth and Fu-Shing Lee are gratefully acknowledged.
Footnotes
Because the amplitude of P1 was small and variable in some individual subjects, P1 amplitudes were not analyzed further.
Publisher's Disclaimer: This is a PDF file of an unedited manuscript that has been accepted for publication. As a service to our customers we are providing this early version of the manuscript. The manuscript will undergo copyediting, typesetting, and review of the resulting proof before it is published in its final citable form. Please note that during the production process errors may be discovered which could affect the content, and all legal disclaimers that apply to the journal pertain.
References
- American National Standards Institute. ANSI S3.6-1996. New York: American National Standards Institute, Inc; 1996. American National Standard specification for audiometers. [Google Scholar]
- Alain C, Woods DL, Covarrubias D. Activation of duration-sensitive auditory cortical fields in humans. Electroencephalogr Clin Neurophysiol. 1997;104:531–9. doi: 10.1016/s0168-5597(97)00057-9. [DOI] [PubMed] [Google Scholar]
- Anderer P, Semlitsch HV, Saletu B. Multichannel auditory event-related brain potentials: effects of normal aging on the scalp distribution of N1, P2, N2 and P300 latencies and amplitudes. Electroencephalogr Clin Neurophysiol. 1996;99:458–72. doi: 10.1016/s0013-4694(96)96518-9. [DOI] [PubMed] [Google Scholar]
- Antinoro F, Skinner PH, Jones JJ. Relation between sound intensity and amplitude of the AER at different stimulus frequencies. J Acoust Soc Am. 1969;46:1433–6. doi: 10.1121/1.1911881. [DOI] [PubMed] [Google Scholar]
- Arlinger SD, Jerlvall LB. Results of psychoacoustic and cortical evoked potential experiments using frequency and amplitude modulated stimuli. Scand Audiol. 1979;(Suppl):229–39. [PubMed] [Google Scholar]
- Attias J, Urbach D, Gold S, Shemesh Z. Auditory event related potentials in chronic tinnitus patients with noise induced hearing loss. Hear Res. 1993;71:106–13. doi: 10.1016/0378-5955(93)90026-w. [DOI] [PubMed] [Google Scholar]
- Barrett G, Neshige R, Shibasaki H. Human auditory and somatosensory event-related potentials: effects of response condition and age. Electroencephalogr Clin Neurophysiol. 1987;66:409–19. doi: 10.1016/0013-4694(87)90210-0. [DOI] [PubMed] [Google Scholar]
- Boettcher FA, Mills JH, Norton BL. Age-related changes in auditory evoked potentials of gerbils. I. Response amplitudes. Hear Res. 1993;71:137–45. doi: 10.1016/0378-5955(93)90029-z. [DOI] [PubMed] [Google Scholar]
- Boettcher FA, Mills JH, Swerdloff JL, Holley BL. Auditory evoked potentials in aged gerbils: responses elicited by noises separated by a silent gap. Hear Res. 1996;102:167–78. doi: 10.1016/s0378-5955(96)90016-7. [DOI] [PubMed] [Google Scholar]
- Boettcher FA, Poth EA, Mills JH, Dubno JR. The amplitude-modulation following response in young and aged human subjects. Hear Res. 2001;153:32–42. doi: 10.1016/s0378-5955(00)00255-0. [DOI] [PubMed] [Google Scholar]
- Boutros NN, Reid MC, Petrakis I, Campbell D, Torello M, Krystal J. Similarities in the disturbances in cortical information processing in alcoholism and aging: a pilot evoked potential study. Int Psychogeriatr. 2000;12:513–25. doi: 10.1017/s1041610200006621. [DOI] [PubMed] [Google Scholar]
- Brown WS, Marsh JT, LaRue A. Exponential electrophysiological aging: P3 latency. Electroencephalogr Clin Neurophysiol. 1983;55:277–85. doi: 10.1016/0013-4694(83)90205-5. [DOI] [PubMed] [Google Scholar]
- Caspary DM, Milbrandt JC, Helfert RH. Central auditory aging: GABA changes in the inferior colliculus. Exp Gerontol. 1995;30:349–60. doi: 10.1016/0531-5565(94)00052-5. [DOI] [PubMed] [Google Scholar]
- Caspary DM, Palombi PS, Hughes LF. GABAergic inputs shape responses to amplitude modulated stimuli in the inferior colliculus. Hear Res. 2002;168:163–73. doi: 10.1016/s0378-5955(02)00363-5. [DOI] [PubMed] [Google Scholar]
- Caspary DM, Holder TM, Hughes LF, Milbrandt JC, McKernan RM, Naritoku DK. Age-related changes in GABA(A) receptor subunit composition and function in rat auditory system. Neuroscience. 1999;93:307–12. doi: 10.1016/s0306-4522(99)00121-9. [DOI] [PubMed] [Google Scholar]
- Christopherson LA, Humes LE. Some psychometric properties of the Test of Basic Auditory Capabilities (TBAC) J Speech Hear Res. 1992;35:929–35. doi: 10.1044/jshr.3504.929. [DOI] [PubMed] [Google Scholar]
- Dubno JR, Lee FS, Matthews LJ, Mills JH. Age-related and gender-related changes in monaural speech recognition. J Speech Lang Hear Res. 1997;40:444–52. doi: 10.1044/jslhr.4002.444. [DOI] [PubMed] [Google Scholar]
- Florentine M. Intensity discrimination as a function of level and frequency and its relation to high-frequency hearing. J Acoust Soc Am. 1983;74:1375–9. doi: 10.1121/1.390162. [DOI] [PubMed] [Google Scholar]
- Florentine M, Reed CM, Rabinowitz WM, Braida LD, Durlach NI, Buus S. Intensity perception. XIV. Intensity discrimination in listeners with sensorineural hearing loss. J Acoust Soc Am. 1993;94:2575–86. doi: 10.1121/1.407369. [DOI] [PubMed] [Google Scholar]
- Giard MH, Lavikainen J, Reinikainen K, Perrin F, Bertrand O, Pernier J, Naatanen R. Separate representation of stimulus frequency, intensity, and duration in auditory sensory memory: an event-related potential and dipole-model analysis. J Cogn Neurosci. 1995;7:133–143. doi: 10.1162/jocn.1995.7.2.133. [DOI] [PubMed] [Google Scholar]
- Gleich O, Hamann I, Klump GM, Kittel M, Strutz J. Boosting GABA improves impaired auditory temporal resolution in the gerbil. Neuroreport. 2003;14:1877–80. doi: 10.1097/00001756-200310060-00024. [DOI] [PubMed] [Google Scholar]
- Harkrider AW, Plyler PN, Hedrick MS. Effects of age and spectral shaping on perception and neural representation of stop consonant stimuli. Clin Neurophysiol. 2005;116:2153–64. doi: 10.1016/j.clinph.2005.05.016. [DOI] [PubMed] [Google Scholar]
- He N, Dubno JR, Mills JH. Frequency and intensity discrimination measured in a maximum-likelihood procedure from young and aged normal-hearing subjects. J Acoust Soc Am. 1998;103:553–65. doi: 10.1121/1.421127. [DOI] [PubMed] [Google Scholar]
- Hellstrom LI, Schmiedt RA. Compound action potential input/output functions in young and quiet-aged gerbils. Hear Res. 1990;50:163–74. doi: 10.1016/0378-5955(90)90042-n. [DOI] [PubMed] [Google Scholar]
- Hoke M, Feldmann H, Pantev C, Lutkenhoner B, Lehnertz K. Objective evidence of tinnitus in auditory evoked magnetic fields. Hear Res. 1989;37:281–6. doi: 10.1016/0378-5955(89)90028-2. [DOI] [PubMed] [Google Scholar]
- Humes LE. Speech understanding in the elderly. J Am Acad Audiol. 1996;7:161–7. [PubMed] [Google Scholar]
- Humes LE, Christopherson L. Speech identification difficulties of hearing-impaired elderly persons: the contributions of auditory processing deficits. J Speech Hear Res. 1991;34:686–93. doi: 10.1044/jshr.3403.686. [DOI] [PubMed] [Google Scholar]
- Jacobson GP, Lombardi DM, Gibbens ND, Ahmad BK, Newman CW. The effects of stimulus frequency and recording site on the amplitude and latency of multichannel cortical auditory evoked potential (CAEP) component N1. Ear Hear. 1992;13:300–6. doi: 10.1097/00003446-199210000-00007. [DOI] [PubMed] [Google Scholar]
- Jerger J, Jerger S. Evoked response to intensity and frequency change. Arch Otolaryngol. 1970;91:433–6. doi: 10.1001/archotol.1970.00770040627007. [DOI] [PubMed] [Google Scholar]
- Kadner A, Viirre E, Wester DC, Walsh SF, Hestenes J, Vankov A, Pineda JA. Lateral inhibition in the auditory cortex: an EEG index of tinnitus? Neuroreport. 2002;13:443–6. doi: 10.1097/00001756-200203250-00016. [DOI] [PubMed] [Google Scholar]
- Knight RT, Brailowsky S. Auditory evoked potentials from the primary auditory cortex of the cat: topographic and pharmacological studies. Electroencephalogr Clin Neurophysiol. 1990;77:225–32. doi: 10.1016/0168-5597(90)90041-b. [DOI] [PubMed] [Google Scholar]
- Laffont F, Bruneau N, Roux S, Agar N, Minz M, Cathala HP. Effect of age on auditory evoked responses (AER) and augmenting-reducing. Neurophysiol Clin. 1989;19:15–23. doi: 10.1016/s0987-7053(89)80081-4. [DOI] [PubMed] [Google Scholar]
- Ling LL, Hughes LF, Caspary DM. Age-related loss of the GABA synthetic enzyme glutamic acid decarboxylase in rat primary auditory cortex. Neuroscience. 2005;132:1103–13. doi: 10.1016/j.neuroscience.2004.12.043. [DOI] [PubMed] [Google Scholar]
- Martin BA, Boothroyd A. Cortical, auditory, event-related potentials in response to periodic and aperiodic stimuli with the same spectral envelope. Ear Hear. 1999;20:33–44. doi: 10.1097/00003446-199902000-00004. [DOI] [PubMed] [Google Scholar]
- Martin BA, Boothroyd A. Cortical, auditory, evoked potentials in response to changes of spectrum and amplitude. J Acoust Soc Am. 2000;107:2155–61. doi: 10.1121/1.428556. [DOI] [PubMed] [Google Scholar]
- McCandless GA, Rose DE. Evoked cortical responses to stimulus change. J Speech Hear Res. 1970;13:624–34. doi: 10.1044/jshr.1303.624. [DOI] [PubMed] [Google Scholar]
- Milbrandt JC, Albin RL, Caspary DM. Age-related decrease in GABAB receptor binding in the Fischer 344 rat inferior colliculus. Neurobiol Aging. 1994;15:699–703. doi: 10.1016/0197-4580(94)90051-5. [DOI] [PubMed] [Google Scholar]
- Milbrandt JC, Hunter C, Caspary DM. Alterations of GABAA receptor subunit mRNA levels in the aging Fischer 344 rat inferior colliculus. J Comp Neurol. 1997;379:455–65. doi: 10.1002/(sici)1096-9861(19970317)379:3<455::aid-cne10>3.0.co;2-f. [DOI] [PubMed] [Google Scholar]
- Mills JH, Schmiedt RA, Kulish LF. Age-related changes in auditory potentials of Mongolian gerbil. Hear Res. 1990;46:201–10. doi: 10.1016/0378-5955(90)90002-7. [DOI] [PubMed] [Google Scholar]
- Naatanen R, Picton T. The N1 wave of the human electric and magnetic response to sound: a review and an analysis of the component structure. Psychophysiology. 1987;24:375–425. doi: 10.1111/j.1469-8986.1987.tb00311.x. [DOI] [PubMed] [Google Scholar]
- Oates PA, Kurtzberg D, Stapells DR. Effects of sensorineural hearing loss on cortical event-related potential and behavioral measures of speech-sound processing. Ear Hear. 2002;23:399–415. doi: 10.1097/00003446-200210000-00002. [DOI] [PubMed] [Google Scholar]
- Ostroff JM, Martin BA, Boothroyd A. Cortical evoked response to acoustic change within a syllable. Ear Hear. 1998;19:290–7. doi: 10.1097/00003446-199808000-00004. [DOI] [PubMed] [Google Scholar]
- Paavilainen P, Alho K, Reinikainen K, Sams M, Naatanen R. Right hemisphere dominance of different mismatch negativities. Electroencephalogr Clin Neurophysiol. 1991;78:466–79. doi: 10.1016/0013-4694(91)90064-b. [DOI] [PubMed] [Google Scholar]
- Pantev C, Hoke M, Lehnertz K, Lutkenhoner B. Neuromagnetic evidence of an amplitopic organization of the human auditory cortex. Electroencephalogr Clin Neurophysiol. 1989;72:225–31. doi: 10.1016/0013-4694(89)90247-2. [DOI] [PubMed] [Google Scholar]
- Pekkonen E, Rinne T, Reinikainen K, Kujala T, Alho K, Naatanen R. Aging effects on auditory processing: an event-related potential study. Exp Aging Res. 1996;22:171–84. doi: 10.1080/03610739608254005. [DOI] [PubMed] [Google Scholar]
- Pfefferbaum A, Ford JM, Roth WT, Kopell BS. Age-related changes in auditory event-related potentials. Electroencephalogr Clin Neurophysiol. 1980;49:266–76. doi: 10.1016/0013-4694(80)90221-7. [DOI] [PubMed] [Google Scholar]
- Pfeiffer E. A short portable mental status questionnaire for the assessment of organic brain deficit in elderly patients. J Am Geriatr Soc. 1975;23:433–41. doi: 10.1111/j.1532-5415.1975.tb00927.x. [DOI] [PubMed] [Google Scholar]
- Picton TW, Stuss DT, Champagne SC, Nelson RF. The effects of age on human event-related potentials. Psychophysiology. 1984;21:312–25. doi: 10.1111/j.1469-8986.1984.tb02941.x. [DOI] [PubMed] [Google Scholar]
- Rao SM, Mayer AR, Harrington DL. The evolution of brain activation during temporal processing. Nat Neurosci. 2001;4:317–23. doi: 10.1038/85191. [DOI] [PubMed] [Google Scholar]
- Schroeder MM, Ritter W, Vaughan HG., Jr The mismatch negativity to novel stimuli reflects cognitive decline. Ann N Y Acad Sci. 1995;769:399–401. doi: 10.1111/j.1749-6632.1995.tb38155.x. [DOI] [PubMed] [Google Scholar]
- Shaddock Palombi P, Backoff PM, Caspary DM. Responses of young and aged rat inferior colliculus neurons to sinusoidally amplitude modulated stimuli. Hear Res. 2001;153:174–80. doi: 10.1016/s0378-5955(00)00264-1. [DOI] [PubMed] [Google Scholar]
- Tremblay KL, Piskosz M, Souza P. Effects of age and age-related hearing loss on the neural representation of speech cues. Clin Neurophysiol. 2003;114:1332–43. doi: 10.1016/s1388-2457(03)00114-7. [DOI] [PubMed] [Google Scholar]
- Tremblay KL, Billings C, Rohila N. Speech evoked cortical potentials: effects of age and stimulus presentation rate. J Am Acad Audiol. 2004;15:226–37. doi: 10.3766/jaaa.15.3.5. quiz 264. [DOI] [PubMed] [Google Scholar]
- Turner CW, Nelson DA. Frequency discrimination in regions of normal and impaired sensitivity. J Speech Hear Res. 1982;25:34–41. doi: 10.1044/jshr.2501.34. [DOI] [PubMed] [Google Scholar]
- Walton JP, Simon H, Frisina RD. Age-related alterations in the neural coding of envelope periodicities. J Neurophysiol. 2002;88:565–78. doi: 10.1152/jn.2002.88.2.565. [DOI] [PubMed] [Google Scholar]
- Walton JP, Frisina RD, Ison JR, O’Neill WE. Neural correlates of behavioral gap detection in the inferior colliculus of the young CBA mouse. J Comp Physiol [A] 1997;181:161–76. doi: 10.1007/s003590050103. [DOI] [PubMed] [Google Scholar]
- Wolpaw JR, Penry JK. A temporal component of the auditory evoked response. Electroencephalogr Clin Neurophysiol. 1975;39:609–20. doi: 10.1016/0013-4694(75)90073-5. [DOI] [PubMed] [Google Scholar]
- Woods DL. Auditory selective attention in middle-aged and elderly subjects: an event-related brain potential study. Electroencephalogr Clin Neurophysiol. 1992;84:456–68. doi: 10.1016/0168-5597(92)90033-8. [DOI] [PubMed] [Google Scholar]
- Woods DL. The component structure of the N1 wave of the human auditory evoked potential. Electroencephalogr Clin Neurophysiol Suppl. 1995;44:102–9. [PubMed] [Google Scholar]
- Woods DL, Clayworth CC. Age-related changes in human middle latency auditory evoked potentials. Electroencephalogr Clin Neurophysiol. 1986;65:297–303. doi: 10.1016/0168-5597(86)90008-0. [DOI] [PubMed] [Google Scholar]
- Wunderlich JL, Cone-Wesson BK. Effects of stimulus frequency and complexity on the mismatch negativity and other components of the cortical auditory-evoked potential. J Acoust Soc Am. 2001;109:1526–37. doi: 10.1121/1.1349184. [DOI] [PubMed] [Google Scholar]