

Abstract
One hallmark of tuberous sclerosis (TSC) is the presence of highly epileptogenic dysplastic cerebral cortex (tubers) composed of abnormally shaped neurons and giant cells. Mutation of the TSC gene (TSC2) may disrupt differentiation and maturation of neuronal precursors, since the TSC2 gene product tuberin is believed to regulate cellular proliferation. To test the hypothesis that cells in tubers may retain the molecular phenotype of embryonic or immature neurons, tubers from five TSC patients were probed with antibodies to proteins expressed in neuronal precursors (nestin, Ki-67, and proliferating cell nuclear antigen). Many dysmorphic neurons and giant cells in tubers were stained by these antibodies, while neurons in adjacent normal and control cortex were not labeled. To further characterize the molecular phenotype of cells in tubers, we developed a methodology in which poly(A)+ mRNA was amplified from immunohistochemically labeled single cells in paraffin-embedded brain specimens. This approach enabled us to detect mRNAs encoding nestin, and other cytoskeletal elements, cell cycle markers, and synthetic enzymes present in individual nestin-stained cells by means of reverse Northern blotting. We conclude that the presence of immature phenotypic markers (mRNAs and proteins) within tubers suggests disruption of cell cycle regulation and neuronal maturation in TSC during cortical development. Characterization of multiple mRNAs within fixed, immunohistochemically labeled cells provides a powerful tool for studying gene expression and the molecular pathophysiology of many neurologic diseases.
Keywords: cell cycle, nestin, cortical dysplasia, giant cells, mRNA
Tuberous sclerosis (TSC) is an autosomal dominant disease which is characterized by mental retardation, epilepsy, and tumors of the skin, retina, heart, kidney, and brain (1). Tubers are regions of focal cerebral cortical dysplasia in TSC which exhibit disorganized or absent cortical lamination and dysmorphic neurons with abnormal dendritic arborization and spine density (2, 3, 4, 5). Many of these abnormally shaped neurons are stellate or multipolar cells not characteristic of normal cortex (2). Dysmorphic giant cells, which extend short thickened processes, are also found in tubers (3, 4, 5, 6). The embryonic origin and cellular phenotype of giant cells remains to be clearly defined, although conflicting evidence has suggested that they may be glial or neuronal derivatives (3, 4, 5, 6). The cerebral cortex surrounding tubers is typically histologically normal. Clinically, tubers are frequently identified as epileptogenic foci, which require surgical excision in patients with TSC and refractory epilepsy (1).
The molecular events that lead to the genesis of abnormal neurons and giant cells in tubers during cortical development are unknown. One hypothesis is that aberrant migration of an abnormal population of neurons and/or glia results in the cytoarchitecture characteristic of tubers. Another view is that migration into cortex of primitive neuroepithelial cells, which retain the potential for mitosis, could result in the proliferation of dysmorphic cells within cortex (2, 3). While a putative chromosome 9q34 locus has been postulated for approximately 50% of TSC cases (7), the TSC2 gene on chromosome 16p13.3 was recently identified (7, 8). The 5474-bp TSC2 transcript encodes a 198-kDa protein, tuberin, containing a small region homologous to the GTPase-activating protein GAP3, which is part of a regulatory cell cycle signaling cascade (8). Since tuberin may modulate cell growth and proliferation during development (8, 9) and because many TSC lesions are neoplasms, tuberin could function as a tumor or growth suppresser (8, 9). In support of this hypothesis, loss of allelic TSC2 heterozygosity was demonstrated within tubers and other TSC lesions by restriction fragment length polymorphism (RFLP) mapping that compared affected and adjacent unaffected tissue (9). This finding suggested that a somatic “second-hit” TSC2 mutation could produce TSC lesions by a genetic mechanism similar to that of other tumor suppresser genes such as neurofibromin in neurofibromatosis or the retinoblastoma gene product, Rb. Tubers, however, are not neoplasms, and thus an alternative hypothesis to explain how the TSC2 mutation leads to tuber formation is needed.
We hypothesized that one role for tuberin might be to facilitate maturation of embryonic neuronal precursors prior to cortical migration. Normally neurons are postmitotic before migrating from the ventricular zone to the cortical plate (10, 11). An inactivating TSC2 mutation in a subset of embryonic neuronal precursors in the ventricular zone might stall entrance into a postmitotic state prior to cortical migration. If so, many or all cells within tubers may retain embryonic phenotypic features that are characteristic of immature neuroepithelial cells but not mature neurons. To support this hypothesis, we used antibodies to detect the embryonic intermediate filament protein nestin (12, 13, 14) as well as the cell cycle markers proliferating cell nuclear antigen (PCNA) (15) and Ki-67 (antibody MIB-1) (16, 17) in tubers. These three proteins are expressed transiently during G1, G2, S, and mitotic phases of the cell cycle by neuroepithelial cells within the ventricular zone of embryonic cortex, but not by mature neurons after migration (12, 13, 14, 15, 16, 17). All have also been identified in neuroepithelial tumors whose proliferation also likely results from disrupted cell cycle control (12).
While immunohistochemical labeling with specific markers provides some information regarding the developmental phenotype of individual cells, tubers are histologically heterogeneous lesions containing a variety of abnormal cell types. Indeed, one issue critical to studying tubers and providing insight into their epileptogenicity is that not all cells within tubers may be abnormal. Unfortunately, identifying differences at the molecular level between immature and normal cells is difficult because homogenization of tuber samples for mRNA analysis will include all cell types (neurons, giant cells, and glial cells), thereby precluding any possible conclusions regarding the molecular composition of only immunohistochemically labeled giant cells or neurons. Furthermore, in situ hybridization (ISH) or the in situ polymerase chain reaction (ISPCR) on tissue sections is time consuming, since only one or two probes can be used at a time (18). Thus, we devised a method to amplify and detect poly(A)+ mRNA from immunohistochemically labeled cells in tubers to directly assess the molecular pathology of single abnormal cells (Fig. 1). These analyses were performed in fixed paraffin-embedded cortical tuber specimens. Specifically, poly(A)+ mRNA was amplified from individual nestin-labeled giant cells and dysmorphic neurons to identify mRNAs suggestive of cellular immaturity and to detect the TSC2 transcript. This approach permitted assessment of gene expression in a set of phenotypically defined individual cell types and the molecular pathophysiology of tuber formation.
Figure 1.
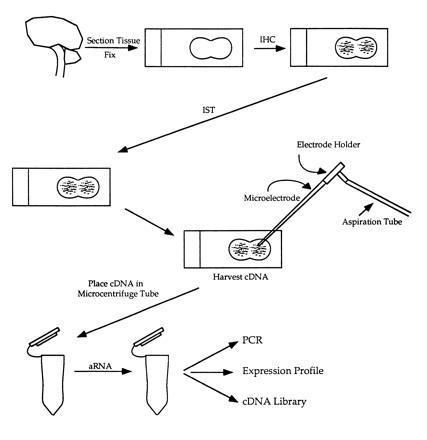
Schematic of mRNA amplification after immunohistochemical labeling. IHC, immunohistochemistry; IST, in situ transcription; aRNA, amplified mRNA.
MATERIALS AND METHODS
Pathologic Material.
Cortical tubers from frontal and temporal neocortex were obtained during epilepsy surgery from five unrelated patients ages 2–11 years who met clinical criteria for tuberous sclerosis (1). In three of these cases, a family history of TSC was documented, although formal genetic linkage analysis was not performed. Control samples from frontal and temporal cortex were obtained post mortem from three children (ages 2 months, 4 years, and 10 years) without a history of TSC or other neurologic disease who died of nonneurologic causes. Specimens were fixed by immersion in 4% paraformaldehyde/PBS (vol/vol)/70% ethanol/150 mM NaCl (vol/vol), or Bouin’s fixative, embedded in paraffin, and cut into 7-μm sections.
IHC.
Antibody labeling was performed as described previously, utilizing microwave enhancement of paraformaldehyde- and Bouin’s-fixed material (12). Tissue to be analyzed for mRNA was not microwaved. Sections were labeled with monoclonal antibodies to α internexin (courtesy R. Liem, Columbia University); glial fibrillary acidic protein (GFAP; Boehringer Mannheim); microtubule-associated protein 2 (MAP2); MIB-1 (AMAC; Westbrook, ME), which labels an active cell cycle epitope encoded by a repetitive 66-bp Ki-67 element (15, 16); and PCNA, which is a DNA polymerase σ auxillary factor (Dako). MIB-1 and PCNA serve as indicators of non-G0 cell cycle state. Rat tonsillar epithelium exhibited extensive nuclear labeling with both MIB-1 and PCNA antibodies (not shown) and served as a positive control for antibody staining. A rabbit polyclonal antiserum (AN-130) that recognizes human nestin was raised against recombinant rat nestin protein expressed in Escherichia coli (12). Non-microwave-enhanced tissue was used for in situ transcription (see below).
To histologically assess RNA in the tissue specimens, sections were stained as previously described (19) with the fluorochrome acridine orange (AO), which appears orange (absorbing at 470 nm) when bound to RNA. Most giant cells and neurons exhibited strong AO staining, suggesting that RNA had not degraded despite a lengthy fixation (greater than 72 hr) and storage period (up to 7 years) in some pathologic specimens.
IST.
Following IHC, Bouin’s- and 4% paraformaldehyde-fixed sections were washed in 0.2 M HCl for 20 min, rinsed in phosphate-buffered saline (PBS, pH 7.4), and then placed in proteinase K (50 μg/ml) for 30 min. IST was performed on regions characterized by extensive nestin and MIB-1 immunolabeling. An 11-nt oligo(dT) primer coupled to a T7 RNA polymerase promoter sequence (oligo-dT-T7) was hybridized to cellular poly(A)+ mRNA for 12–18 hr with 50% formamide- and diethylpyrocarbonate (DEPC)-treated distilled H2O directly on the section (20, 21). cDNA was synthesized directly on the section with avian myeloblastosis virus reverse transcriptase (0.5 unit/μl; Seikagaku America, Rockville, MD) in IST reaction buffer [10 mM Tris·HCl, pH 8.3/6 mM MgCl2/120 mM KCl/7 mM dithiothreitol/250 μM each dATP, dCTP, dGTP, and dTTP/RNAsin (Promega) at 0.12 unit/μl]. Sections were washed for 8–12 hr in 0.5× SSC. In several sections from each specimen, cDNA from the entire section was extracted with 0.2 M NaOH/1% SDS and mRNA amplification was performed as below. In other sections, individual cells were aspirated (below). In this way, mRNA amplified from whole sections and individual cells was compared.
Single-Cell mRNA Amplification.
Following IHC and IST, individual nestin-labeled cells were dissected away from the surrounding neuropil by using a micromanipulator and aspirated gently into glass microelectrodes (Fig. 2). Nonstained pyramidal neurons in control specimens were visualized by phase-contrast microscopy and aspirated. While IST had already been performed on sections, to ensure cDNA synthesis, the microelectrodes were filled with electrode buffer (10 mM Hepes buffer, pH 7.4/120 mM KCl/1 mM MgCl2), dNTPs (250 μM each), oligo-dT-T7 primer, and avian myeloblastosis virus reverse transcriptase, and cDNA synthesis was performed for 90 min at 40°C (22). mRNA from sections and cells was amplified (aRNA) from double-stranded cDNA template with T7 RNA polymerase (Epicentre Technologies, Madison, WI) incorporating [32P]CTP (22). After initial amplification, a broad spectrum of high to low molecular weight mRNAs was detected from sections and individual cells (approximately 1–6 kbp); this spectrum was similar to that of frozen sections and whole live cells (19, 21). aRNA served as a template for second-round cDNA synthesis, whose product then served as template for a second aRNA amplification incorporating [32P]CTP. This radiolabeled aRNA was used as a probe for reverse Northern (slot) blots.
Figure 2.
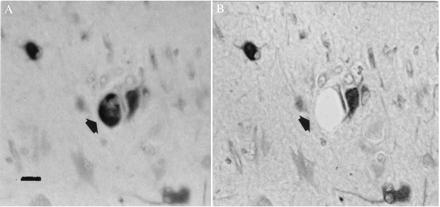
Nestin-labeled giant cell (arrow) visualized before (A) and after (B) microdissection and aspiration. Note adjacent neuron unaffected by procedure. In A, section is viewed under water, while in B the section has been dehydrated and coverslipped. (Bar = 40 μm.)
Reverse Northern Analysis.
To detect specific mRNAs present in single neurons and giant cells, reverse Northern (slot) blotting was performed with linearized plasmid cDNAs (20, 21, 22). Our specific strategy was to select cDNAs which reflected a sample of mRNAs present in individual neurons with either mature or immature phenotype and which would complement the immunohistochemical data. mRNAs included human nestin (courtesy of U. Lendahl, Karolinska Institutet, Stockholm); α internexin (courtesy of R. Liem); low and medium molecular weight neurofilament (NFL, NFM); Ki-67 (American Type Culture Collection, Baltimore, MD); cyclin D1; the L- and N-type calcium channels (Ca-L and Ca-N); trkA; the KV1 potassium channel; connexins (CX) 26, 32, and 43 (courtesy D. Paul, Harvard University); growth-associated protein 43 (GAP43); the synthetic enzyme GAD65; the α2, α3, α5, and α6 subunits of the type A γ-aminobutyric acid receptor (GABAA receptor); nitric oxide synthase (NOS); GFAP; MAP2; platelet-derived growth factor (PDGF); basic fibroblast growth factor (bFGF); nerve growth factor receptor (NGFR); the α subunit of calcium/calmodulin-dependent protein kinase (CaMKII); and two regions (2- and 3-kbp fragments) of the TSC2 transcript (courtesy of J. Sampson, University of Cardiff, Wales) adherent to nylon membranes (Hybond). Blots were probed with 32P-radiolabeled aRNA from whole sections or individual cells. Prehybridization (8 hr) and hybridization (24 hr) were in standard saline/phosphate/EDTA (SSPE) buffer containing Denhardt’s solution, 50% formamide, 0.1% SDS, and salmon sperm DNA at 200 μg/ml at 42°C. Blots were apposed to film for 24–48 hr. Hybridization was detected by densitometry with imagequant 3.3 software.
PCR.
PCR primers were generated to human nestin cDNA approximately 490 bp apart (sense primer, 5′-AGAGGGGAATTCCTGGAG-3′ and antisense primer, 5′-CTGAGGACCAGGACTCTCTA-3′). After an initial denaturation at 93°C, 35 cycles of 94°C for 45 sec, 46°C for 1 min, and 70°C for 2 min were performed with a final 5-min extension at 72°C in 2 mM MgCl2. PCR products were transferred to nylon membranes and probed with [32P]dCTP-radiolabeled human nestin cDNA.
Library Screen.
A fetal human brain library (λgt11, courtesy of R. Neve, Harvard University) was screened with radiolabeled aRNA generated from a single control pyramidal neuron to estimate the complexity of the pool of amplified mRNA from individual fixed cells. Approximately 1200 plaques were screened and nitrocellulose filters were prehybridized for 16 hr. A radiolabeled aRNA probe was hybridized to the filters for 48 hr at 42°C. Film autoradiographs were generated and individual hybridized plaques were counted, using a PhosphorImager (Molecular Dynamics) and imagequant 3.3 software after a 48-hr exposure.
RESULTS
Immunohistochemical Identification of Nestin and Cell Cycle Markers.
Hematoxylin staining revealed disruption of normal cortical laminar architecture within tubers. A small penumbra of normal-appearing cortex (six layers, normal radial orientation of pyramidal neurons) surrounded the tubers and was devoid of giant cells. Giant cells and dysmorphic neurons within cortical tubers from five TSC patients were labeled with MIB-1 (Fig. 3), PCNA, and nestin antibodies (Fig. 4 A and B) in all cortical layers. One hundred dysmorphic neurons and 100 giant cells were counted within three 2.0-mm2 regions from three sections of each tuber specimen and the percentage of immunoreactive cells was determined for each antibody. Regions selected for cell counts were similar to adjacent sections from which single cells were aspirated for mRNA analysis. Overall, approximately 80% of the giant cells and 50–60% of dysmorphic neurons, most of which were of pyramidal morphology and exhibited thick abnormal-appearing apical dendrites, were nestin immunoreactive. The remaining cells were either faintly stained or not immunoreactive. Nestin immunolabeling was prominent throughout the somatodendritic domain and proximal axon segment. Nuclear MIB-1 or PCNA immunoreactivity was seen in 3–5% of the giant cells but few of the neurons (<1%) within the areas analyzed. Infrequent astrocytes in tubers, identified by GFAP immunostaining in adjacent sections, were nestin labeled, but very few of them (<0.5%) exhibited nuclear MIB-1 or PCNA labeling. Of note, none of the giant cells were GFAP stained. Nestin and MIB-1/PCNA immunolabeling was not detected in any neurons or glia in the small regions of normal cortex surrounding the tubers or in any control specimens (Fig. 4C), although faint nestin staining of capillary endothelial cells was noted in control and TSC tissue. To further characterize the neurons and giant cells in tubers, sections were stained with MAP2 and internexin antibodies. Internexin (23), an intermediate filament protein, and MAP2 are expressed by differentiating neurons after nestin diminishes, and both persist into maturity. Approximately 50–70% of the dysmorphic pyramidal neurons and giant cells within tubers were MAP2 or internexin labeled (Fig. 5), suggesting that they were of neuronal lineage. Most neurons in cortex surrounding tubers and in control cortex were also MAP2 and internexin stained. Thus, giant cells and neurons within tubers expressed proteins typically found in embryonic neuroepithelial cells associated with G1, S, G2, or M phases of the cell cycle, whereas neurons in adjacent unaffected cortices and in normal cortex did not express these proteins. The identification of cytoskeletal elements found in more differentiated neurons suggests that neurons and giant cells in tubers are of neuronal lineage despite the persistence of some embryonic markers. These data support the hypothesis that many cells within tubers retain embryonic features normally present in neuroepithelial precursors and not mature neurons.
Figure 3.

Giant cells and neurons within cortical tubers are labeled with the Ki-67 (MIB-1) antibody (arrow). Nuclear and cytoplasmic staining is noted. (Bar = 30 μm.)
Figure 4.
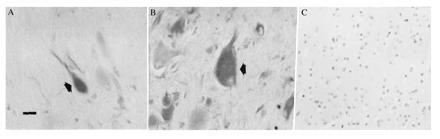
(A and B) Neurons (A) and giant cells (B) labeled with nestin antibodies (arrows). Neuronal staining was within the somatodendritic region and proximal axonal segment. (Bar = 30 μm.) (C) Absence of nestin staining in control temporal cortex.
Figure 5.

Giant cells (arrow) labeled with internexin antibodies. (Bar = 30 μm.)
mRNA Expression Profiles from Whole Brain Sections.
Many mRNAs were detected by reverse Northern blotting with radiolabeled aRNA generated from TSC and control tissue sections (Fig. 6 Upper). cDNAs were chosen for analysis to provide a representative sample of neuronal and glial cell mRNAs and also to provide corroborative data on proteins detected by IHC. mRNAs identified included human nestin, internexin, NFL, NFM, MAP2, CaMKII, GAD65, CX32, trkA, Ca-N, and the glial markers GFAP and CX43. However, mRNA encoding several mRNAs, including the α2 and α3 GABAA receptor subunits and the Ca-L were not detected in TSC or control individuals. The presence or absence of mRNAs from whole sections provided a useful backdrop for subsequent single-cell analysis. For example, detection of GFAP mRNA in whole sections but not individual giant cells (see below) provided evidence that GFAP mRNA was in fact absent from giant cells and not merely undetectable due to limitations of the mRNA amplification. In contrast, finding nestin mRNA in control brain sections was surprising, since neuronal nestin immunoreactivity was not observed in these specimens. However, nestin amplified from endothelial cells could have accounted for this result, since mRNA isolated from whole sections reflects all cell types present—e.g., neuronal, glial, and endothelial.
Figure 6.
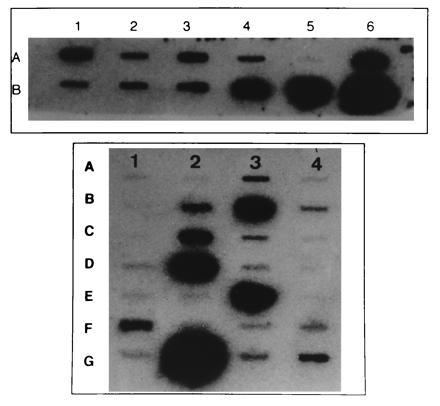
Slots blots generated from whole tuber sections (Upper) and single giant cells (Lower). There is a heterogeneous pattern of hybridization intensities on both blots. Nonspecific hybridization was determined by using BlueScript vector cDNA (slot A5, Upper; slot A1, Lower). Individual cDNAs are as follows: (Upper) A1, Ca-N; A2, NFL; A3, NFM; A4, internexin; A5, BlueScript; A6, GFAP; B1, trkA; B2, CX32; B3, GAD65; B4, nestin; B5, MAP2; B6, CaMKII. (Lower) A1, BlueScript; A2, α2 of GABAA receptor; A3, internexin; A4, α3 of GABAA receptor; B1, TSC2 (2 kb); B2, NFL; B3, nestin; B4, α5 of GABAA receptor; C1, TSC2 (3 kb); C2, NFM; C3, Ca-N; C4, Ca-L; D1, NOS; D2, GAD65; D3, α6 of GABAA receptor; D4, GFAP; E1, PDGF; E2, bFGF; E3, MAP2; E4, NGFR; F1, cyclin D1; F2, CX43; F3, GAP43; F4, CX32; G1, KV1 potassium channel; G2, CaMKII; G3, CX26; and G4, Ki-67.
Analysis of Cell Cycle Marker, Nestin, and TSC2 mRNA in Nestin-Labeled Cells.
A diverse population of mRNAs was detected in each of six nestin immunolabeled giant cells and five nestin labeled neurons taken from the three familial and two sporadic TSC cases (Fig. 6, bottom panel). mRNA encoding several neuronal cytoskeletal elements including human nestin, NFL, NFM, MAP2, GAP43, and internexin were identified. mRNA encoding the cell cycle markers Ki-67 and cyclin D1, another cell cycle marker important in G1/S-phase progression (24), were detected in neurons and giant cells at differing hybridization intensities. mRNAs encoding the synthetic enzymes CaMKII and GAD65, the α5 and α6 subunits of the GABAA receptor, KV1, and Ca-N, and the gap junction proteins CX26 and CX32 were also identified in neurons and giant cells. Hybridization to the TSC2 transcripts was detected in two giant cells and two neurons from two familial and one sporadic TSC patient. Hybridization to the 3-kbp fragment containing the 3′ end of the mRNA was stronger than to the 2-kbp fragment. In contrast, the TSC2 transcripts were not detected in four giant cells and three neurons from one familial and one sporadic TSC patient.
Hybridization intensities of several aRNAs generated from single cells was different from the intensity observed for entire sections and likely reflected different mRNA abundances relative to the mRNA population from single cells versus an entire section. The absence of several mRNAs such as the α2 and α3 GABAA receptor subunit, PDGF, NOS, and Ca-L mRNA in single cells was similar to IST results and suggested that these mRNAs were not amplified by our methodology. In contrast, the lack of GFAP or CX43 mRNA in nestin-immunolabeled dysmorphic neurons and giant cells, but amplification from whole sections, suggested that these cells were of neuronal and not glial phenotype.
The mRNAs identified in seven non-nestin-immunoreactive layer V pyramidal neurons aspirated from three normal control temporal neocortices included many of the mRNAs detected in TSC specimens such as nestin, MAP2, internexin, α5 and α6 GABAA receptor subunits, GAP43, CX32, CaMKII, NFL, and NFM. In addition, both portions of the TSC2 transcript were identified in each of the control individuals. In contrast, mRNA encoding the cell cycle markers Ki-67 and cyclin D1 were not detected. Similarly, CX26, CX43, and GFAP mRNAs were not identified.
Because control neurons did not exhibit nestin immunoreactivity, nestin mRNA was verified by the PCR and Southern blotting. Nestin PCR products of appropriate size were amplified from double-stranded cDNA from three nestin-immunoreactive giant cells, one TSC neuron, and one control (nonimmunoreactive) neuron. One giant cell failed to yield a PCR product. Nestin PCR products were Southern blotted to nylon membranes and then probed with radiolabeled human nestin cDNA. Hybridization was identified in all of the cells that showed a PCR product of the predicted size (five of the six cells; Fig. 7).
Figure 7.
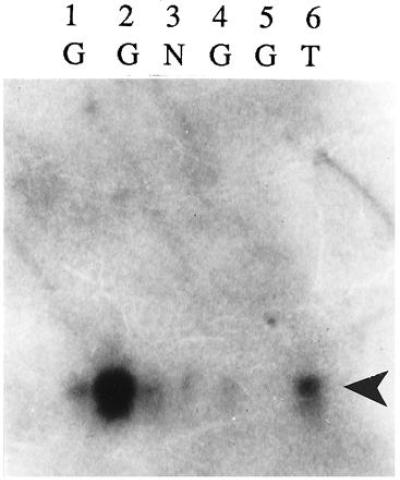
Southern blot of nestin PCR product (490 bp, arrowhead) followed by hybridization with [32P]dCTP-radiolabeled human nestin cDNA as a probe. Hybridization was detected in three giant cells (G; lanes 1, 2, and 4), a TSC neuron (T; lane 6), and a control neuron (N; lane 3). A 490-bp PCR product was not detected in one giant cell (lane 5).
Assessment of aRNA Population Complexity.
To provide information about the complexity of the mRNA population accessible by this technique, a fetal human brain library was screened with radiolabeled aRNA from a single cell. Hybridization to approximately 15% of the 1200 plaques screened was identified after film exposure for 48 hr. This percentage is 50–75% of what has been reported for single live neurons (22) as well as for cDNA probes generated from specific mRNAs (25).
DISCUSSION
The data presented are, to our knowledge, the first to address both the cellular and molecular pathophysiology of TSC at the single-cell level. We demonstrate that neurons and giant cells in cortical tubers express several mRNAs and proteins which are characteristic of embryonic neuroepithelial precursor cells. These findings suggest a fundamental disruption of neuronal maturation in tubers, although whether alterations in neuronal maturation resulted directly from a TSC2 mutation remains to been determined. We hypothesize that an existing TSC2 mutation/deletion may disrupt maturation of cortical neuroepithelial cells in association with a postulated somatic “second-hit” TSC2 mutation (8, 9) which occurs in the ventricular zone prior to cessation of cell cycle activity and onset of neuronal migration. Since tuberin may function as a growth suppresser (8), a loss-of-function TSC2 mutation/deletion may remove regulatory controls which direct neuroepithelial cells toward a postmitotic state. Embryonic neuroepithelial cells thus fail to fully differentiate prior to cortical migration in tubers. Incomplete cellular maturation would likely compromise appropriate migration into the cortical plate. However, tubers do not grow like neoplasms and so it is unlikely that neurons and giant cells within tubers can actively proliferate or undergo mitosis. Indeed, mRNA encoding cyclin D2 was recently identified in a small population of postmitotic rat cortical neurons (26), suggesting that cell cycle proteins such as PCNA, Ki-67, and cyclin D1 may have other functions distinct from cell cycle dynamics. Moreover, the presence of internexin and MAP2 immunoreactivity and mRNA in neurons and giant cells suggested that neuronal maturation was not completely disrupted within tubers. Neurons and giant cells in tubers are unique in that they maintain a neuronal phenotype, as evidenced by MAP2 and internexin, and also express cell cycle markers.
mRNAs characteristic of normal neurons (but not glia) such as CaMKII, GAP43, calcium channel subunits, and intermediate filaments were identified in TSC neurons and giant cells. These results suggested that while cells within tubers may retain embryonic features, the expression of many genes was not completely disrupted. Expression profile differences between TSC and control cells may reflect quantitative and qualitative disregulation of transcription. Indeed, subtle differences in the mRNA expression profiles of giant cells and neurons within tubers compared with normal cortical neurons may have substantial developmental effects. These data also highlight the likelihood that there is a heterogeneous population of cells within tubers, some of which may be more or less affected by a TSC2 mutation. One critical question which extends from these findings is whether or not abnormal cells within tubers are derived from a single (clonal) or heterogeneous population of precursors cells affected by the TSC2 mutation.
In one study, the Ki-67 antigen was not identified immunohistochemically in several “tuber-like” specimens (27). Since only one patient in this series had overt clinical manifestations of TSC, it is difficult to determine whether the remaining specimens were from TSC patients. Ki-67 mRNA was not evaluated in this study. In our specimens from patients with clinically defined TSC, immunohistochemical detection of PCNA and Ki-67 protein and amplification of Ki-67 and cyclin D1 mRNA within tubers but not control cortices strongly supported the hypothesis that giant cells and neurons within tubers express cell cycle markers not characteristic of differentiated postmitotic cells.
Lack of hybridization of the TSC2 mRNA in several single giant cells and neurons lends support to the hypothesis that a 16p mutation/deletion may occur in both inherited and sporadic forms of TSC (9). However, detection of the TSC2 mRNA in two other patients suggests either that these were associated with the putative chromosome 9q34 TSC1 locus (non-TSC2 cases) which account for approximately 50% of TSC or that the TSC2 mRNA detected may have contained a small mutation which altered expression of functional tuberin but permitted detection by hybridization to the TSC2 cDNA. Further analysis of the expressed TSC2 mRNA in giant cells is currently under way (P.B.C. and J.E., unpublished work).
Possible Translational Regulation of Nestin in TSC and Normal Neurons.
Nestin protein is present in human embryonic neurons at 20–30 weeks of gestation but has not been detected in neurons after birth (13, 14). In rodent cortical neurons, loss of nestin mRNA expression correlates with disappearance of nestin immunoreactivity (13). In our human control specimens, nestin mRNA was identified by expression profiling, PCR amplification, and Southern blotting despite the absence of nestin immunoreactivity. The presence of nestin mRNA but not protein in normal neurons suggests that nestin protein expression during neuronal development may be translationally as well as transcriptionally regulated. The occurrence of nestin protein in tubers but not in adjacent normal cortex may result from altered translational control in association with somatic “second-hit” TSC2 mutation within a particular region of embryonic cortex.
Neuronal Lineage for Giant Cells.
Conflicting studies have argued a neuronal or glial lineage for giant cells. For example, neuron-specific enolase but not GFAP staining in giant cells suggested a neuronal phenotype (28), while the presence of glycogen-enriched processes and hemidesmosomes around giant cells supported a glial phenotype (29). Previous studies have identified a heterogeneous population of neuronal and glial markers such as tubulin, neurofilament, and vimentin in giant cells (5). Nestin is in both neural and glial progenitors and, thus, giant cells likely are derived from the neuroepithelium, since they express nestin protein and mRNA. However, the presence of internexin and MAP2 immunolabeling and mRNA in giant cells as well as other neural mRNAs (NFL, NFM, and GAP43) supports a neuronal phenotype. In contrast, the absence of GFAP immunostaining and GFAP mRNA as well as mRNA encoding CX43, a glial gap junction protein, in individual giant cells was firm evidence that these cells are more closely related to neurons than glia. These results suggest that there may be a heterogeneous population of giant cells, which is in accord with the hypothesis that giant cells are immature in that they express proteins characteristic of undifferentiated neuroepithelial progenitors. Detection of the KV1 potassium channel, Ca-N, CX26, and CX32 mRNAs suggested that giant cells may be capable of synaptic transmission despite low synaptophysin immunoreactivity in previous studies (5). Indeed, the presence of CX26 mRNA in TSC giant cells and neurons but not in normal cortical neurons was further evidence for their immature phenotype, since this mRNA is characteristically identified in neuroepithelial cells (30).
Use of Single-Cell Analysis in Studying Neurologic Disease.
Amplification of mRNA in single live neurons reveals important information regarding relative levels of gene expression (22, 31). The ability to amplify multiple mRNAs from immunohistochemically labeled cells within pathologic material has far-reaching implications in the study of many neurologic diseases. In TSC, analyzing the molecular pathophysiology of tuber formation provides a particular challenge, since no TSC animal model exists and there is limited availability of human brain tissue samples. Thus, this approach provided a powerful tool to study the molecular pathophysiology of tuber formation at the single-cell level in fixed, paraffin-embedded, archival human specimens. Second, it allowed analysis of multiple gene products in cells phenotypically defined by the presence (or absence) of antibody staining or by the expression of specific mRNAs such as the TSC2 transcript. The ability to select individual cells defined by IHC that are affected by a disease process will provide an important approach to studying numerous neurologic diseases. The complexity of the mRNA population detected in single fixed neurons as in single live neurons and individual dendrites (22, 31) suggests that an accurate representation of cellular mRNAs is possible. In these studies, mRNAs that supported immunohistochemical data, addressed the molecular pathophysiology of TSC, and provided a cogent representation of the types of mRNAs that could be evaluated were chosen. In contrast, several mRNAs were not detected in either disease or control groups, suggesting that some mRNAs may not be accessible by this technique. The size distribution of the amplified products seemed to be broad and thus likely yielded large fragments or even full-length sequences of some mRNAs similar to amplification in live neurons (22).
We have amplified mRNA from fixed tissue in other neurologic disorders such as focal cortical dysplasia and Alzheimer disease (unpublished results), suggesting that fixed tissue from a variety of disease states can be used. The pool of aRNA is amenable to manipulations such as PCR or differential display, which facilitates comparison of sequences or cloning of novel genes from single cells. Indeed, with this approach it is possible to clone TSC2 mRNA, when present, from individual cells in tubers and adjacent normal cortex to determine, at the single-cell level, whether a “second-hit” hypothesis is correct.
Acknowledgments
We thank L. Rorke for the generous contribution of TSC brain tissue samples. P.B.C. is a Howard Hughes Medical Institute Physician Postdoctoral Fellow. Partial support of this work came from National Institutes of Health Grant AG9900 (J.E.).
Footnotes
The publication costs of this article were defrayed in part by page charge payment. This article must therefore be hereby marked “advertisement” in accordance with 18 U.S.C. §1734 solely to indicate this fact.
Abbreviations: TSC, tuberous sclerosis; PCNA, proliferating cell nuclear antigen; IHC, immunohistochemistry; IST, in situ transcription; GFAP, glial fibrillary acidic protein; MAP2, microtubule-associated protein 2; aRNA, amplified mRNA; NFL, low molecular weight neurofilament; NFM, medium molecular weight neurofilament; Ca-L and Ca-M, L- and M-type calcium channels; CX, connexin; GAP43, growth-associated protein 43; GABAA receptor, type A γ-aminobutyric acid receptor; NOS, nitric oxide synthase; PDGF, platelet-derived growth factor; bFGF, basic fibroblast growth factor; NGFR, nerve growth factor receptor; CaMKII, α subunit of calcium/calmodulin-dependent protein kinase.
References
- 1.Gomez M R. Tuberous Sclerosis. New York: Raven; 1988. [Google Scholar]
- 2.Huttenlocher P R, Wollman R L. Ann NY Acad Sci. 1991;615:40–148. doi: 10.1111/j.1749-6632.1991.tb37756.x. [DOI] [PubMed] [Google Scholar]
- 3.Huttenlocher P R, Heydemann P T. Ann Neurol. 1984;16:595–602. doi: 10.1002/ana.410160511. [DOI] [PubMed] [Google Scholar]
- 4.Caviness V S, Takahashi T. Ann NY Acad Sci. 1991;615:187–195. doi: 10.1111/j.1749-6632.1991.tb37760.x. [DOI] [PubMed] [Google Scholar]
- 5.Hirose Y, Scheithauer B W, Lopes M B S, Gerber B A, Altermatt H J, Hukee M J, VandenBerg S R, Charlesworth J C. Acta Neuropath. 1995;90:387–399. doi: 10.1007/BF00315012. [DOI] [PubMed] [Google Scholar]
- 6.Richardson E P. Ann NY Acad Sci. 1991;615:128–139. doi: 10.1111/j.1749-6632.1991.tb37755.x. [DOI] [PubMed] [Google Scholar]
- 7.Povey S, Burley M, Attwood J, Benham F, Hunt D, et al. Ann Hum Genet. 1994;58:107–127. doi: 10.1111/j.1469-1809.1994.tb01881.x. [DOI] [PubMed] [Google Scholar]
- 8.European Chromosome 16 Tuberous Sclerosis Consortium. Cell. 1991;75:1305–1315. doi: 10.1016/0092-8674(93)90618-z. [DOI] [PubMed] [Google Scholar]
- 9.Green A, Smith M, Yates J. Nat Genet. 1994;6:193–196. doi: 10.1038/ng0294-193. [DOI] [PubMed] [Google Scholar]
- 10.Sidman R L, Rakic P. Brain Res. 1973;62:1–30. doi: 10.1016/0006-8993(73)90617-3. [DOI] [PubMed] [Google Scholar]
- 11.Ross M E. Trends Neurosci. 1996;19:62–68. doi: 10.1016/0166-2236(96)89622-6. [DOI] [PubMed] [Google Scholar]
- 12.Tohyama T, Lee V M-Y, Rorke L B, Marvin M, McKay R G, Trojanowski J Q. Lab Invest. 1992;66:303–313. [PubMed] [Google Scholar]
- 13.Lendahl U, Zimmerman L, McKay R G. Cell. 1990;60:585–595. doi: 10.1016/0092-8674(90)90662-x. [DOI] [PubMed] [Google Scholar]
- 14.Dahlstrand J, Zimmerman L B, McKay R G, Lendahl U. J Cell Sci. 1992;103:589–597. doi: 10.1242/jcs.103.2.589. [DOI] [PubMed] [Google Scholar]
- 15.Mollgard K, Schumacher U. J Neurosci Methods. 1993;46:191–196. doi: 10.1016/0165-0270(93)90066-z. [DOI] [PubMed] [Google Scholar]
- 16.Key G, Becker M, Baron B, Duchrow C, Schluter C, Flad H, Gerdes J. Lab Invest. 1993;68:629–636. [PubMed] [Google Scholar]
- 17.Schluter C, Duchrow M, Wohlenberg C, Becker M, Key G, Flad H, Gerdes J. J Cell Biol. 1993;123:513–522. doi: 10.1083/jcb.123.3.513. [DOI] [PMC free article] [PubMed] [Google Scholar]
- 18.Eberwine J H, Valentino K L, Barchas J D. In Situ Hybridization in Neurobiology. New York: Oxford Univ. Press; 1994. [Google Scholar]
- 19.Topaloglu H, Sarnat H B. Anat Record. 1989;224:88–93. doi: 10.1002/ar.1092240111. [DOI] [PubMed] [Google Scholar]
- 20.Tecott L, Barchas J, Eberwine J. Science. 1988;240:1661–1664. doi: 10.1126/science.2454508. [DOI] [PubMed] [Google Scholar]
- 21.Nair S M, Eberwine J H. In: Neurobiology of Steroids. de Kloet R E, Sutanto W, editors. San Diego: Academic; 1994. pp. 314–329. [Google Scholar]
- 22.Eberwine J H, Yeh H, Miyashiro K, Cao Y, Nair S, Finnell R, Zettel M, Coleman P. Proc Natl Acad Sci USA. 1992;89:3010–3014. doi: 10.1073/pnas.89.7.3010. [DOI] [PMC free article] [PubMed] [Google Scholar]
- 23.Fliegner K H, Kaplan M P, Wood T L, Pintar J E, Liem R. J Comp Neurol. 1994;342:161–173. doi: 10.1002/cne.903420202. [DOI] [PubMed] [Google Scholar]
- 24.Sherr C J. Trends Biochem Sci. 1995;20:187–190. doi: 10.1016/s0968-0004(00)89005-2. [DOI] [PubMed] [Google Scholar]
- 25.Travis G H, Sutcliff J G. Proc Natl Acad Sci USA. 1988;85:1696–1700. doi: 10.1073/pnas.85.5.1696. [DOI] [PMC free article] [PubMed] [Google Scholar]
- 26.Ross M E, Risken M. J Neurosci. 1994;14:6384–6391. doi: 10.1523/JNEUROSCI.14-11-06384.1994. [DOI] [PMC free article] [PubMed] [Google Scholar]
- 27.Wolf H K. J Neuropath Exp Neurol. 1995;54:245–254. doi: 10.1097/00005072-199503000-00011. [DOI] [PubMed] [Google Scholar]
- 28.Stefansson K, Wollman R. Acta Neuropath. 1981;53:113–117. doi: 10.1007/BF00689991. [DOI] [PubMed] [Google Scholar]
- 29.Trombley I K, Mira S S. Ann Neurol. 1981;9:174–181. doi: 10.1002/ana.410090211. [DOI] [PubMed] [Google Scholar]
- 30.Bennet M V L. Neuron. 1991;6:305–320. doi: 10.1016/0896-6273(91)90241-q. [DOI] [PubMed] [Google Scholar]
- 31.Miyashiro K, Dichter M, Eberwine J. Proc Natl Acad Sci USA. 1994;91:10800–10804. doi: 10.1073/pnas.91.23.10800. [DOI] [PMC free article] [PubMed] [Google Scholar]