

Abstract
Family-based association studies offer robustness to population stratification and can provide insight into maternally mediated and parent-of-origin effects. Usually, such studies investigate multiple markers covering a gene or chromosomal region of interest. We propose a simple and general method to test the association of a disease trait with multiple, possibly linked SNP markers and, subsequently, to nominate a set of “risk-haplotype-tagging alleles.” Our test, the max_Z2 test, uses only the genotypes of affected individuals and their parents without requiring the user to either know or assign haplotypes and their phases. It also accommodates sporadically missing SNP data. In the spirit of the pedigree disequilibrium test, our procedure requires only a vector of differences with expected value 0 under the null hypothesis. To enhance power against a range of alternatives when genotype data are complete, we also consider a method for combining multiple tests; here, we combine max_Z2 and Hotelling’s T2. To facilitate discovery of risk-related haplotypes, we develop a simple procedure for nominating risk-haplotype-tagging alleles. Our procedures can also be used to study maternally mediated genetic effects and to explore imprinting. We compare the statistical power of several competing testing procedures through simulation studies of case-parents triads, whose diplotypes are simulated on the basis of draws from the HapMap-based known haplotypes of four genes. In our simulations, the max_Z2 test and the max_TDT (transmission/disequilibrium test) proposed by McIntyre et al. perform almost identically, but max_Z2, unlike max_TDT, extends directly to the investigation of maternal effects. As an illustration, we reanalyze data from a previously reported orofacial cleft study, to now investigate both fetal and maternal effects of the IRF6 gene.
The availability of detailed human haplotype data and a growing list of SNPs, together with the declining costs of genotyping, provide affordable and powerful tools for identifying genes involved in susceptibility to complex diseases. Improved statistical methods are needed to take full advantage of ambitious projects like the Genetic Association Information Network (GAIN). Existing methods for testing association between complex traits and a series of possibly linked markers involve either sequential testing of single markers or simultaneous testing of multiple markers with or without phase information. Under different assumptions about linkage disequilibrium (LD) between the markers and disease-susceptibility alleles, researchers have found haplotype-based1,2 or SNP-based3 analysis to be advantageous. Haplotype-based analyses are potentially superior because they use information from individual markers as well as the LD structure between the markers. However, some haplotype-based methods require estimation of haplotype phase, which becomes increasingly difficult and susceptible to errors as the number of markers increases. Moreover, studying many markers can exacerbate problems from missing SNP data.
Whereas much work in this area has focused on case-control association studies,4 family-based studies present different challenges but offer some substantial benefits. Especially for complex conditions with onset early in life, such as birth defects or pregnancy complications, genotyping affected individuals and their parents can be extremely useful for identifying genes with a causal role. Analytic methods for single SNPs—such as the transmission/disequilibrium test (TDT),5 likelihood-ratio tests based on log-linear models,6 and family-based association tests (FBATs)7—all work by detecting apparent distortions in transmission from parents to affected offspring. These methods are statistically powerful and robust against bias from genetic population structure.5–7 Case-parent triads also can provide insight into maternally mediated effects8 and parent-of-origin effects,9 mechanisms not readily probed by case-control studies. Unfortunately, largely because of phase ambiguity, extensions of family-based methods to handle haplotypes are not straightforward and may rely on untestable assumptions.10
Several methods that avoid the estimation of phase are available for testing sets of SNPs with the use of case-parents data. McIntyre et al.11 proposed a max_TDT test, in which one calculates the usual TDT statistic5 for each locus and takes the maximum as the test statistic. Statistical significance is assessed via a permutation distribution obtained by repeatedly permuting the labels “transmitted” and “not transmitted” for each affected offspring and by computing max_TDT for each permutation. Since max_TDT is calculated on the basis of the TDT at individual loci, missing individual SNP genotypes do not pose a problem. Lee12 proposed the adaptive principal component test (APRICOT), which exploits the correlation structure produced by LD. The test is based on difference vectors calculated by comparing the genotypes of affected offspring with their corresponding “complements,” the hypothetical siblings who carry the parental sequences of DNA that were not transmitted to the affected offspring. (Under the null hypothesis of no linkage with a disease locus or no association, the difference vector has an expected value of 0.) Lee used an adaptive procedure to calculate the test statistic on the basis of the largest few principal components of the variance-covariance matrix of the difference vectors.12 A third method, a paired Hotelling’s T2 test proposed by Fan et al.,13 is based on the same difference vector and also exploits the correlation structure. Statistical significance can be assessed by relying on either the asymptotic or the permutation distribution of the test statistic. APRICOT and the paired Hotelling’s T2 test may achieve increased power by accounting for the correlation structure between the SNPs, but both procedures require a complete difference vector in each family.
Our objective was to develop multimarker procedures for testing association and for nominating a set of risk-enhancing alleles with the use of possibly linked SNPs from a case-parents design. We wanted a method with certain desirable features; it should (1) use genotypes directly without requiring prespecification or estimation of either haplotypes or phase, (2) assume only independence across triads and Mendelian transmission, (3) accommodate Hardy-Weinberg disequilibrium and population structure, (4) use all potentially informative SNPs, (5) tolerate nonnegligible recombination rates, and (6) be readily generalizable to assessment of maternal genetic effects under the assumption of mating symmetry in the population. The max_TDT satisfies all these criteria except the last; APRICOT and Hotelling’s T2 evaluated by permutations satisfy all criteria except the fourth. Our proposed test, the max_Z2 test, satisfies all these criteria. After rejection of the null hypothesis—that the set of markers is not associated with disease status within families—our subsequent procedure nominates a set of “risk-haplotype-tagging alleles” to aid discovery of a risk-related haplotype. The risk-haplotype-tagging alleles represent a particular subset of the studied alleles that are associated with increased risk when they occur together. For convenience, we refer to such a co-occurring set of alleles as a “haplotype,” recognizing that our usage is somewhat imprecise and that the set of alleles nominated by our procedure may not represent a single haplotype. In fact, the markers that are selected for study might span more than one chromosome, representing, for example, a set of genes in a metabolic pathway.
We assessed the performance of the proposed tests through simulations of studies of four genes from the HapMap project. We compared our proposed tests with several related procedures: the max_TDT procedure,11 the paired Hotelling’s T2 test,13 and the APRICOT test.12
Our methods for studying effects of genes carried by the offspring lead naturally to an approach for studying maternally mediated genetic effects. The maternal genome can be important for risk in the offspring, particularly for conditions with onset early in life, such as birth defects, osteosarcoma, or autism. Such a mechanism14 would be mediated through the maternal phenotype, as expressed during gestation, and could exert both short- and long-term influences on the child’s health. A maternal mechanism would not distort transmissions from parents to affected offspring and would consequently not be detected by methods such as the TDT or by comparisons of affected individuals and their complements. Nevertheless, for a single autosomal diallelic locus, one can detect maternal genetic effects under an assumption of mating symmetry—in effect, by using the father’s genotype as a matched control for the mother’s.8 One can apply our methods to a difference vector between the mother and the father, to test for maternally mediated genetic effects and to nominate a maternal risk haplotype. We also propose a method to assess possible imprinting effects, a phenomenon in which a particular haplotype causes increased risk, but preferentially through either the paternally or maternally inherited copy.
Methods
Testing Effects of Offspring Genotype
The difference vector D
The difference vector is the fundamental data structure that underlies our tests. Its construction is based on triad families, which consist of an affected child and the two parents. Through the difference vector, our method assesses transmission distortion, reflecting the intuition that any set of alleles jointly related to risk will have been transmitted to the affected offspring more often than to the complement. Consider k diallelic markers, and let Mi, Fi, and Ci represent the number of copies of a designated allele carried by the mother, father, and affected offspring, respectively, at marker locus i (it does not matter which allele is enumerated). Let M, F, and C denote the corresponding k-component column vectors. One can construct genotypes of a matching complementary sibling, the complement, who carries all the alleles not transmitted to the affected child. The complement inherits Mi+Fi-Ci (for i=1…k). The paired differences in genotypes between the affected offspring and the complement produce a column vector of differences, D, having the ith component equal to Di=2Ci-(Mi+Fi)(i=1…k) and Di∈{-2,−1,0,1,2}. Under the null hypothesis that the set of markers is not associated with disease status within families, the genotype distribution of cases and their complements are the same, and, consequently, D has expected value 0. When the recruitment of triads is not feasible, such as when the disease has a late onset, a difference vector can be constructed using other relatives (e.g., siblings, as we discuss below).
Max_Z2 test
We propose a max_Z2 test employing D. At each locus i, one computes a statistic Zi, using only those families informative at that locus—that is, families in which all three individuals have that SNP genotype available and the difference Di for that family is not 0. For each locus i, define
 |
where  is the average Di among informative families and SEI_i is the corresponding SE for DI_i. SEI_i is calculated as
 |
where DI_ij is the difference at locus i for informative family j, and nI_i is the number of informative families at locus i. Here, we use the subscript I to indicate that the values are based on Informative families. Our test statistic, max_ Z2, is the maximum of the Z2i across all k loci. We assessed statistical significance, using the permutation distribution of max_Z2 over random reassignments of the labels “case” and “complement.” We generated the permutation distribution under the null by multiplying D for each family by either +1 or −1 with equal probability and recalculating the statistic max_ Z2. The P value is then the proportion of permutation-based test statistics that are larger than or equal to the data-based test statistic. This permutation-based P value naturally accounts for the statistical dependencies (LD structure) among possibly linked SNPs. Since max_ Z2 is calculated on the basis of the Z2i at individual loci, this method handles missing individual SNPs in a natural way.
Modified paired Hotelling’s T2 test
To exploit the correlation structure produced by LD, one can use a classic multivariate test. One example is the paired Hotelling’s T2 statistic proposed by Fan et al.,13 which closely resembles the “multilocus TDT” test proposed by Chapman et al.15 The test statistic is calculated as  , where n is the number of families,
  is the average of the difference vectors across all families, and
  is the sample variance-covariance matrix of the difference vectors. Statistical significance can be assessed using either the permutation distribution of T2 or the asymptotic χ2 distribution of T2. Unlike the max_ Z2 test, the Hotelling’s T2 test requires complete genotype data for all markers. To facilitate simulations, our version of Hotelling’s T2 used a modified estimator of the variance-covariance matrix (appendix A).
Combined test
We expect max_Z2 to perform well when one has genotyped a causative SNP. By contrast, we expect Hotelling’s T2 test, being fully multivariate, to do relatively well when one has not genotyped any causative SNP or, alternatively, the increased disease susceptibility is due to a particular risk haplotype. In the latter two cases, the detection of association relies on LD within the chromosomal region. We accordingly devised a method to combine these tests to take advantage of their complementary strengths and to improve performance under a broad range of possibilities (details in appendix B).
Nominating Risk-Haplotype-Tagging Alleles
Unless a causative SNP is among the typed markers, one must rely on the LD between the typed markers and a causative genetic variant to identify disease association. Marker SNPs carry different amounts of information about the disease-related variant or haplotype. We would like a method whereby the data nominates alleles at a subset of marker SNPs, alleles that together are highly predictive of disease susceptibility. Such SNPs will be referred to as “risk-haplotype-tagging SNPs” and their corresponding alleles as “risk-haplotype-tagging alleles.”
The sign of each Zi points to the overtransmitted allele at locus i on the risk haplotype: a positive Zi based on D=2C-M-F indicates that the designated or “counted” allele at locus i is related to risk, whereas a negative Zi indicates the opposite or “uncounted” allele. The magnitude of Zi—or, rather, its P value—assesses the locus-specific strength of evidence. When the P value for an individual locus is smaller than a preset threshold, we consider the locus to be related to risk and designate the overtransmitted allele as a risk-haplotype-tagging allele. In choosing a threshold, researchers need to balance the loss of informative SNPs if the threshold is too stringent against the dilution of the real signal with noise if the threshold is too liberal.
Maternal Effects
The max_Z2 and Hotelling’s T2 methods can be adapted to testing for maternally mediated genetic effects, by use of paired mother-father comparisons, under an assumption of mating symmetry in the population, as defined by Schaid.16 To test for maternal effects, one uses the same procedures but with a redefined difference vector—namely, the SNP-count differences between the mother and the father, D=M-F. Similarly, one can use Zi based on M-F to nominate risk-haplotype-tagging alleles for effects mediated through the mother.
Under an extended symmetry assumption, the power for detecting maternal genetic effects by use of D=M-F under a given risk scenario is the same as that for testing offspring genetic effects by use of D=2C-M-F under the corresponding offspring risk scenario. The extended symmetry assumption needed is that of parental haplotype exchangeability (PHE)—that all possible assignments to the two parents of the four haplotypes they carry occur with equal likelihood in the population at large. Under this assumption, the power for detecting maternally mediated effects is the same as that for detecting offspring-mediated effects (appendix C). Consequently, our simulations apply equally well to maternal effects.
The assumption of PHE obviates additional simulations for tests of maternal effects, but it is not required for the validity of any of the tests. For maternal-effects testing based on M-F to be valid, one need only assume mating symmetry at the gene under study, which ensures that, under a null hypothesis of no maternal effects, the expected difference vector will be 0. For offspring-effects testing based on 2C-M-F to be valid, one need only assume that Mendelian proportions hold for offspring at the ages under study in the source population, which ensures that, under the null corresponding to offspring effects, the expected difference vector will be 0.
This assumption plausibly holds even in admixed populations. For example, if a population consists of multiple subpopulations and mating is random within each, then PHE holds within each and, hence (following simple algebra), holds overall, even if haplotype prevalences vary across subpopulations.
Imprinting
Suppose that an analysis based on M-F detected asymmetry, supporting a possible maternal genetic effect. When an offspring effect is present, however, this finding is also consistent with a different interpretation. The effect of a variant haplotype on risk may depend on the parent of origin for that haplotype, through an epigenetic mechanism like imprinting. For example, suppose a particular haplotype causes increased risk only through the paternal copy (the maternal copy having been epigenetically silenced). That mechanism could also produce a nonzero mean for M-F. Thus, the interpretation of a finding of parental asymmetry can be challenging, in that maternal effects can be hard to distinguish from parent-of-origin effects. This difficulty is accentuated if the haplotype identified through M-F resembles the one identified through 2C-M-F. Such a finding could mean either that a single haplotype contributes both offspring and maternal effects or that the maternally derived copy in the offspring is the copy that matters most for risk. On the other hand, if the haplotype identified through M-F carries the opposite allele at nearly every risk-haplotype-tagging SNP from the one identified through 2C-M-F, then the paternally derived copy is implicated as the one that matters for risk.
To investigate possible parent-of-origin effects, we recommend the following strategy. First, restrict attention to risk-haplotype-tagging SNPs nominated by the offspring analysis and adjust the coding so that the risk-haplotype-tagging alleles are the ones enumerated. The idea is to stratify the triads according to whether the offspring might carry or definitely does not carry a copy of this “tagged” haplotype and to see whether the parental asymmetry appears regardless of whether the offspring inherited a copy. Consider the subset of triads where the child’s genotype is compatible with carrying a copy of the identified risk haplotype (i.e., where Ci>0 for every risk-haplotype-tagging SNP). Among these possible-carrier triads, compute the mean of Mi-Fi at each risk-haplotype-tagging SNP among informative families (nonzero difference). Divide these mean differences by their corresponding SEs on the basis of informative families to create a vector Z. Let Hm (where m indicates that the copy “may be” present in offspring) be the sum of the signed elements of Z and compare Hm to the permutation distribution based on repeated randomizations of the sign of each family’s M-F and recomputations of Z. Then, perform the same procedure to compute a separate statistic Hn (where n indicates that the copy is “not” present in offspring) based on the noncarrier triads initially left aside, those in which the offspring does not carry the risk haplotype (Ci=0 for at least one risk-haplotype-tagging SNP). If Hm is significant whereas Hn is not, then the data support a parent-of-origin interpretation. If, instead, both are significant, then the data support a maternal-effects interpretation.
Simulations
We obtained haplotypes and their frequencies for the 100-kb or 200-kb genomic regions around four genes—N-acetyl transferase 2 (NAT2 [MIM 243400]); replication factor C, 140-KD subunit (RFC1 [MIM 102579]); DNA polymerase iota (POLI [MIM 605252]); and caspase 9 (CASP9 [MIM 602234])—on the basis of HapMap phased genotype data from a sample with European ancestry (tables 1 and 2). We selected these four genes to represent genomic regions with a range of LD block structures and numerous haplotypes, some of which are rare. Consequently, we believe that they pose a sufficient challenge to any method for analysis of association. We used only haplotypes with an estimated frequency >2%. The presence of redundant SNPs (as occurs with all four genes) will not affect the behavior of any of the compared tests, but redundancies do increase the computing burden. Therefore, we removed the pairwise redundant SNPs. The haplotypes with their frequencies formed a convenient and realistic population from which we sampled to perform simulations.
Table 1. .
Characteristics of the Genes Used in the Simulations
| No. of |
||||
| Gene | Chromosome | Total SNPsa | Nonredundant SNPsb | Haplotypes |
| NAT2 | 8p23.1-21.3 | 32 | 22 | 21 |
| RFC1 | 4p14-p13 | 44 | 12 | 17 |
| POLI | 18q21.1 | 83 | 13 | 12 |
| CASP9 | 1p36.3-36.1 | 29 | 8 | 10 |
The SNPs are located in a 200-kb region around RFC1 and in a 100-kb region around the other genes.
For sets of SNPs with pairwise D′=1, only one SNP is retained.
Table 2. .
Haplotype Frequencies of the Genes Used for Simulations
| Haplotype |
|||||||||||||||||||||
| Gene | 1 | 2 | 3 | 4 | 5 | 6 | 7 | 8 | 9 | 10 | 11 | 12 | 13 | 14 | 15 | 16 | 17 | 18 | 19 | 20 | 21 |
| NAT2 | .23 | .10 | .09 | .07 | .05 | .04 | .04 | .03 | .03 | .03 | .03 | .03 | .03 | .02 | .02 | .02 | .02 | .02 | .02 | .02 | .02 |
| RFC1 | .28 | .11 | .09 | .07 | .05 | .05 | .04 | .04 | .04 | .03 | .03 | .03 | .03 | .03 | .03 | .03 | .03 | … | … | … | … |
| POLI | .28 | .24 | .10 | .07 | .06 | .05 | .05 | .04 | .04 | .04 | .02 | .02 | … | … | … | … | … | … | … | … | … |
| CASP9 | .30 | .15 | .10 | .10 | .09 | .08 | .06 | .05 | .04 | .04 | … | … | … | … | … | … | … | … | … | … | … |
We generated simulated triad diplotypes, using the following method. (1) Designate a particular haplotype as the bearer of a disease mutation and create a disease-susceptibility haplotype by inserting a specific SNP mutation at one additional locus of that designated haplotype. (The remaining haplotypes each get the wild-type allele at that locus.) (2) Modify the haplotype frequencies so that those of the new haplotype and those of the designated haplotype are each half of the latter’s original frequency (i.e., half the copies of the designated haplotype now bear a disease-related mutation). (3) Randomly assign to each parent two haplotypes by sampling with replacement from a multinomial with the specified haplotype frequencies. (4) Create a random child from the parents on the basis of Mendel’s law, assuming no recombination within the gene. (We impose Hardy-Weinberg equilibrium [HWE] and no recombination purely for convenience; no methods that we studied require those assumptions.) (5) Assign a relative risk of disease to the child on the basis of the number of inherited copies of the disease mutation allele and the assumed relative penetrances. (6) Assuming a baseline rate of disease in those with no copies of the allele, calculate risk of disease by multiplying the assumed baseline rate by the assigned relative risk from step 4. One can use any baseline rate, as long as the maximum risk of disease among the three genotype groups does not exceed 1. We used the inverse of the larger relative risk for simulation efficiency (without loss of generality). (7) With probability equal to the assigned risk from step 5, assign case status, discarding a family if the offspring is assigned to be unaffected. (8) Repeat steps 3–7 until the required number of case-parents triads is achieved. We performed this procedure repeatedly, using each of the known haplotypes in turn as the designated haplotype on which the disease mutation occurred. Thus, we were able to observe the behavior of the testing procedures across a set of scenarios that captured a range of mutation SNP frequencies and LD strengths between the disease mutation and its neighboring SNPs. We also simulated scenarios in which the increased disease susceptibility arose from a risk haplotype instead of a single causative SNP. To simulate these scenarios, we did not introduce a mutation SNP in step 1 but instead designated one haplotype as the risk haplotype and followed steps 3–8 as described above.
Let R1, R2 represent the relative risks for disease in individuals carrying 1 and 2 copies, respectively, of the disease allele compared with 0 copies. We performed simulations under an unrestricted (R1=2, R2=3) model and under a dominant (R1=2, R2=2) model, with 400 or 1,000 triads in each simulation and no missing data. We generated 5,000 simulated studies under each scenario and used 1,000 permutations (switching the labels for case vs. complement) for each simulated data set to estimate the P value.
We also used simulations to evaluate our process for nominating risk-haplotype-tagging alleles, assuming that allele nomination would be undertaken only if the overall test first rejected the null hypothesis at .05. We examined several nomination thresholds (from .05 to .3) for use in identifying risk-tagging SNPs and present results obtained with a threshold of .1.
We used the following strategy to evaluate our risk haplotype nomination scheme. Since our simulations used a set of known haplotypes, we were able to record how well we did. For each simulation, we classified the risk-haplotype-tagging alleles into one of four groups, ordered from best to worst: (1) those that uniquely identified the correct risk haplotype; (2) those that were consistent with a set of haplotypes that included the correct haplotype—that is, a set of haplotypes that included the correct one and had the same alleles as the identified risk-haplotype-tagging alleles at the corresponding loci; (3) those that did not agree with any existing haplotype; and (4) those that were consistent with a set of haplotypes that included only nonrisk haplotypes. We calculated the proportion of simulations with global statistical significance (P<.05) that yielded results in each of these four categories.
Results
Simulated Genes
The phased genotype data obtained from the HapMap project include 29–83 SNPs for the four genes, accounting for 10–21 haplotypes. By removing redundant SNPs, we reduced the number of SNPs by at least 30%, leaving 8–22 SNPs in our simulation (table 1). All these genes had one or two haplotypes with frequencies >10%, followed by a few haplotypes with intermediate frequencies, but the majority of the haplotypes had very low frequencies (table 2). Under the scenario that the increased disease susceptibility is due to a causative SNP, we created a susceptibility haplotype for each original haplotype in turn, by introducing the mutation site to only half of the copies of the original haplotype; therefore, the frequency for each such susceptibility haplotype is half that listed in table 2.
Power Comparison
We compared the five methods mentioned above (max_Z2, max_TDT, Hotelling’s T2, APRICOT, and our combined test), using simulations under three scenarios: a causative SNP is among the genotyped markers (SNP_typed) or is not (SNP_not_typed), or the increased disease susceptibility is due to a risk haplotype (Hap). All methods showed type I error rates consistent with the nominal 0.05 level (results not shown). Here we present results under risk scenario R1=2, R2=3 (results for R1=2, R2=2 were qualitatively similar and are not shown). Figure 1 shows the powers of the tests as each of the eight most frequent haplotypes for NAT2 was successively simulated as the one enhancing risk (corresponding results for RFC1, POLI, and CASP9 are shown in fig. 2). For all the methods examined, the power generally declined with decreasing haplotype frequency. The decline was not monotone, however, since the particular risk haplotype structure—the set of SNPs carried on the haplotype—also influenced the power. Power dropped <10% when the risk haplotype was rare (<1%) and the mutation SNP was not typed (results not shown). Increasing the number of triads from 400 to 1,000 boosted the power, most markedly when the power for the 400-triad simulations was reasonably good. Nevertheless, as expected, this increase in sample size improved the power only slightly under a recessive model when the risk haplotype was rare (results not shown). Power curves generated under scenario Hap, in which the increased risk was due to a risk haplotype rather than to a causative SNP, resembled those under SNP_not_typed but with increased power. We also simulated scenarios similar to SNP_typed and SNP_not_typed but with the disease mutation occurring on only 15% of copies of the background haplotype. As expected, power was reduced in these scenarios; otherwise, patterns were similar to those seen when the risk haplotype was more frequent (data not shown).
Figure 1. .

Power curves for NAT2 in the SNP_typed, SNP_not_typed, and Hap scenarios with R1=2, R2=3 with the use of each successive background haplotype as the mutation-bearing or risk haplotype. The eight most frequent risk haplotypes are given in descending order of frequency, with the X-axis scale of log10[1/frequency] labeled as “1/Frequency.” These frequencies are for the mutation-bearing haplotype or risk haplotype. Haplotypes with identical frequencies were shifted slightly for better visualization, as indicated by the arrows. Left column, 400 triads. Right column, 1,000 triads. Top row, SNP_typed. Middle row, SNP_not_typed. Bottom row, Hap. Lines with unblackened triangles indicate max_Z2; lines with unblackened diamonds indicate sum_log(P); lines with “T” indicate max_TDT; lines with blackened squares indicate Hotelling's T2; lines with blackened triangles indicate APRICOT.
Figure 2. .

Power curves for RFC1 (A), POLI (B), and CASP9 (C) in the SNP_typed and SNP_not_typed scenarios with R1=2,R2=3 with the use of each successive background haplotype as the mutation-bearing or risk haplotype. The eight most frequent risk haplotypes are given in descending order of frequency, with the X-axis scale of log10[1/frequency] labeled as “1/Frequency.” These frequencies are for the mutation-bearing haplotype or risk haplotype. Haplotypes with identical frequencies were shifted slightly for better visualization, as indicated by the arrows. a, 400 triads, SNP_typed. b, 1,000 triads, SNP_typed. c, 400 triads, SNP_not_typed. d, 1,000 triads, SNP_not_typed. Lines with unblackened triangles indicate max_Z2; lines with unblackened diamonds indicate sum_log(P); lines with “T” indicate max_TDT; lines with blackened squares indicate Hotelling's T2; lines with blackened triangles indicate APRICOT.
Overall, max_Z2 and max_TDT exhibited very similar power. Both were typically more powerful than Hotelling’s T2 when a causative SNP was measured; the pattern reversed when the causative SNP was not typed or when risk was associated with a haplotype rather than a single SNP. This finding was expected because, being fully multivariate, Hotelling’s T2 makes better use of LD. APRICOT did not perform well under many simulation conditions. This finding is not surprising, given that APRICOT is based on the first few principal components, whereas the disease might instead be related to only the last PC.17 Our combined statistic, sum_log(P), had power that tended to track the better of max_Z2 and Hotelling’s T2 tests.
Haplotype Determination
When a simulation achieved global significance (P<.05), we used the data to nominate a set of risk-haplotype-tagging alleles based on Z statistics from individual SNPs, as described above. We present here results with a criterion of P<.1—that is, if the P value from the Zi for an individual SNP is <.1, that SNP is nominated as a risk-haplotype-tagging SNP. Using the predicted risk-haplotype-tagging alleles, we grouped the simulation data sets that achieved global significance into the four categories described above. Figure 3 shows the results for NAT2, under risk scenario R1=2, R2=3 and under three simulation scenarios with 400 or 1,000 triads in each simulated data set (corresponding results for RFC1, POLI, and CASP9 are shown in fig. 4). With 1,000 triads, >60% of the statistically significant simulated studies uniquely identified the correct haplotype when the mutation SNP was typed. When the mutation SNP was not typed or when the increased disease susceptibility was associated with a haplotype rather than a mutation SNP, unique identification of the correct haplotype declined. The probability of uniquely identifying the correct haplotype depended on the strength of LD between the selected loci and the causative allele or risk haplotype. Nonetheless, even when the causative SNP was not typed or risk was associated with a haplotype, the probability of including the correct risk haplotype among all the haplotypes identified was reasonably high. In scenarios in which the disease mutation appeared on only 15% of the background haplotype, the probability of including the correct risk haplotype among those identified suffered (data not shown).
Figure 3. .

Risk haplotype nomination for NAT2 in the SNP_typed, SNP_not_typed, and Hap scenarios with R1=2, R2=3. Results are based on simulations with global significance at P⩽.05 and cutoff criterion P<.1. Left panel, 400 triads. Right panel, 1,000 triads. Top row, SNP_typed. Middle row, SNP_not_typed. Bottom row, Hap. Each column represents a successive haplotype as the mutation-bearing or risk haplotype, sorted by descending order of frequency along the X-axis. The white line represents the power curve for sum_log(P) and indicates the fraction of 5,000 simulated studies reaching global significance. From bottom to top, the different shades represent the proportion of simulations where the correct haplotype was uniquely identified (dark gray), the risk-haplotype-tagging alleles were consistent with a set of haplotypes that included the correct one (medium gray), the risk-haplotype-tagging alleles did not agree with any existing haplotype (light gray), or the risk-haplotype-tagging alleles agreed with only the nonrisk haplotypes (white).
Figure 4. .

Risk-haplotype nomination for RFC1 (A), POLI (B), and CASP9 (C) in the SNP_typed and SNP_not_typed scenarios with R1=2, R2=3. Results are based on simulations with global significance at P⩽.05 and cutoff criterion P<.1. a, 400 triads, SNP_typed. b, 1,000 triads, SNP_typed. c, 400 triads, SNP_not_typed. d, 1,000 triads, SNP_not_typed. Each column represents a successive haplotype as the mutation-bearing or risk haplotype, sorted by descending order of frequency along the X-axis. The white line represents the power curve for sum_log(P) and indicates the fraction of 5,000 simulated studies reaching global significance. From bottom to top, the different shades represent the proportion of simulations where the correct haplotype was uniquely identified (dark gray), the risk-haplotype-tagging alleles were consistent with a set of haplotypes that included the correct one (medium gray), the risk-haplotype-tagging alleles did not agree with any existing haplotype (light gray), or the risk-haplotype-tagging alleles agreed with only the nonrisk haplotypes (white).
An Example: Orofacial Clefts
We applied these methods to data from an orofacial cleft study.18 The data, from 296 Filipino case-parents triads, include genotypes of 36 SNPs in a 300-kb region around the candidate gene, interferon regulatory factor 6 (IRF6 [MIM 607199]). We assessed statistical significance on the basis of 10,000 permutations. With use of D=2C-M-F, max_Z2, max_TDT, sum_log(P), and Hotelling’s T2 all indicated a statistically significant association with offspring genotype (P=.0034, .0036, .0039, and .028, respectively), supporting the earlier report.18 APRICOT (P=.53) failed to detect an association. (We substituted zeros for missing SNPs in the difference vector when calculating sum_log(P), Hotelling’s T2, and APRICOT.) Using a threshold of .1, we identified 18 risk-haplotype-tagging alleles. These 18 include all 9 alleles given in the original article by Zucchero et al.18 (fig. 5A). An estimated frequency of 0.46 was reported for the nine-SNP risk haplotype.18 Our expanded set of risk-haplotype-tagging alleles may facilitate research to better define an important risk haplotype for clefting.
Figure 5. .

Orofacial cleft examples. Result of testing effects of offspring genotype (A) and maternal genotype (B) for IRF6. The Y-axis shows –log10(p) at individual SNPs; the X-axis shows the physical location of the nominated risk-haplotype-tagging SNPs along with the number of informative families. The vertical lines represent either a rare allele on the risk haplotype at the corresponding SNPs (lines with unblackened circles) or a common allele (lines without unblackened circles). The nine boxed SNPs correspond to the nine identified by Zucchero et al.18 The dotted horizontal lines correspond to the P=.05 and P=.1 cutoffs.
With use of D=M-F, max_Z2 and sum_log(P) suggested a possible maternal effect (P=.071 and .073, respectively), Hotelling’s T2 provided less evidence (P=.12), and APRICOT showed no association (P=.64). The maternal risk haplotype nominated after this test included 14 SNPs, 13 of which were also nominated by D=2C-M-F. Moreover, at each of the 13 SNPs identified in common, the maternal risk-tagging allele was opposite the one nominated by the offspring analysis (fig. 5B). One plausible explanation for such a reversal is imprinting. If the paternally inherited copy alone conferred risk, then the father of an affected child would be more likely than the mother to carry a copy of the haplotype, producing an apparent reversal of haplotype between M-F and 2C-M-F. We applied the approach that we suggested above for examining imprinting, stratifying families according to whether the offspring might carry at least one copy of every risk-haplotype-tagging allele derived from 2C-M-F. We reasoned that, if imprinting were the mechanism, the parents of possible carriers should show a signed M-F difference for those risk-haplotype-tagging SNPs, whereas parents of the definite noncarriers should not. We saw instead statistical significance (two-sided P=.010) for the carriers and borderline statistical significance (P=.062) for the noncarriers, suggesting that imprinting may not explain the finding. When we combined possible carriers and definite noncarriers, a test based on summing components of the standardized signed M-F, which used the haplotype nominated by the offspring as a template, was highly statistically significant in the negative direction (two-sided P=.003).
These analyses thus provided evidence of maternal effects but with the reversal IRF6 haplotype. One possible explanation for this seemingly unlikely result is that the same haplotype, the one originally nominated through 2C-M-F, could be protective (against clefting in the fetus) if carried by the mother and deleterious if carried by her fetus. At first, such a phenomenon seems implausible. Genes in the mother and those in the fetus are, however, potentially doing very different things during fetal development. Also, such a dual effect would allow such a haplotype to be preserved in the population, because a benefit would offset the obvious survival-limiting detriment. In a prehistoric setting, most babies born with clefts of the lip and palate would have been unable to nurse properly and would have died of starvation or abandonment. Any haplotype that increases risk of clefting would consequently require a compensatory mechanism to explain its persistence.
Discussion
Several methods have been proposed for association studies based on multiple possibly linked markers in nuclear families, such as a score statistic,19 a stepwise conditional logistic-regression approach,20,21 a multiple-marker extension to a log-linear model,10 a haplotype extension to the FBAT22 and haplotype-association in the presence of linkage (H-APL)23 methods, and a method based on the projection conditional on parental haplotypes.24 Nonetheless, these methods rely on inferred haplotype phase or missing-data methods, and their power diminishes with increasing numbers of loci (hence increasing numbers of haplotypes).
We compared multimarker methods that require neither determination of haplotype phases nor consideration of LD blocks. Our proposed methods, like max_TDT, are not affected by recombination events or population structures, do not need HWE in the population, and do not sacrifice information by discarding potentially informative SNPs before analysis to achieve dimension reduction. max_Z2 and max_TDT also work when SNP data are incomplete across loci and achieve a natural correction for multiple comparisons by treating multiple SNPs as a set. When genotype data are complete, the combined test, sum_log(P), offers enhanced power against a range of alternatives. An R program implementing the proposed approaches is available from Clarice R. Weinberg's Web site.
We compared methods by use of a simulation study based on actual genomic LD structures and then applied the methods to data from a birth defect study. Power depends on whether the disease-causing SNP is among the genotyped markers, which will be unknown to investigators. However, our simulations showed that, by allowing for both possibilities, the sum_log(P) test performs relatively well whether or not the disease-causing mutation is typed.
Our simulations showed that the power of the tests is largely determined by the frequency of the mutation allele when a causative SNP is genotyped. When it is not genotyped, power depends on both the risk-haplotype frequency and the degree of LD between the disease-susceptibility allele or haplotype and the markers. One would expect good power if the risk-related haplotype happens to be considerably different from the other haplotypes. The same is true for haplotype determination. The probability of identifying the correct haplotype can decrease substantially when the causative SNP is not typed, and unique identification relies on how distinctive the disease-susceptibility haplotype is.
Our proposal for designating risk-haplotype-tagging alleles will help researchers focus future studies on localized genomic regions and an identified subset of candidate risk haplotypes. Although we have described our method as leading to the nomination of a risk-related “haplotype,” it is important to recognize that, although the set of alleles identified in this way appear to act in concert, the nominated alleles may not necessarily mark a single haplotype in the usual sense of the word.
One special advantage of max_Z2, as opposed to max_TDT, is its applicability to the assessment of maternally mediated genetic effects. The mother’s genome determines the intrauterine environment in which the gestating fetus must develop. The study of maternally mediated genetic effects is especially important for diseases with early onset, such as schizophrenia.
Our example analyzed 36 selected SNPs for IRF6, a strong candidate for a gene that affects palate formation, using children affected with oral clefts and their parents. We first confirmed an earlier finding18 of transmission distortion (max_Z2 P=.003). We nominated nine additional alleles to supplement the nine already reported as relevant to risk in the fetus. Because the 36 SNPs come from a fairly large region encompassing the 100 kb upstream and 200 kb downstream of the start site, the set of alleles we nominated could include two or more haplotypes working together.
In addition, the specific haplotype nominated by 2C-M-F showed strong evidence (P=.003) of effects mediated through the maternal genome. With the exception that we used the offspring-nominated haplotype as a template, the latter test is statistically independent of the former and so should be regarded as providing largely independent evidence. This finding will still require replication in a different population, however. Tests performed separately with families in which the offspring did not carry the nominated haplotype and with the remainder of families in which the offspring might be a carrier supported the possibility that a maternal effect is either protective or causative and associated with an opposite haplotype. Although seemingly unlikely, the existence of both protective and deleterious effects of the same haplotype could help to explain its persistence in the population. Mothers who carry it would enjoy a slight reproductive advantage, whereas fathers who carry it would suffer a slight reproductive disadvantage.
Our example raised an issue related to distinguishing causative haplotypes from protective haplotypes (which would be nominated by the set of alleles complementary to the risk-haplotype-tagging alleles). While this duality presents a hypothetical conundrum, a single haplotype that confers protection will typically be very hard to detect on the basis of the proposed (or other) methods (simulations not shown) unless it has prevalence near 0.5. External information can sometimes help resolve doubts—for example, if the identified risk-haplotype-tagging alleles are consistent with at least one haplotype that does exist whereas the complementary alleles are not. Another difficulty that can arise, in principle, is when exactly complementary haplotypes—for example, (2,1,2,2,1,2) and (1,2,1,1,2,1)—are both causal or both protective and are equal to each other in prevalence and in relative risks. In that extreme scenario, the vector difference method would not be able to detect either haplotype, because the mean for the difference vector would remain at its null value of 0. Presumably, nature rarely presents such scenarios.
Parents are not always readily available, especially in the study of diseases of late onset. Individuals, especially fathers, are frequently missing. When that happens, one could use these single-parent families—for example, by using C-M in place of 2C-M-F, if the null hypothesis were that there is no within-family disease association with either the child’s or the mother’s genotype. The expected value of C-M should be 0 under this broad null hypothesis, provided that the state of being unavailable for genotyping is not related to the father’s genotype and, thus, that the tests described above are valid. Alternatively, investigators might recruit unaffected siblings, a spouse, or offspring. The proposed methods are readily extensible to families with a variety of relatives to use as controls. If the null hypothesis of interest remains no within-family disease association with either the child’s or the mother’s genotype, one can use genotypes of other relatives to construct the difference vector in the spirit of the methods proposed by Lee25–27 and Martin et al.28 For families with multiple affected siblings, using an approach similar to the PDT, one can construct an offspring-complement difference vector separately for each affected offspring and use the average of those difference vectors within each family as the difference vector, D, for calculating our statistics. A permutation test that includes these family average difference vectors can be performed exactly as described for the triad scenario.
The methods can also be extended to handle multiallelic markers. One can accommodate such loci by coding the genotype vector in a slightly different way. Each possible allele is assigned to occupy a component of the genotype vector with an entry of 0, 1, or 2, corresponding to its number of copies, so that a k-allele locus has k entries that sum to 2. The length of the genotype vector is now equal to the total number of alleles at all the loci to be included in the analysis. The test statistic max_Z2 is computed just as before. For computation of Hotelling’s T2, the dimensionality can be reduced by eliminating the linear dependencies by including only k−1 components for each locus with k alleles.
Our simulation study has limitations. The simulation scenarios that we used were oversimplified, in that increased risk was due to either a single disease SNP that resides on one background haplotype or a single risk haplotype. This construction may be reasonable for some diseases but not for others. If association arises from higher orders of SNP-interaction effects or from multiple and complementary haplotypes, it can escape detection. On the other hand, our proposed tests remain valid and resistant to bias due to population stratification in more complex situations than our simulations encompass.
Our simulations did not include missing data. In practice, whenever many SNPs are studied, genotypes will be missing at some markers in many individuals. In general, missing data cause relatively little loss of power for max_Z2, but Hotelling’s T2 test may face a drastically reduced number of loci and families, and its power will suffer accordingly. We recommend max_Z2 when many SNP genotypes are missing, as in our example, and sum_log(P) when the genotype data are more complete. Alternatively, one can also replace missing SNPs with zeros in the difference vector and still calculate Hotelling’s T2 and sum_log(P), as we did in our cleft example. The tests remain valid, but power will be impaired in comparison with the use of complete data.
Identifying a risk haplotype related to a complex disease with the use of family data is a challenging problem akin to finding a needle in a haystack. We have proposed a robust, intuitive, simple, and reasonably powerful approach to testing and haplotype nomination. The approach can make use of many SNP markers, linked or not, to test for either fetal or maternal genetic effects and requires neither HWE nor haplotype phase inference, nor prior knowledge of haplotypes, thus arming researchers with a flexible tool for finding those “needles.”
Acknowledgments
This research was supported by the Intramural Research Program of the National Institutes of Health, National Institute of Environmental Health Sciences. We thank Drs. Jeffrey Murray and Theresa Zucchero, for sharing the genotype data from their orofacial cleft study, and Drs. Norman Kaplan, Dmitri Zaykin, and Jeffrey Murray, for helpful comments on the manuscript.
Appendix A: Calculation of Hotelling’s T2 for Simulations
With these multivariate procedures, a practical problem arises because of matrix singularity. In the human genome, redundant SNPs—that is, SNPs with a correlation of 1 with some other SNP—frequently occur. A set of SNPs with perfect or near-perfect correlations or one with some other linear dependency will lead to singular or near-singular  . This difficulty can be accommodated through the use of a generalized inverse of
  , calculated via a singular value decomposition. Writing out the generalized inverse in singular value decomposition form and substituting into the formula for T2, one has
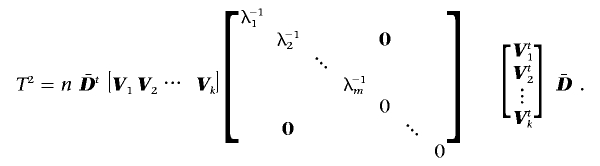 |
Here,  represents the mean difference vector, Vj represents the jth eigenvector of
  normalized to unit length, λj represents the corresponding eigenvalue, and m represents the number of PCs with positive eigenvalues. Thus, Hotelling’s T2 can be calculated as
 |
Inverting a singular  from every permutation would be time consuming. To reduce the computational burden of our simulation study by eliminating repeated matrix inversions, we employed an alternate estimator of the variance-covariance matrix under the null hypothesis, one that remains constant across permutations. We multiply each family’s D by −1 and combine the resulting data with the original difference data. Our test statistic uses
  from the original data but
  and, hence, Vj and λj from the augmented data. The augmentation step means that all the permuted data sets have the same eigenvalues and eigenvectors as the observed augmented data set, so that we need to perform principal components analysis only once for both the observed and permuted data.
  based on the augmented data is a consistent estimator under the null hypothesis because D and −D have exactly the same likelihood. Under alternatives,
  based on the augmented data is not a consistent estimator. Nevertheless, because our method relies on permutations to assess significance, the empirical P value is still valid. We performed simulation studies that confirmed the validity of our modified test and indicated that power is essentially unaffected.
Appendix B: Construction of a Combined Test
Using an algorithm similar to that of Becker et al.,29 we combined the P values with use of the following method (fig. B1): (1) Record the values of the max_Z2 and Hotelling’s T2 statistics for the observed as well as each permuted data set in two vectors. (2) Generate a separate vector of P values for each statistic by assigning P values to the observed value and to each of the permutation-based values, by comparing each value in turn with the permutation distribution represented by all the remaining values. At this stage, for each data set, observed or permuted, one has generated a pair of correlated P values corresponding to the max_Z2 and Hotelling’s T2 statistics. (3) Create a sum_log(P) vector by summing the logarithms of each pair of P values. (4) Use the sum_log(P) vector to calculate a single combined P value for the observed value of sum_log(P) based on the permutation distribution represented by the remaining elements of the sum_log(P) vector. This procedure can be extended to combine a larger number of test statistics or by using different ways to combine P values. We also considered using the minimum of the two P values; however, results were virtually identical to those from sum_log(P).
Figure B1. .

A flow chart of the combined test approach. Schematic of the sum_log(P) procedure for combining max_Z2 and Hotelling’sT2 tests. We use the subscript “obs” to represent observed data (or scores calculated on the basis of the observed data) and the subscripts “p1”…“p1,000” to represent permutation data (or scores calculated on the basis of the permutation data), assuming 1,000 permutations.
Appendix C: Equivalent Power for Testing Offspring Effects and Maternal Effects
Suppose the assumption of PHE holds in the population under study. For example, all six possible assignments of any four distinct haplotypes to parents are equally likely (see table C1). This assumption is somewhat stronger than mating symmetry16 but is much weaker than HWE, because it can be satisfied, for example, even under genetic population structure. One can see from table 1 that every frequency for pairs of parental diplotypes is duplicated for the corresponding pairs of offspring-complement diplotypes. For example, the mother-father diplotype pair (a,b)(c,d) has probability 1/6; correspondingly, the case-complement diplotype pair (a,b)(c,d) also has probability 1/6, since it arises with probability 1/4 from four distinct mother-father diplotype pairs, each having probability 1/6. That is, under PHE, the paired diplotype distribution in the population for individuals and their complements is the same as that for parents.
Our tests for offspring effects are based on distortion of the diplotype distribution of offspring-complement pairs by two relative penetrance parameters for the offspring genotype. Similarly, our tests for maternal effects are based on distortion of the diplotype distribution of mother-father pairs by two relative penetrance parameters for the maternal genotype. Since the null distributions of diplotypes from mother-father pairs and from offspring-complement pairs are identical, the behavior of mother-father diplotype pairs under maternal relative risks (with no offspring effects present) must be exactly the same as that of offspring-complement diplotype pairs under equivalent offspring relative risks (with no maternal effects present). Thus, if there is PHE in the source population, then the power for detecting maternal effects (with no offspring effects present) is the same as the corresponding power for detecting offspring effects (with no maternal effects present).
Table C1. .
Diplotype Mating Types Characterized by the Set of Haplotypes Carried, the Possible Equally Frequent Pairs of Parents, and the Corresponding Equally Frequent Pairs of Offspring-Complements Those Parents Could Have
| Diplotype Mating Type | Parental Diplotype (Mother and Father) | Probability of Parental Diplotype |
Possible Pairs of Child- Complement Diplotypes |
Probability of Child-Complement Diplotypesa |
| (a,b,c,d) | (a,b) (c,d) | 1/6 | (a,c) (b,d) | 1/4 |
| (c,d) (a,b) | 1/6 | (b,d) (a,d) | 1/4 | |
| (a,d) (b,c) | 1/4 | |||
| (b,c) (a,d) | 1/4 | |||
| (a,c) (b,d) | 1/6 | (a,b) (c,d) | 1/4 | |
| (b,d) (a,c) | 1/6 | (c,d) (a,b) | 1/4 | |
| (a,d) (b,c) | 1/4 | |||
| (b,c) (a,d) | 1/4 | |||
| (a,d) (b,c) | 1/6 | (a,b) (c,d) | 1/4 | |
| (b,c) (a,d) | 1/6 | (c,d) (a,b) | 1/4 | |
| (a,c) (b,d) | 1/4 | |||
| (b,d) (a,c) | 1/4 | |||
| (a,b,c,c) | (a,b) (c,c) | 1/6 | (a,c) (b,c) | 1/2 |
| (c,c) (a,b) | 1/6 | (b,c) (a,c) | 1/2 | |
| (a,c) (b,c) | 1/3 | (a,b) (c,c) | 1/4 | |
| (b,c) (a,c) | 1/3 | (c,c) (a,b) | 1/4 | |
| (a,c) (b,c) | 1/4 | |||
| (b,c) (a,c) | 1/4 | |||
| (a,a,b,b) | (a,a) (b,b) | 1/6 | (a,b) (a,b) | 1 |
| (b,b) (a,a) | 1/6 | |||
| (a,b) (a,b) | 2/3 | (a,a) (b,b) | 1/4 | |
| (b,b) (a,a) | 1/4 | |||
| (a,b) (a,b) | 1/2 | |||
| (a,b,b,b) | (a,b) (b,b) | 1/2 | (a,b) (b,b) | 1/2 |
| (b,b) (a,b) | 1/2 | (b,b) (a,b) | 1/2 | |
| (a,a,a,a) | (a,a) (a,a) | 1 | (a,a) (a,a) | 1 |
Given unordered parental diplotypes.
Appendix D: Number of Risk-Haplotype-Tagging SNPs
Figure D1. .

The average number of risk-haplotype-tagging SNPs for NAT2 simulations that reached global significance in the SNP_typed, SNP_not_typed, and Hap scenarios. The relative risks are R1=2, R2=3, and each successive background haplotype is used as the mutation-bearing or risk haplotype. Haplotypes with identical frequencies were shifted slightly for better visualization. Left column, 400 triads. Right column, 1,000 triads. Top row, SNP_typed. Middle row, SNP_not_typed. Bottom row, Hap. Lines with asterisks indicate simulations that uniquely identified the correct haplotype. Lines with unblackened squares indicate simulations that identified the correct haplotype either uniquely or with some other haplotypes.
Web Resources
Accession numbers and URLs for data presented herein are as follows:
- Clarice R. Weinberg's Web site, http://dir.niehs.nih.gov/dirbb/weinberg/weinberg.htm (for software for the triad multimarker [TRIMM] test)
- GAIN, http://www.fnih.org/GAIN/GAIN_home.shtml
- HapMap, http://www.hapmap.org
- Online Mendelian Inheritance in Man (OMIM), http://www.ncbi.nlm.nih.gov/Omim/ (for NAT2, RFC1, POLI, CASP9, and IRF6)
References
- 1.Zaykin DV, Westfall PH, Young SS, Karnoub MA, Wagner MJ, Ehm MG (2002) Testing association of statistically inferred haplotypes with discrete and continuous traits in samples of unrelated individuals. Hum Hered 53:79–91 10.1159/000057986 [DOI] [PubMed] [Google Scholar]
- 2.Morris RW, Kaplan NL (2002) On the advantage of haplotype analysis in the presence of multiple disease susceptibility alleles. Genet Epidemiol 23:221–233 10.1002/gepi.10200 [DOI] [PubMed] [Google Scholar]
- 3.Roeder K, Bacanu SA, Sonpar V, Zhang X, Devlin B (2005) Analysis of single-locus tests to detect gene/disease associations. Genet Epidemiol 28:207–219 10.1002/gepi.20050 [DOI] [PubMed] [Google Scholar]
- 4.Schaid DJ (2004) Evaluating associations of haplotypes with traits. Genet Epidemiol 27:348–364 10.1002/gepi.20037 [DOI] [PubMed] [Google Scholar]
- 5.Spielman RS, McGinnis RE, Ewens WJ (1993) Transmission test for linkage disequilibrium: the insulin gene region and insulin-dependent diabetes mellitus (IDDM). Am J Hum Genet 52:506–516 [PMC free article] [PubMed] [Google Scholar]
- 6.Weinberg CR, Wilcox AJ, Lie RT (1998) A log-linear approach to case-parent-triad data: assessing effects of disease genes that act either directly or through maternal effects and that may be subject to parental imprinting. Am J Hum Genet 62:969–978 [DOI] [PMC free article] [PubMed] [Google Scholar]
- 7.Laird NM, Horvath S, Xu X (2000) Implementing a unified approach to family-based tests of association. Genet Epidemiol 19:S36–S42 [DOI] [PubMed] [Google Scholar]
- 8.Wilcox AJ, Weinberg CR, Lie RT (1998) Distinguishing the effects of maternal and offspring genes through studies of “case-parent triads.” Am J Epidemiol 148:893–901 [DOI] [PubMed] [Google Scholar]
- 9.Weinberg CR (1999) Methods for detection of parent-of-origin effects in genetic studies of case-parents triads. Am J Hum Genet 65:229–235 [DOI] [PMC free article] [PubMed] [Google Scholar]
- 10.Gjessing HK, Lie RT (2006) Case-parent triads: estimating single- and double-dose effects of fetal and maternal disease gene haplotypes. Ann Hum Genet 70:382–396 10.1111/j.1529-8817.2005.00218.x [DOI] [PubMed] [Google Scholar]
- 11.McIntyre LM, Martin ER, Simonsen KL, Kaplan NL (2000) Circumventing multiple testing: a multilocus Monte Carlo approach to testing for association. Genet Epidemiol 19:18–29 [DOI] [PubMed] [Google Scholar]
- 12.Lee WC (2002) Testing for candidate gene linkage disequilibrium using a dense array of single nucleotide polymorphisms in case-parents studies. Epidemiology 13:545–551 10.1097/00001648-200209000-00010 [DOI] [PubMed] [Google Scholar]
- 13.Fan R, Knapp M, Wjst M, Zhao C, Xiong M (2005) High resolution T2 association tests of complex diseases based on family data. Ann Hum Genet 69:187–208 [DOI] [PubMed] [Google Scholar]
- 14.Mitchell LE (1997) Differentiating between fetal and maternal genotypic effects, using the transmission test for linkage disequilibrium. Am J Hum Genet 60:1006–1007 [PMC free article] [PubMed] [Google Scholar]
- 15.Chapman JM, Cooper JD, Todd JA, Clayton DG (2003) Detecting disease associations due to linkage disequilibrium using haplotype tags: a class of tests and the determinants of statistical power. Hum Hered 56:18–31 10.1159/000073729 [DOI] [PubMed] [Google Scholar]
- 16.Schaid DJ, Sommer SS (1993) Genotype relative risks: methods for design and analysis of candidate-gene association studies. Am J Hum Genet 53:1114–1126 [PMC free article] [PubMed] [Google Scholar]
- 17.Hadi AS, Ling RF (1998) Some cautionary notes on the use of principal components regression. Am Stat 52:15–19 10.2307/2685559 [DOI] [Google Scholar]
- 18.Zucchero TM, Cooper ME, Maher BS, Daack-Hirsch S, Nepomuceno B, Ribeiro L, Caprau D, Christensen K, Suzuki Y, Machida J, et al (2004) Interferon regulatory factor 6 (IRF6) gene variants and the risk of isolated cleft lip or palate. N Engl J Med 351:769–780 10.1056/NEJMoa032909 [DOI] [PubMed] [Google Scholar]
- 19.Schaid DJ, Rowland CM, Tines DE, Jacobson RM, Poland GA (2002) Score tests for association between traits and haplotypes when linkage phase is ambiguous. Am J Hum Genet 70:425–434 [DOI] [PMC free article] [PubMed] [Google Scholar]
- 20.Cordell HJ, Barratt BJ, Clayton DG (2004) Case/pseudocontrol analysis in genetic association studies: a unified framework for detection of genotype and haplotype associations, gene-gene and gene-environment interactions, and parent-of-origin effects. Genet Epidemiol 26:167–185 10.1002/gepi.10307 [DOI] [PubMed] [Google Scholar]
- 21.Cordell HJ, Clayton DG (2002) A unified stepwise regression procedure for evaluating the relative effects of polymorphisms within a gene using case/control or family data: application to HLA in type 1 diabetes. Am J Hum Genet 70:124–141 [DOI] [PMC free article] [PubMed] [Google Scholar]
- 22.Horvath S, Xu X, Lake SL, Silverman EK, Weiss ST, Laird NM (2004) Family-based tests for associating haplotypes with general phenotype data: application to asthma genetics. Genet Epidemiol 26:61–69 10.1002/gepi.10295 [DOI] [PubMed] [Google Scholar]
- 23.Chung RH, Hauser ER, Martin ER (2006) The APL test: extension to general nuclear families and haplotypes and examination of its robustness. Hum Hered 61:189–199 10.1159/000094774 [DOI] [PubMed] [Google Scholar]
- 24.Allen AS, Satten GA (2007) Inference on haplotype/disease association using parent-affected-child data: the projection conditional on parental haplotypes method. Genet Epidemiol 31:211–223 10.1002/gepi.20203 [DOI] [PubMed] [Google Scholar]
- 25.Lee WC (2003) Genetic association studies of adult-onset diseases using the case-spouse and case-offspring designs. Am J Epidemiol 158:1023–1032 10.1093/aje/kwg266 [DOI] [PubMed] [Google Scholar]
- 26.Lee WC (2003) Lee responds to “Making the most of genotype asymmetries.” Am J Epidemiol 158:1036–1038 [Google Scholar]
- 27.Weinberg C (2003) Invited commentary: making the most of genotype asymmetries. Am J Epidemiol 158:1033–1035; discussion 1035–1038 10.1093/aje/kwg267 [DOI] [PubMed] [Google Scholar]
- 28.Martin ER, Monks SA, Warren LL, Kaplan NL (2000) A test for linkage and association in general pedigrees: the pedigree disequilibrium test. Am J Hum Genet 67:146–154 [DOI] [PMC free article] [PubMed] [Google Scholar]
- 29.Becker T, Knapp M (2004) A powerful strategy to account for multiple testing in the context of haplotype analysis. Am J Hum Genet 75:561–570 [DOI] [PMC free article] [PubMed] [Google Scholar]