

Abstract
The green fluorescent protein (GFP) is among the most commonly used expression markers in biology. GFP-tagged cells have played a particularly important role in studies of cell lineage. Sensitive detection of GFP is crucially important for such studies to be successful, and problems with detection may account for discrepancies in the literature regarding the possible fate choices of stem cells. Here we describe a very sensitive technique for visualization of GFP. Using it we can detect about 90% of cells of donor origin while we could only see about 50% of these cells when we employ the methods that are in general use in other laboratories. In addition, we provide evidence that some cells permanently silence GFP expression. In the case of the progeny of bone marrow stem cells, it appears that the more distantly related they are to their precursors, the more likely it is that they will turn off the lineage marker.
Keywords: Hematopoetic stem cell, Stem cell transplantation, Lineage tracking, Green fluorescent protein, Immunohistochemistry, Cell fate
Introduction
The green fluorescent protein (GFP) was discovered as a by product of isolating aequorin from jelly fish by Shimomura et al. [1] in 1962. The importance of the discovery was not obvious until much later; GFP proved to be an excellent protein marker molecule for gene expression (see [2]). Gradually, immunohistochemical (IHC) detection techniques have become more and more sensitive. We can measure and visualize proteins in amounts that were unimaginable 10 years ago. Numerous studies utilized GFP to track cell fate following bone marrow transplantation, local injection or promoter specific expression [3–10]. While a variety of groups showed that GFP-expressing bone marrow cells are able to seed many tissues and differentiate into tissue specific cells, an equal number of papers failed to confirm those results and stated the opposite [11, 12]. One of the factors that seem to affect chimerism is the presence or absence of tissue injury/disease. In normal, healthy tissue circulating bone marrow cells do not seem to contribute to regeneration as much as when the tissue is in “need” [4]. Furthermore, it was noted by several studies that the expression of GFP is variable; in many instances the expression weakens with time or in some cases GFP becomes undetectable [13]. The possibility that the GFP transgene can be silenced has also been raised [14–20]. The field has been plagued by controversy mostly due to differences in techniques used by the different groups to follow cell fate. In the last decade a new, very sensitive immunocytochemical technique became available utilizing tyramide signal amplification [1]. Since we also noticed very faintly fluorescence green cells in our experimental samples we decided to try the most sensitive technique to visualize most of the GFP expressing cells. The field has been plagued by controversy mostly due to differences in techniques used by the different groups to follow cell fate as summarized in [21]. In the last decade a new, very sensitive technique became available utilizing tyramide signal amplification [22, 23] and its application to immunohistochemistry was reported [1] describing dilutions of primary antibodies for optimal immunohistochemistry [24] as well as its use in dual immunostaining techniques [25]. Since we also noticed very faint green fluorescent cells in our experimental samples we decided to apply this technique to attempt to visualize most of the GFP expressing cells. The use of this newly designed, sensitive method might help to clarify the confusion in the literature.
Materials and Methods
1. Animal experiments
Female C57B mice were irradiated using 900 rad in two equal doses (irradiation time was 4 min 15 sec each time) 8 hours apart. Following the second irradiation the animals were transplanted with bone marrow from male Z/EG (lacZ/EGFP) double reporter transgenic mice [26] that had previously been crossed with a Creactin mouse to result in an animal which ubiquitously and stably express the green fluorescent protein. Donor mice were euthanized by decapitation under anesthesia and the bodies were dipped in 70% ethanol. The skin and lower limb muscles were removed for the exposure and isolation of the femurs. In a sterile tissue culture hood a cut was made on both ends of the bone and the marrow was flushed out with a 20G needle filled with 4 ml sterile DMEM. The cells were dissociated by sequentially passing them through 18, 20, and 25G needles until getting a single cell suspension. For further purification, the cells were spun at 1000 RPM for 8 min and the supernatant was discarded. Cells were resuspended in 2 ml of DMEM and were kept on 4°C until transplantation (within hours). The irradiated mice received a sterile bone marrow injection through the tail vein with a sterile 27-gauge needle immediately after the second irradiation; an infrared lamp was used to visualize the tail vein accurately. Each mouse received 5x10⁶ cells in 0.5 ml of sterile DMEM.
After full recovery, the mice underwent middle cerebral artery occlusion (MCAO) to induce stroke. The distal MCA was electrocoagulated and cut with a technique [27] modified for mouse from Tamamura [28, 29]. This procedure causes a large infarct involving cortical and subcortical zones [30]. Two months after the MCAO the animals were terminally anaesthetized and perfused by 4% buffered paraformaldehyde. The brains were removed and cryoprotected by immersion into sucrose solutions of increasing concentrations (5, 10 and 20%). Finally the brains were quickly frozen on powdered dry ice and kept in aluminum foil at −80°C until they were sectioned.
2. Immunohistochemistry (IHC) to detect GFP
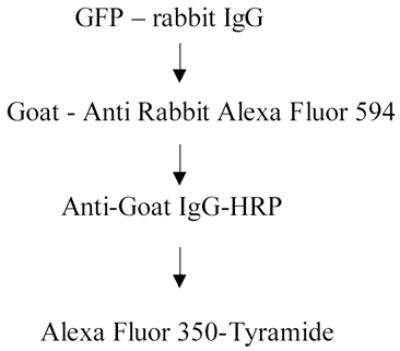
Ten μm thin sections of perfused mouse brains were cut and placed on positively charged microscope slides (Fisher Scientific, Pittsburg, PA Cat#12-550-15). The slides were kept at −80°C until they were processed. At first the slides were coverslipped with Tris buffer and pictures were taken to record the native GFP fluorescence using a Leica DMR6000B inverted microscope with an FITC filter (L cube). The coverslips were then removed and the sections were treated with Powerblock (Biogenex, San Ramon, CA, Cat #: HK083-5K) containing 0.25% Triton X for 10 min at RT and incubated overnight at 4°C in the primary anti-GFP rabbit antibody at 1:2000 dilution (Molecular Probes, OR; Cat#ab13970). Following incubation with the primary antibody we blocked endogenous peroxidase activity by incubating the slides in 3% H2O2 in 1xPBS for 20 minutes. Next, GFP immunostaining and amplification were carried out in two different ways: a.) The primary antibody was detected using a goat anti-rabbit IgG conjugated to Alexa Fluor 594 (1:1000, for 1 hour at RT). This was followed by an anti-goat IgG conjugated to HRP (overnight at 4°C) visualized with a Tyramide-Alexa Fluor-350 conjugate (Molecular Probes – Invitrogen, Cat # T20937) at a dilution of 1:100 for 10 minutes. This way, the original fluorescence stayed green, the immunostained GFP was red and the amplified immunostained GFP was blue.
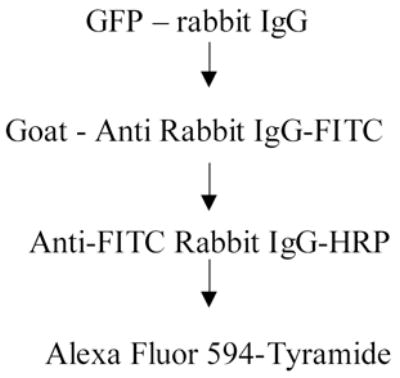
b.) In another set of sections, the primary antibody was detected with anti-rabbit IgG conjugated to FITC (Jackson Immunologicals) applied for 1 hour at RT at a dilution of 1:100. Next an anti-FITC conjugated HRP antibody (1:500, Roche Applied Bioscience, Indianapolis, IN #1426346) was applied overnight at 4°C followed by a Tyramide-Alexa Fluor 594 conjugate (Molecular Probes – Invitrogen, Cat # T20935) at a dilution of 1:200 for 10 minutes.
3. Combined detection of GFP by IHC and the Y chromosome by in situ hybridization (FISH)
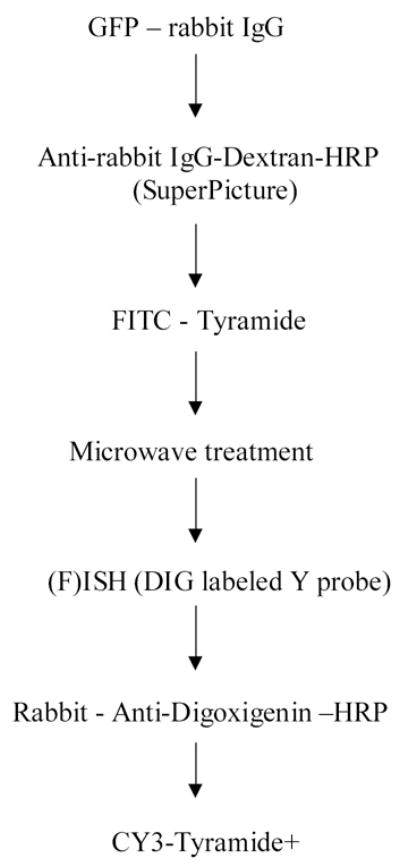
To colocalize GFP and the Y chromosome in the same cells, sections were washed in PBS (pH: 7.4) three times for 3 min, rinsed with distilled water and incubated in 1X Powerblock for 10 min. The sections were rinsed again with distilled water and incubated in rabbit anti-GFP antibody (1:40, 000, Molecular Probes, Eugene, OR) for 1h at room temperature. The endogenous peroxidase activity was blocked with a 3% hydrogen peroxide solution for 15 min followed by 4 PBS washes lasting 3 min each. The secondary antibody - an anti-rabbit HRP polymer conjugate (SuperPicture, Zymed Laboratories Inc., South San Francisco, CA) - was applied undiluted for 30 minutes, and the staining was subsequently visualized using a custom-made FITC conjugated tyramide at 1:10000 for 10 minutes at RT. To perform Y chromosomal FISH, the same sections were immersed in 10mM citric acid (pH 6.0) and microwaved in a kitchen microwave (GE, 700W) for 5 min at 50% power after the liquid started to boil. The water that evaporated was replaced with distilled water, and the sections were left in the solution to cool for 2 hours at RT. Microwave treatment inactivates any HRP activity that is present in the tissue – i.e. endogenous HRP and/or HRP incorporated in reagents used in previous steps [31]. The Y chromosomal hybridization was performed as described earlier [7] using a 1.5-kb RNA probe, (pY3531B) generated against a repeat sequence of the mouse Y chromosome, and labeled with digoxigeninuridine 5'-triphosphate using the digoxigenin labeling kit (Digoxigenin RNA Labeling Kit, Cat. # 1 175 025 - Roche Applied Sciences, Indianapolis, IN). After the hybridization step and several washes in SSC (for details see our website: http://intramural.nimh.nih.gov/lcmr/snge/), the digoxigenin was detected with an anti-digoxigenin antibody that was conjugated to horseradish peroxidase (1:600, Roche Applied Sciences, Indianapolis, IN, Cat No: 1120773391) visualized using the TSA-Plus CY3 System (1:600, PerkinElmer Life Sciences, Boston, MA (now Invitrogen)) (Fig. 1).
Fig. 1.
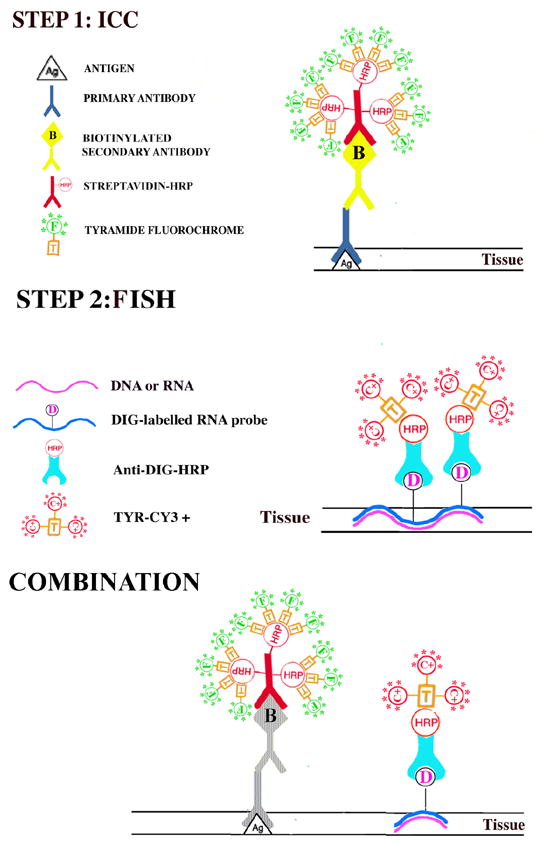
A schematic drawing to demonstrate the staining procedure when combining immunohistochemistry with non-radioactive in situ hybridization histochemistry (ISHH).
Finally, all sections were stained with the chromosomal stain, DAPI, (1:50000; 1 minute, RT) to visualize nuclei. The sections were viewed in a Leica DMR6000 fluorescence microscope and pictures were taken using a Hamamatsu camera and Volocity software (Improvision, Lexington, MA) and. High resolution images were analyzed using NIH Image software, Version 1.35.
4. Controls for specificity and sensitivity of the immunostaining procedures
To ensure the specificity of the immunostaining we performed the same procedures after omitting the primary and/or secondary antibodies in each step. We used secondary antibodies that were cross absorbed with IgG’s of any species that were used to raise previous secondary antibodies to make sure that non-specific binding will not occur at any step during the staining procedure. We have used the GFP amplification sequence, including all the reagents, in brains that were not transplanted with GFP bone marrow and did not observe any staining. We have used several GFP antibodies that were raised against different antigenic sites of the protein and observed similar results. We also used several different dilutions and combinations of tyramide reagents that all resulted in similar staining patterns. We have used the technique in 20 mice brains with similar results – 5 of which were used to do the quantitative studies.
5. Quantitative evaluation
Sections cut at the same level of 5 mouse brains were used to count the number of GFP positive cells following the different staining protocols. The whole section was scanned and cells counted by two independent investigators. The number of GFP positive or Y positive cells in a section were expressed as a percentage of all cells determined by the number of all DAPI positive cell nuclei counted. Statistical analysis was performed using the Friedman non-parametric test and Prism (GraphPad) software.
Results
A one step immunostaining protocol (using the primary antibody and a fluorochrome conjugated secondary antibody) for GFP cells (Fig. 2 B) yielded higher signal intensity and a crisper image than was seen by imaging native fluorescence (Fig. 2 A). The difference between the two images, however, was more quantitative, then qualitative. Due to the increase in staining intensity with IHC (depositing more fluorochrome at the antigen site) more cells were readily detectable even with low magnification. On the other hand, the TSA signal amplification procedure using Alexa Fluor 594-Tyramide conjugate (Fig. 2 C and D) revealed “new” structures; i.e. cells that were not detected before and many fine processes of cells and cell bodies vs. cell bodies alone (Fig. 2 C and D and Fig. 3). When we performed amplified immunostaining for GFP in combination with the Y chromosome in situ hybridization (Fig. 4) we found a number of Y chromosome positive (i.e. donor origin) cells that were not GFP positive even when the most sensitive staining procedure was used. When we compared the number of cells that were visible under low magnification, 40% more cells were detected with amplified IHC than unamplified IHC (Fig. 5). ISH detected an additional 10% of cells that were Y chromosome positive but were negative for GFP immunostaining even after amplification (Fig. 5). The difference between the cell numbers by the different techniques was statistically significant (difference between means p<0.0001).
Fig. 2.
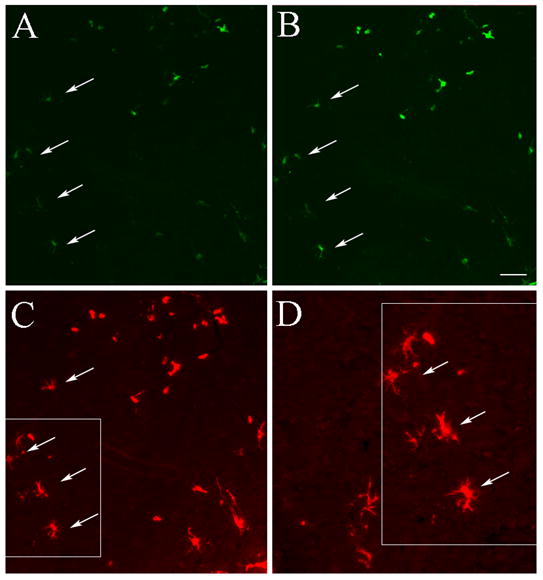
Comparison of native GFP fluorescence (A) with one-step antibody staining using a GFP primary and an anti-rabbit-FITC conjugated secondary antibody (B) and then an antibody to FITC that is preconjugated with HRP and subsequently adding the high affinity substrate Tyramide that is conjugated to Alexa Fluor 594 (C). (D) is an area enlarged from A, B and C to demonstrate cells that were not visible before amplification. Bar: 50 μm (A, B and C) and 25 μm for (D).
Fig. 3.
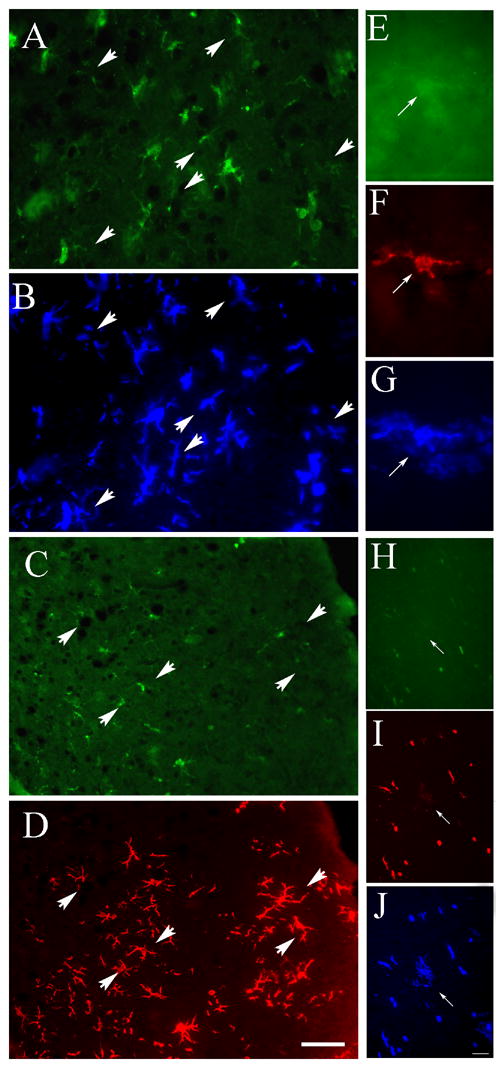
Examples of GFP amplification in the brains of mice that underwent GFP bone marrow transplantation and MCAO ligation. (A) is a field of striatum following immunostaining for GFP using a primary antibody raised in rabbit. A biotinylated anti-rabbit IgG was then followed by the ABC reagent and then a tyramide conjugated Alexa-350 was added as a substrate (B). Arrows point at cells that became visible following the amplification procedure. In another section, a similar procedure was used, but after the first immunostaining using a rabbit anti-GFP, the staining was developed with anti-rabbit IgG-Alexa Fluor 488 raised in goat (C). Then a biotinylated anti-goat IgG was added followed by the ABC reagent. Finally, an Alexa-594-Tyramide was used as a substrate that resulted in a red fluorescent deposit (D). High magnification image of a cell is shown in native green fluorescence (E), following a one step immunostaining with Alexa Fluor 594 (F) and then amplified using Tyramide-350. Note the fine arborization of the cell that was not visible in green (G). (H) shows native GFP fluorescence followed by an immunostaining in red (I) and it is only after the amplification using 350-Tyramide that the whole cell is recognized (J) Bar: 25 μm A–D and 12μm (E–J).
Fig. 4.
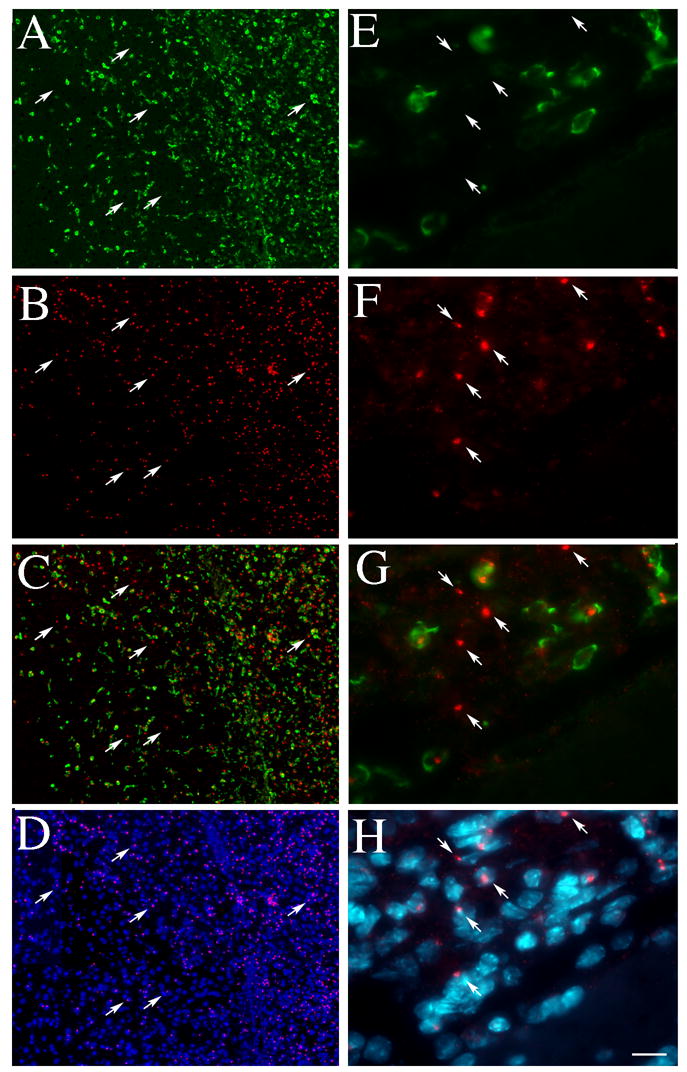
Amplified GFP immunostaining (green) was performed in the same sections where the Y chromosome was visualized with FISH (red) (A –D – low magnification and E–H-high magnification). C and G show an image taken through a dual filter to reveal colocalization of Y and GFP. D and H are overlaid images through the UV (DAPI) and the red (Y chromosome) filter to demonstrate the nuclear localization of the Y chromosome. Arrows point at Y chromosomes that belong to cells with no GFP staining. Bar: 100 μm (A–D) and 16 μm (E–H).
Fig. 5.
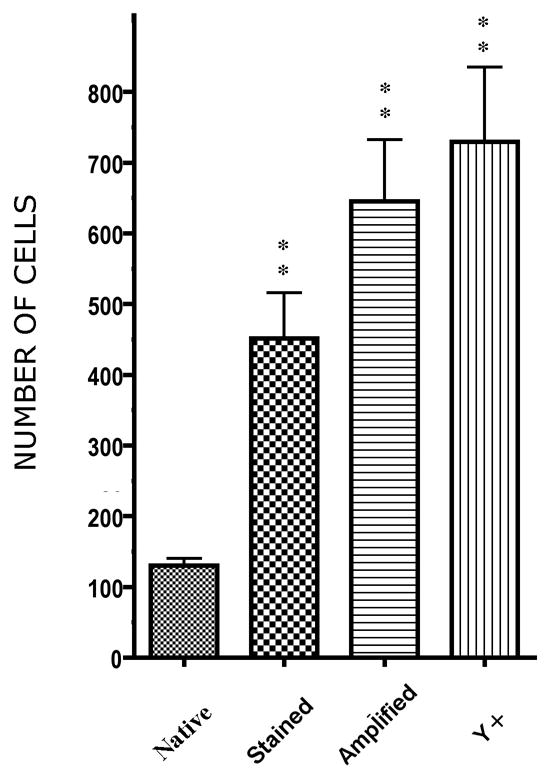
Comparison of the number of donor derived cells in the brain counted based on native fluorescence, immunostained fluorescence, following signal amplification and the number of Y chromosome containing nuclei. Each column represents the average of five animals; sections were taken at the same coronal level. Median values are significanty different at p<0.0001 using the Friedman non-parametric test.
Discussion
The first transgenic mouse was produced by Gordon in 1980 [32]. By constructing transgenes that contained GFP cDNA driven by specific promoter sequences the target proteins could now be identified by detecting the green fluorescence [33]. The use of green fluorescence protein revolutionized the monitoring of gene expression. Many techniques were used and compared to optimize the immunohistochemical detection of GFP using conventional [34] and confocal microscope [35] even in paraffin embedded tissue As more and more studies relying on GFP appeared there were hints that the transgenes might be silenced depending on age, tissue, differentiation and many other factors. Mothe et al. [36] compared detection of GFP in transgenic mice and rats and found that sometimes GFP has to be immunostained to be seen and suggested the possibility of a partial silencing of the transgene after cell transplantation. This could potentially occur because of genetic changes in the DNA or alterations in transcription or translation. DNA methylation is the best known mechanism for silencing a transgene at the level of DNA [37]. There are also many examples of RNAi-mediated inhibition of translation and nonmethylation mediated transcriptional gene silencing including the silencing of the green fluorescent protein. It is not yet known why GFP expression diminishes or completely shuts down in transgenic animals. It is possible that as cells proliferate and differentiate the GFP sequence will be noticed at a checkpoint during the cell cycle and marked to be shut down [38]. Since the expression of GFP varies among cells it is likely that using traditional detection methods we miss many GFP+ cells. The methods and problems of GFP detection have been nicely summarized in a recent review [21]. The fact that GFP turns off may account for many publications in the literature that state that no donor cells were detected when using GFP as a reporter gene to label bone marrow [39–41]. This might be a reason why the literature is so confusing in regards to the question of plasticity and transdifferentiation.
Conclusion
Our experiments demonstrate that on the average we fail to detect half of the cells that express GFP if we use only traditional immunostaining. It is interesting to note that the cells that are still strongly fluorescent are microglia – which are known to be of bone marrow origin. We suggest that the loss of GFP may be a function of differentiation, i.e. the less cells resemble their bone marrow precursors, the less GFP is expressed. Based on our results, the maximal GFP sensitivity can be achieved by simply using a dextran backbone secondary antibody (such as Zymed’s SuperPicture™), which deposits multiple peroxidase sites at the antigenic site and then visualize using a Tyramidefluorochrome (Invitrogen). This technique enables one to detect about 90% of all donor cells present using GFP immunostaining - as shown by the Y chromosome hybridization of gender mismatched transplants. The technique can also be used to detect any other marker protein in the cells (using the water insoluble tyramide) and then performing the Y chromosome hybridization to detect all donor cells. Even the number of Y chromosome positive cells would underestimate the number of all donor-derived cells, since there is a portion of donor cells that will not have the Y chromosome (or even the nucleus) in the section. Increasing our detection sensitivity in such a way will hopefully result in settling many presently unanswered questions and might help resolve the contradictions in the literature regarding (trans)differentiation of different cell types in a variety of tissues.
Supplementary Material
Acknowledgments
This research was supported by the DIR, NIDCR, NINDS and NIMH of the Intramural Research Program, NIH. Zs.E.T. is also supported by OTKA T 043169.
Footnotes
Publisher's Disclaimer: This is a PDF file of an unedited manuscript that has been accepted for publication. As a service to our customers we are providing this early version of the manuscript. The manuscript will undergo copyediting, typesetting, and review of the resulting proof before it is published in its final citable form. Please note that during the production process errors may be discovered which could affect the content, and all legal disclaimers that apply to the journal pertain.
References
- 1.van Gijlswijk RP, Zijlmans HJ, Wiegant J, Bobrow MN, Erickson TJ, Adler KE, Tanke HJ, Raap AK. Fluorochrome-labeled tyramides: use in immunocytochemistry and fluorescence in situ hybridization. J Histochem Cytochem. 1997;45:375–382. doi: 10.1177/002215549704500305. [DOI] [PubMed] [Google Scholar]
- 2.Shimomura O. The discovery of aequorin and green fluorescent protein. J Microsc. 2005;217:1–15. doi: 10.1111/j.0022-2720.2005.01441.x. [DOI] [PubMed] [Google Scholar]
- 3.Beilhack GF, Scheffold YC, Weissman IL, Taylor C, Jerabek L, Burge MJ, Masek MA, Shizuru JA. Purified allogeneic hematopoietic stem cell transplantation blocks diabetes pathogenesis in NOD mice. Diabetes. 2003;52:59–68. doi: 10.2337/diabetes.52.1.59. [DOI] [PubMed] [Google Scholar]
- 4.Abedi M, Greer DA, Colvin GA, Demers DA, Dooner MS, Harpel JA, Pimentel J, Menon MK, Quesenberry PJ. Tissue injury in marrow transdifferentiation. Blood Cells Mol Dis. 2004;32:42–46. doi: 10.1016/j.bcmd.2003.09.026. [DOI] [PubMed] [Google Scholar]
- 5.Yagi T, McMahon EJ, Takikita S, Mohri I, Matsushima GK, Suzuki K. Fate of donor hematopoietic cells in demyelinating mutant mouse, twitcher, following transplantation of GFP+ bone marrow cells. Neurobiol Dis. 2004;16:98–109. doi: 10.1016/j.nbd.2004.01.002. [DOI] [PubMed] [Google Scholar]
- 6.Ito T, Suzuki A, Okabe M, Imai E, Hori M. Application of bone marrow-derived stem cells in experimental nephrology. Exp Nephrol. 2001;9:444–450. doi: 10.1159/000052644. [DOI] [PubMed] [Google Scholar]
- 7.Mezey E, Chandross KJ, Harta G, Maki RA, McKercher SR. Turning blood into brain: cells bearing neuronal antigens generated in vivo from bone marrow. Science. 2000;290:1779–1782. doi: 10.1126/science.290.5497.1779. [DOI] [PubMed] [Google Scholar]
- 8.Shichinohe H, Kuroda S, Lee JB, Nishimura G, Yano S, Seki T, Ikeda J, Tamura M, Iwasaki Y. In vivo tracking of bone marrow stromal cells transplanted into mice cerebral infarct by fluorescence optical imaging. Brain Res Brain Res Protoc. 2004;13:166–175. doi: 10.1016/j.brainresprot.2004.04.004. [DOI] [PubMed] [Google Scholar]
- 9.Nakano K, Migita M, Mochizuki H, Shimada T. Differentiation of transplanted bone marrow cells in the adult mouse brain. Transplantation. 2001;71:1735–1740. doi: 10.1097/00007890-200106270-00006. [DOI] [PubMed] [Google Scholar]
- 10.Hofstetter CP, Schwarz EJ, Hess D, Widenfalk J, El Manira A, Prockop DJ, Olson L. Marrow stromal cells form guiding strands in the injured spinal cord and promote recovery. Proc Natl Acad Sci U S A. 2002;99:2199–2204. doi: 10.1073/pnas.042678299. [DOI] [PMC free article] [PubMed] [Google Scholar]
- 11.Moore KA, Lemischka IR. Stem cells and their niches. Science. 2006;311:1880–1885. doi: 10.1126/science.1110542. [DOI] [PubMed] [Google Scholar]
- 12.Jackson KA, Majka SM, Wulf GG, Goodell MA. Stem cells: a minireview. J Cell Biochem Suppl. 2002;38:1–6. doi: 10.1002/jcb.10045. [DOI] [PubMed] [Google Scholar]
- 13.McTaggart RA, Feng S. An uncomfortable silence em leader while we all search for a better reporter gene in adult stem cell biology. Hepatology. 2004;39:1143–1146. doi: 10.1002/hep.20192. [DOI] [PubMed] [Google Scholar]
- 14.Xia H, Mao Q, Paulson HL, Davidson BL. siRNA-mediated gene silencing in vitro and in vivo. Nat Biotechnol. 2002;20:1006–1010. doi: 10.1038/nbt739. [DOI] [PubMed] [Google Scholar]
- 15.Tiscornia G, Singer O, Ikawa M, Verma IM. A general method for gene knockdown in mice by using lentiviral vectors expressing small interfering RNA. Proc Natl Acad Sci U S A. 2003;100:1844–1848. doi: 10.1073/pnas.0437912100. [DOI] [PMC free article] [PubMed] [Google Scholar]
- 16.Takada T, Nemoto K, Yamashita A, Kato M, Kondo Y, Torii R. Efficient gene silencing and cell differentiation using siRNA in mouse and monkey ES cells. Biochem Biophys Res Commun. 2005;331:1039–1044. doi: 10.1016/j.bbrc.2005.04.020. [DOI] [PubMed] [Google Scholar]
- 17.Siomi MC, Tsukumo H, Ishizuka A, Nagami T, Siomi H. A potential link between transgene silencing and poly(A) tails. Rna. 2005;11:1004–1011. doi: 10.1261/rna.2280105. [DOI] [PMC free article] [PubMed] [Google Scholar]
- 18.Rinne A, Littwitz C, Kienitz MC, Gmerek A, Bosche LI, Pott L, Bender K. Gene silencing in adult rat cardiac myocytes in vitro by adenovirus-mediated RNA interference. J Muscle Res Cell Motil. 2006 doi: 10.1007/s10974-006-9087-0. [DOI] [PubMed] [Google Scholar]
- 19.Caplen NJ, Parrish S, Imani F, Fire A, Morgan RA. Specific inhibition of gene expression by small double-stranded RNAs in invertebrate and vertebrate systems. Proc Natl Acad Sci U S A. 2001;98:9742–9747. doi: 10.1073/pnas.171251798. [DOI] [PMC free article] [PubMed] [Google Scholar]
- 20.Amarzguioui M, Rossi JJ, Kim D. Approaches for chemically synthesized siRNA and vector-mediated RNAi. FEBS Lett. 2005;579:5974–5981. doi: 10.1016/j.febslet.2005.08.070. [DOI] [PubMed] [Google Scholar]
- 21.Brazelton TR, Blau HM. Optimizing techniques for tracking transplanted stem cells in vivo. Stem Cells. 2005;23:1251–1265. doi: 10.1634/stemcells.2005-0149. [DOI] [PubMed] [Google Scholar]
- 22.Bobrow MN, Harris TD, Shaughnessy KJ, Litt GJ. Catalyzed reporter deposition, a novel method of signal amplification. Application to immunoassays. Journal of immunological methods. 1989;125:279–285. doi: 10.1016/0022-1759(89)90104-x. [DOI] [PubMed] [Google Scholar]
- 23.Adams JC. Biotin amplification of biotin and horseradish peroxidase signals in histochemical stains. J Histochem Cytochem. 1992;40:1457–1463. doi: 10.1177/40.10.1527370. [DOI] [PubMed] [Google Scholar]
- 24.von Wasielewski R, Mengel M, Gignac S, Wilkens L, Werner M, Georgii A. Tyramine amplification technique in routine immunohistochemistry. J Histochem Cytochem. 1997;45:1455–1459. doi: 10.1177/002215549704501102. [DOI] [PubMed] [Google Scholar]
- 25.Hunyady B, Krempels K, Harta G, Mezey E. Immunohistochemical signal amplification by catalyzed reporter deposition and its application in double immunostaining. J Histochem Cytochem. 1996;44:1353–1362. doi: 10.1177/44.12.8985127. [DOI] [PubMed] [Google Scholar]
- 26.Novak A, Guo C, Yang W, Nagy A, Lobe CG. Z/EG, a double reporter mouse line that expresses enhanced green fluorescent protein upon Cre-mediated excision. Genesis. 2000;28:147–155. [PubMed] [Google Scholar]
- 27.Leker RR, Aharonowiz M, Greig NH, Ovadia H. The role of p53-induced apoptosis in cerebral ischemia: effects of the p53 inhibitor pifithrin alpha. Exp Neurol. 2004;187:478–486. doi: 10.1016/j.expneurol.2004.01.030. [DOI] [PubMed] [Google Scholar]
- 28.Tamura A, Graham DI, McCulloch J, Teasdale GM. Focal cerebral ischaemia in the rat: 2. Regional cerebral blood flow determined by [14C]iodoantipyrine autoradiography following middle cerebral artery occlusion. J Cereb Blood Flow Metab. 1981;1:61–69. doi: 10.1038/jcbfm.1981.7. [DOI] [PubMed] [Google Scholar]
- 29.Tamura A. Middle cerebral artery occlusion in the young rat. Stroke. 1983;14:831–832. doi: 10.1161/01.str.14.5.831. [DOI] [PubMed] [Google Scholar]
- 30.Belayev L, Busto R, Zhao W, Fernandez G, Ginsberg MD. Middle cerebral artery occlusion in the mouse by intraluminal suture coated with poly-L-lysine: neurological and histological validation. Brain Res. 1999;833:181–190. doi: 10.1016/s0006-8993(99)01528-0. [DOI] [PubMed] [Google Scholar]
- 31.Toth ZE, Mezey E. Simultaneous Visualization of Multiple Antigens With Tyramide Signal Amplification Using Antibodies From the Same Species. J Histochem Cytochem. 2007 doi: 10.1369/jhc.6A7134.2007. [DOI] [PubMed] [Google Scholar]
- 32.Gordon JW, Scangos GA, Plotkin DJ, Barbosa JA, Ruddle FH. Genetic transformation of mouse embryos by microinjection of purified DNA. Proc Natl Acad Sci U S A. 1980;77:7380–7384. doi: 10.1073/pnas.77.12.7380. [DOI] [PMC free article] [PubMed] [Google Scholar]
- 33.Hadjantonakis AK, Gertsenstein M, Ikawa M, Okabe M, Nagy A. Generating green fluorescent mice by germline transmission of green fluorescent ES cells. Mech Dev. 1998;76:79–90. doi: 10.1016/s0925-4773(98)00093-8. [DOI] [PubMed] [Google Scholar]
- 34.Shariatmadari R, Sipila PP, Huhtaniemi IT, Poutanen M. Improved technique for detection of enhanced green fluorescent protein in transgenic mice. Biotechniques. 2001;30:1282–1285. doi: 10.2144/01306st06. [DOI] [PubMed] [Google Scholar]
- 35.Walter I, Fleischmann M, Klein D, Muller M, Salmons B, Gunzburg WH, Renner M, Gelbmann W. Rapid and sensitive detection of enhanced green fluorescent protein expression in paraffin sections by confocal laser scanning microscopy. The Histochemical journal. 2000;32:99–103. doi: 10.1023/a:1004014211408. [DOI] [PubMed] [Google Scholar]
- 36.Mothe AJ, Kulbatski I, van Bendegem RL, Lee L, Kobayashi E, Keating A, Tator CH. Analysis of green fluorescent protein expression in transgenic rats for tracking transplanted neural stem/progenitor cells. J Histochem Cytochem. 2005;53:1215–1226. doi: 10.1369/jhc.5A6639.2005. [DOI] [PubMed] [Google Scholar]
- 37.Jones L, Hamilton AJ, Voinnet O, Thomas CL, Maule AJ, Baulcombe DC. RNA-DNA interactions and DNA methylation in post-transcriptional gene silencing. Plant Cell. 1999;11:2291–2301. doi: 10.1105/tpc.11.12.2291. [DOI] [PMC free article] [PubMed] [Google Scholar]
- 38.Lambert JF, Liu M, Colvin GA, Dooner M, McAuliffe CI, Becker PS, Forget BG, Weissman SM, Quesenberry PJ. Marrow stem cells shift gene expression and engraftment phenotype with cell cycle transit. J Exp Med. 2003;197:1563–1572. doi: 10.1084/jem.20030031. [DOI] [PMC free article] [PubMed] [Google Scholar]
- 39.Balsam LB, Wagers AJ, Christensen JL, Kofidis T, Weissman IL, Robbins RC. Haematopoietic stem cells adopt mature haematopoietic fates in ischaemic myocardium. Nature. 2004;428:668–673. doi: 10.1038/nature02460. [DOI] [PubMed] [Google Scholar]
- 40.Massengale M, Wagers AJ, Vogel H, Weissman IL. Hematopoietic cells maintain hematopoietic fates upon entering the brain. J Exp Med. 2005;201:1579–1589. doi: 10.1084/jem.20050030. [DOI] [PMC free article] [PubMed] [Google Scholar]
- 41.Wagers AJ, Sherwood RI, Christensen JL, Weissman IL. Little evidence for developmental plasticity of adult hematopoietic stem cells. Science. 2002;297:2256–2259. doi: 10.1126/science.1074807. [DOI] [PubMed] [Google Scholar]
Associated Data
This section collects any data citations, data availability statements, or supplementary materials included in this article.