Abstract
The pathophysiology of schizophrenia may involve perturbations of synaptic organization during development. The presence of cytoarchitectural abnormalities that may reflect such perturbations in the brains of patients with this disorder has been well-documented. Yet the mechanistic basis for these features of the disorder is still unknown. We hypothesized that altered regulation of the neuronal growth-associated protein GAP-43, a membrane phosphoprotein found at high levels in the developing brain, may play a role in the alterations in brain structure and function observed in schizophrenia. In the mature human brain, GAP-43 remains enriched primarily in association cortices and in the hippocampus, and it has been suggested that this protein marks circuits involved in the acquisition, processing, and/or storage of new information. Because these processes are known to be altered in schizophrenia, we proposed that GAP-43 levels might be altered in this disorder. Quantitative immunoblots revealed that the expression of GAP-43 is increased preferentially in the visual association and frontal cortices of schizophrenic patients, and that these changes are not present in other neuropsychiatric conditions requiring similar treatments. Examination of the levels of additional markers in the brain revealed that the levels of the synaptic vesicle protein synaptophysin are reduced in the same areas, but that the abundance of the astrocytic marker of neurodegeneration, the glial fibrillary acidic protein, is unchanged. In situ hybridization histochemistry was used to show that the laminar pattern of GAP-43 expression appears unaltered in schizophrenia. We propose that schizophrenia is associated with a perturbed organization of synaptic connections in distinct cortical associative areas of the human brain, and that increased levels of GAP-43 are one manifestation of this dysfunctional organization.
Structural anomalies are present in the brains of patients with schizophrenia. In vivo neuroimaging techniques have demonstrated a significant ventricular enlargement and decrease in cortical mass that seem to be unrelated to the treatment of the disorder (1). Postmortem analyses of schizophrenic patients also show a reduction in the total brain volume, particularly in the cerebral cortex (2). Fine structural neuropathology also has been detected in the frontal and temporal lobes of schizophrenics (reviewed in refs. 3 and 4). Careful microscopic evaluation has revealed specific neuronal loss in the cingulate cortex (5, 6, 7), hippocampal formation, entorhinal cortex, and parahippocampal gyrus (8, 9), demonstrating for the first time the presence of cytoarchitectural aberrations in schizophrenia. The reduction in numbers of neuronal cells was not accompanied by reactive gliosis, as would have been expected for a neurodegenerative lesion occurring in adulthood. Although the cause of the specific cell loss remains unknown, the idea of schizophrenia as a neurodevelopmental disorder is an attractive hypothesis (3, 4, 10, 11, 12, 13, 14, 15, 16, 17).
The presence of cytoarchitectural abnormalities in schizophrenia has been well-documented, but the underlying mechanisms causing these features of the disorder remain unclear. In a search for molecular correlates of the alterations in brain structure and function observed in schizophrenia, we focused on the neuronal protein GAP-43, a membrane phosphoprotein implicated in the initial establishment and reorganization of synaptic connections (for review, see refs. 18 and 19). Developing neurons express high levels of GAP-43 during axonal growth and synaptogenesis. Although in most neurons GAP-43 levels decline sharply once synaptic connections mature (20), synapses in the limbic system and in the neocortex maintain high levels of this protein throughout life. In the adult human brain, GAP-43 is enriched primarily in association cortices and in the hippocampus (21, 22, 23). The restricted localization of this protein to higher integrative regions suggests that it may play a role in specialized functions of these areas such as processing and storage of multimodal information. In fact, gradients of this protein in the primate visual system peak in visual memory storage areas (24), and changes in its state of phosphorylation are associated with synaptic plasticity in mature neurons (25, 26). Given the biological properties of GAP-43 and its selective localization in associative areas of the brain, it has been suggested that this protein marks circuits involved in the acquisition, processing, and/or storage of new information. Since these processes are known to be altered in schizophrenia, we proposed that GAP-43 levels might be altered in this disorder.
We used quantitative Western blots to determine the levels of GAP-43 protein in primary sensory and association cortices of brains from patients with schizophrenia. Our results indicate that GAP-43 gene expression is selectively increased in the visual association and frontal cortices of schizophrenic brains, and that these changes are not present in other neuropsychiatric conditions requiring similar treatments. Comparative analysis of other markers revealed that the levels of the synaptic vesicle protein synaptophysin are reduced in the same areas, but that the abundance of the astrocytic marker of neurodegeneration, the glial fibrillary acidic protein (GFAP), is unchanged. In light of these observations, we propose that schizophrenia is associated with a perturbed organization of synaptic connections in distinct cortical associative areas of the human brain.
MATERIALS AND METHODS
Postmortem Tissues.
Brain tissue specimens from the primary visual cortex [Brodmann’s area 17 (A17)], the visual association cortex (A20), and the frontal pole (A9 and A10) were obtained from the Brain Tissue Resource Center at the McLean Hospital (Belmont, MA) (see Table 1). Specimens were dissected from the right hemisphere under the supervision of one of the authors (E.D.B.). All tissues examined were determined to be free of any known pathology upon standard neuropathological examination. The diagnosis of schizophrenia was made by examining antemortem clinical records and applying the criteria of Feighner et al. (27). These rigorous criteria exclude patients with related disorders such as bipolar depression. All cases used in these studies were classified as chronic undifferentiated schizophrenia. Control patients had no detected antemortem neurological or psychiatric disease or any other chronic disorder and were selected to match as closely as possible the sex, age, and brain areas of patients in the schizophrenic group. Both groups consisted of male subjects with ages ranging from 23–72 years, and with postmortem intervals (PMI) less than 48 h. To control for the effects of medication, postmortem brain tissues from medicated patients with other neuropsychiatric disorders were included in our analysis (Table 1, see “Other” group). As shown in Table 2, there were no significant differences in the age and PMI for the three groups examined in the four areas analyzed. For those patients in whom area 20 was examined, the PMI of the control group tended to be shorter than that of the schizophrenic group, but the differences were not statistically significant (P < 0.1). Furthermore, our finding that GAP-43 protein levels in postmortem tissues are not affected within PMIs of less than 48 h (28) indicates that the PMI is not a major confounding variable in the population examined (Table 1). Twenty-two percent of schizophrenic patients died of suicide, in contrast to the 11% of controls and 14% of the “other” group. The increase in suicide rate is characteristic of schizophrenic patients who die relatively young (<45 years; refs. 29 and 30), and reflects our selection of the most severe cases for the analysis.
Table 1.
Clinical data
| Brain no. | Area | Dx | Age | PMI | Treatment | Cause of death |
|---|---|---|---|---|---|---|
| B-0241 | 17/20 | S | 59 | 16 | Hal, Ph | Myocardial infarction |
| B-0951 | 17/9/10 | S | 32 | 17 | Hal, Ph | Septic infection |
| B-1013 | 17 | S | 26 | 5 | Hal, Ph | Broncopneumonia |
| B-1328 | 17 | S | 23 | 22 | Ph | Suicide (trauma) |
| SB-016 | 17/9 | S | 58 | 9 | Ph | Pulmonary edema |
| B-1312 | 17/20/10 | S | 34 | 12 | Hal, Ph, Li | Suicide (hanging) |
| B-0079 | 17 | S | 50 | 6 | Ph | Septic infection |
| B-0127 | 17 | S | 43 | 22 | Hal | Suicide (hanging) |
| SB-024 | 17/20/10 | S | 62 | 11 | Ph | Pancreatic cancer |
| B-0897 | 17/20/10 | S | 38 | 29 | Hal, Ph, Li | Pulmonary embolism |
| B-1138 | 20 | S | 27 | 8 | Hal | Suicide (sepsis) |
| B-1350 | 20 | S | 36 | 24 | Hal | Septic infection |
| SB-022 | 9 | S | 51 | 13 | Hal | Myocardial infarction |
| B-1290 | 9/10 | S | 66 | 18 | Hal | Broncopneumonia |
| B-0698 | 9 | S | 61 | 22 | Hal, Ph | Aspiration pneumonia |
| B-1943 | 10 | S | 30 | 4.5 | Hal, Ph | Broncopneumonia |
| SB-010 | 9 | S | 51 | 24 | Hal | Cancer |
| B-1445 | 9 | C | 67 | 24 | Septic infection | |
| B-0112 | 9 | C | 38 | 19 | Pulmonary embolism | |
| B-1538 | 9/10 | C | 64 | 16 | Aspiration pneumonia | |
| B-1594 | 9 | C | 70 | 8 | Cancer | |
| B-1388 | 10 | C | 27 | 17 | Cerebral edema, infarct | |
| B-2126 | 10 | C | 36 | 30.5 | Trauma, hemorrhage | |
| B-2124 | 10 | C | 43 | 10 | Myocardial infarction | |
| B-2127 | 10 | C | 43 | 20.5 | Suicide | |
| B-0593 | 10 | C | 32 | 17.5 | Broncopneumonia | |
| B-0057 | 17/20 | C | 56 | 13 | Congestive heart failure | |
| B-0508 | 17 | C | 36 | 6 | Myocardial infarction | |
| B-1364 | 20 | C | 45 | 12 | Myocardial infarction | |
| B-0065 | 20 | C | 31 | 4 | Septic infection | |
| B-1092 | 17 | C | 65 | 48 | Pulmonary embolism | |
| CB-013 | 17 | C | 45 | 14 | Pulmonary embolism | |
| CB-022 | 17 | C | 35 | 21 | Suicide (stroke) | |
| UM-01 | 17/20 | C | 72 | 6 | ||
| B-1027 | 17 | C | 63 | 5 | Aspiration pneumonia | |
| B-0214 | 17/20/10 | 0 (de) | 56 | 24 | Hal, Ph | Hemorrhagic pneumonitis |
| B-0560 | 17/10 | 0 (bp) | 27 | 19 | Hal, Li, Ph | Suicide (sepsis) |
| B-1677 | 17/10 | 0 (hd) | 52 | 12 | Hal | Broncopneumonia |
| B-1764 | 17/10 | 0 (hd) | 61 | 18 | Hal | Myocardial infarction |
| B-0409 | 20/10 | 0 (ud) | 73 | 15 | Lung cancer | |
| B-0246 | 9/10 | 0 (pd) | 73 | 16 | Myocardial infarction | |
| B-0271 | 10 | 0 (hd) | 60 | 24 | Hal | Broncopneumonia |
All subjects were male. Medications are Hal, haloperidol; Ph, phenothiazines; and Li, lithium. S, schizophrenic; C, control; O, other (nonschizophrenic, neuroleptic-treated patients); de, dementia; bp, bipolar depression; hd, Huntington disease; ud, unipolar depression; and pd, Parkinson disease.
Table 2.
Statistical analysis of patient population
| Brain area | Cases | Schizophrenic | Control | Other |
|---|---|---|---|---|
| A17 | n | 10 | 6 | 4 |
| Age | 42.5 ± 14.2 | 53.2 ± 14.7 | 49.0 ± 15.1 | |
| PMI | 14.9 ± 7.8 | 16.1 ± 4.0 | 18.3 ± 4.9 | |
| A20 | n | 6 | 4 | 2 |
| Age | 42.8 ± 14.2 | 51.0 ± 17.4 | 64.5 ± 12.0 | |
| PMI | 16.7 ± 8.2 | 8.8 ± 3.0 | 20.0 ± 5.7 | |
| A9 | n | 5 | 4 | 1 |
| Age | 51.6 ± 12.6 | 59.8 ± 14.7 | 73 | |
| PMI | 16.2 ± 5.6 | 16.8 ± 6.7 | 16 | |
| A10 | n | 6 | 6 | 6 |
| Age | 43.7 ± 16.0 | 40.8 ± 13.0 | 54.8 ± 15.4 | |
| PMI | 15.3 ± 8.3 | 18.3 ± 6.0 | 19.0 ± 4.6 |
Data indicate the mean ± SD of age and PMI for the cases listed in Table 1.
Tissue Preparation.
For each experiment, tissues from schizophrenic and control brains were processed in parallel using codified numbers to conceal the nature of the diagnosis during the analysis. Synaptosomal plasma membrane (SPM) fractions were isolated from human brain specimens as described by Perrone-Bizzozero et al. (31). Briefly, tissue was homogenized in 0.32 M sucrose/50 mM Tris·HCl, pH 7.4/0.1 mM phenylmethylsulfonyl fluoride in a glass-Teflon homogenizer and fractionated by sucrose gradient centrifugation. SPMs were resuspended in buffer containing 10 mM Tris·HCl, pH 7.4/5 mM EGTA, pH 7.4/5 mM MgCl2, and protein concentration was determined by the Coomassie blue method (32) using BSA as a standard. Samples were stored at −80°C at a concentration of 1 mg/ml.
Western Blot Analyses.
Levels of GAP-43 and other neural proteins present in SPM fractions were determined by a quantitative Western blot method (see Fig. 1A). Briefly, samples containing 10 μg of protein were solubilized in SDS-sample buffer and proteins were separated on 10% (wt/vol) polyacrylamide gels (33). Proteins were then transferred from the gel to membranes (Immobilon-P, Millipore) using a semidry transfer apparatus (Bio-Rad) as described by Towbin et al. (34). To control for variations in protein loading, blots were stained with 0.1% (wt/vol) Coomassie brilliant blue in 50% (vol/vol) methanol and 10% (vol/vol) acetic acid for 15 min, and then air-dried and scanned for densitometry using a Foto/Analyst image analysis system with collage software (Fotodyne, New Berlin, WI).
Figure 1.
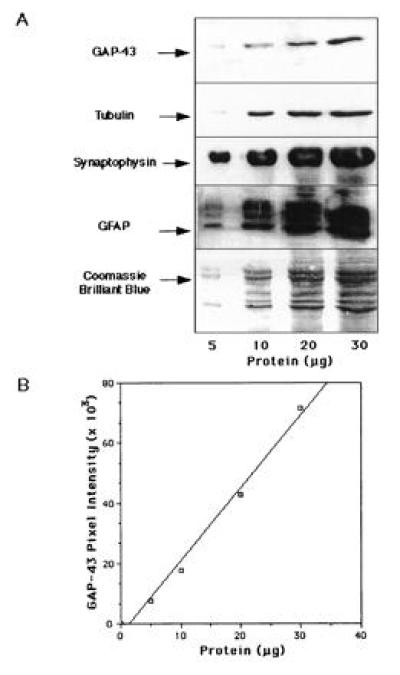
Linear range of responses of the Western blots for GAP-43 and other synaptic proteins. (A) Samples containing 5, 10, 20, and 35 μg of human SPM protein were analyzed by Western blots (see Materials and Methods). (B) Densitometric quantitation of the band intensities corresponding to GAP-43 showed linear responses between 5 and 35 μg of total protein loaded.
For immunodetection of specific antigens, membranes were incubated in blocking buffer containing 150 mM NaCl/20 mM Tris·HCl, pH 7.4/0.5% (vol/vol) Tween 20/10% (wt/vol) nonfat milk for 1 h at room temperature. For GAP-43 detection following this step, a GAP-43 polyclonal antibody was added at a 1:3000 dilution and the membrane incubated overnight at 4°C as described by Benowitz et al. (23, 35). For synaptophysin and GFAP protein detection, polyclonal antibodies (Dako) were added to blocking buffer at a 1:5000 dilution for each protein. For tubulin detection, monoclonal antibodies (Sigma) were used at a 1:5000 dilution. The blots were washed three times in blocking buffer and incubated for 1 h in the presence of the appropriate secondary antibody conjugated to horseradish peroxidase (Southern Biotechnology Associates). Blots were then exposed to enhanced chemiluminescence reagents (Amersham) for 1 min and exposed to x-ray film until the appropriate band density was obtained. Autoradiograms were air-dried and scanned for densitometry as described above. Statistical analysis was performed using the Macintosh (Cupertino, CA) program jmp-in, which corrected for varying ages and PMI through multivariate regression analysis. The data for the schizophrenic and control groups were compared using a two-tailed Student’s t test. When the “other” population was included in the analysis, the results for the three different groups were analyzed using a one-way ANOVA.
In Situ Hybridization Histochemistry.
Human brain tissues were rapidly dissected from brains matched for age and PMI, frozen rapidly, and stored at −85°C. The brain subregions were cut into sections 12 μm thick on a cryostat, after which sections were fixed in buffered 4% paraformaldehyde for 10 min at room temperature, rapidly air-dried, and stored desiccated at −70°C. At the time of use, sections were blocked with 0.1 M glycine, rinsed, and acetylated with 0.25% acetic anhydride in 0.1 M triethanolamine, pH 8.0. Sections were washed in 2× SSC (1× SSC = 0.15 M sodium chloride/0.015 M sodium citrate, pH 7) and delipidated by treatment with ethanol and chloroform. Sections were then partially rehydrated and incubated overnight at 60°C with 10,000 cpm/μl antisense and control sense 35S-labeled riboprobes (synthesized as described in ref. 22) in a solution containing 50% formamide, 10% dextran sulfate, 20× Denhardt’s solution, 300 μg/ml sheared salmon sperm DNA, 150 μg/ml tRNA, 2× SSC, and 20 mM 2-mercaptoethanol. Following hybridization, sections were treated with RNase A and were washed with increasing stringency (final stringency 0.1× SSC at 60°C). Sections were dried, dipped in a 1:1 dilution of Kodak NTB2 emulsion with water, and developed after 3 weeks. Controls included hybridizations with sense strands. Control brains were processed in parallel with matched schizophrenic brains.
RESULTS
Calibration of the Linear Range of Detection.
To assess the specificity and linear range of responses in immunoblots for the antibodies used in this study, we subjected 5, 10, 20, and 35 μg of total SPM protein from postmortem human brain to SDS/PAGE, transferred the samples to Immobilon, and probed the membranes with antibodies to GAP-43, synaptophysin, tubulin, and GFAP (Fig. 1A). The GAP-43 antibody specifically reacted with a unique band that migrates at 43 kDa, consistent with the apparent molecular mass of GAP-43 on SDS/PAGE. Similarly, the antibodies to synaptophysin, tubulin, and GFAP detected protein bands of the appropriate sizes. Densitometric quantitation of the band intensities corresponding to the immunoreactivity of the antibodies showed a linear relationship between signal intensity for each antibody and amount of total protein, within the entire range from 5–35 μg of protein loaded. The dose-response curve for the GAP-43 antibody is shown in Fig. 1B.
Analysis of GAP-43 Protein Levels in Schizophrenic and Control Visual Cortex.
Having established the linear range for Western blot detection by the antibodies used in this study, we used this method to determine GAP-43 levels in postmortem tissues derived from schizophrenic and control patients (Table 1). We had determined previously that GAP-43 mRNA and protein levels in control human brains vary strikingly between primary sensory and associative cortices, showing considerably higher levels in associative regions of the cerebral cortex than in other cortical areas (22, 23). To determine whether this pattern of GAP-43 expression was reproduced in the schizophrenic brain, we compared the levels of GAP-43 protein in A20 (visual association cortex) and A17 (primary visual cortex) of schizophrenic and control brains (Fig. 2). Analysis of the tissues derived from patients with schizophrenia showed the same relative abundance of GAP-43 in associative visual cortex as was seen in control brains. Unexpectedly, however, we discovered that GAP-43 protein was present in A20 of schizophrenic brain at levels approximately twice those in control brain A20, whereas its levels in A17 relative to controls remained unchanged (Fig. 3).
Figure 2.
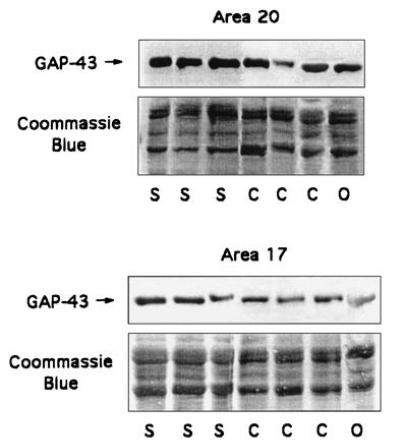
GAP-43 levels in representative schizophrenic (S), control (C), and other (O) patients. Areas examined included A20 (visual association cortex) and A17 (primary visual cortex). Western blots were performed as described (see Materials and Methods). The Coomassie blue area shows the range between 30 and 60 kDa, which is the area to which all of our markers migrate (GAP-43 at 43, synaptophysin at 38, GFAP at several bands between 40 and 50, and tubulin at 55 kDa). A20 tissues shown are (left to right): B-0897, SB-024, B-0241, B-0057, B-0065, B-1364, and B-0214. A17 tissues shown are (left to right): B-0951, SB-016, B-0241, B-0057, B-0508, CB-022, and B-1677. The clinical data on the cases analyzed are summarized in Table 1.
Figure 3.
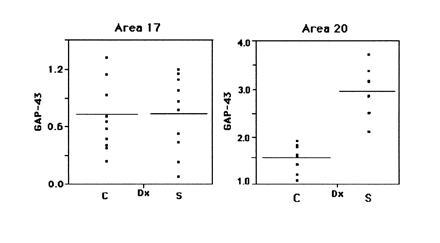
GAP-43 levels were determined in A17 and A20 from multiple patients using Western blotting. The plots represent the data obtained in one representative trial, analyzed using the JMP-IN program. Each dot within a population represents the specific protein level from a given case, and the horizontal bars within each population represent the population mean.
Because many schizophrenic patients are treated with antipsychotic drugs, it was important to determine whether administration of these drugs altered the abundance of GAP-43. To evaluate the effect of the medication, GAP-43 levels were also analyzed in nonschizophrenic neurospsychiatric patients (referred to as “other” in Table 1) who received pharmacological treatment similar to that of the schizophrenic group. GAP-43 levels in the “other” group were not significantly different from those in the control group. Thus, in agreement with our previous studies of haloperidol-treated rats (28), the neuroleptic medication had no direct effect on GAP-43 levels.
To evaluate the specificity of this increase in GAP-43 protein in A20 of schizophrenic patients, we determined the protein levels of synaptophysin, GFAP, and tubulin in schizophrenic and control visual cortices (Fig. 4). Synaptophysin is a synaptic vesicle protein used as a marker of synaptic density in the brain (36, 37). Levels of this protein were assessed to determine whether the abundance of a synaptic protein distinct from GAP-43 was also affected in schizophrenia. The expression of GFAP was evaluated as an indicator of neurodegeneration. Levels of tubulin, which were not altered in schizophrenia, were used as a control in addition to the Coomassie brilliant blue staining to correct for variations in protein loading in the gels. The results, summarized in Fig. 5, represent the data obtained from at least three independent trials using quantitative Western blotting as shown in Figs. 2 and 4. Our data indicate that GAP-43 levels are significantly increased in A20 of patients with schizophrenia relative to those of controls. In contrast, levels of synaptophysin are significantly decreased in both A17 and A20 of patients with mental disorders relative to control patients. In agreement with previous studies, we found no increases in GFAP, a marker for neurodegeneration, in the brains of patients with schizophrenia (5, 38).
Figure 4.
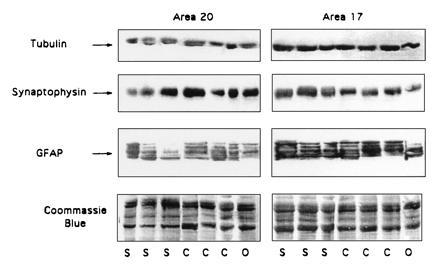
Tubulin, synaptophysin, and GFAP protein levels were determined in A20 and A17 from the same control (C), schizophrenic (S), and control “other” (O) patients described in Fig. 2. Proteins were analyzed by Western blots (see Materials and Methods).
Figure 5.
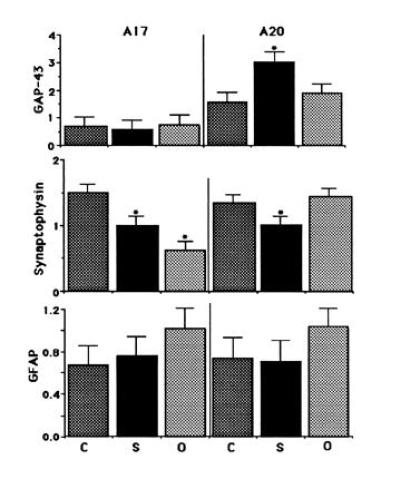
GAP-43, tubulin, synaptophysin, and GFAP levels were determined as described in Figs. 2 and 4. Shown are the results of at least three independent trials of Western blot analysis. Statistical analysis of the data was performed using a one-way ANOVA. Asterisks indicate significant differences between the schizophrenic and the two control groups (P < 0.05). For some of the cases, A17 or A20 only was available. Statistical analysis of the seven cases in which we had specimens from both A17 and A20 yielded the same results as those shown, which combined specimens derived from different brains with those from the same brains.
Analysis of GAP-43 Protein Levels in Schizophrenic and Control Frontal Cortex.
Because earlier studies had revealed anatomic changes in the frontal cortices of individuals with schizophrenia (reviewed in ref. 39), we used Western blots to examine possible alterations in GAP-43 protein in prefrontal cortical areas (A9 and A10) of schizophrenic brains (Fig. 6). Statistical analysis revealed that levels of GAP-43 were significantly increased in A9 and A10 of schizophrenic relative to control brain, with an approximately 100% increase, similar to that observed in A20. Once again, synaptophysin levels were shown to be decreased in A9 and A10 in schizophrenia, whereas no significant differences in GFAP protein levels were observed in frontal cortex between schizophrenia and control brains (Table 3). Therefore, although the association areas in the inferior temporal region and prefrontal cortex participate in very different circuitry, both association cortical areas seem to be similarly affected in schizophrenia.
Figure 6.
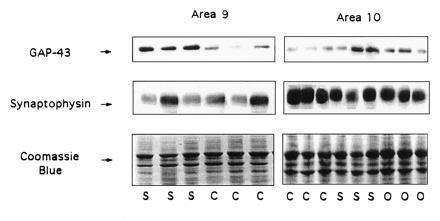
GAP-43 and synaptophysin levels were determined in A9 and A10 (prefrontal cortex) from representative schizophrenic and control cases using Western blotting methods. A9 tissues shown are (left to right) SB-016, B-0951, SB-022, B-0112, B-1538, and B-1594. A10 tissues shown are (left to right): B-1388, B-1538, B-0065, B-1943, SB-024, B-0951, B-1677, B-0560, and B-0124. Arrow (Bottom) indicates the migration of GAP-43.
Table 3.
GAP-43 and other synaptic protein levels in visual and frontal cortices
| Brain area | GAP-43
|
Synaptophysin
|
GFAP
|
|||
|---|---|---|---|---|---|---|
| C | S | C | S | C | S | |
| A17 | 0.72 ± 0.11 (7) | 0.63 ± 0.18 (10) | 1.57 ± 0.35 | 1.01 ± 0.25 | 0.65 ± 0.17 | 0.74 ± 0.18 |
| A20 | 1.58 ± 0.25 (4) | 3.13 ± 0.73 (6)* | 1.40 ± 0.36 | 1.03 ± 0.20* | 0.78 ± 0.09 | 0.72 ± 0.16 |
| A9 | 1.69 ± 0.44 (4) | 3.67 ± 0.58 (5)* | 1.81 ± 0.14 | 1.39 ± 0.12* | 0.60 ± 0.07 | 0.55 ± 0.06 |
| A10 | 1.30 ± 0.35 (6) | 1.98 ± 0.15 (6)* | 2.22 ± 0.45 | 1.25 ± 0.14* | 0.77 ± 0.19 | 0.65 ± 0.17 |
Values represent the mean protein level ± SEM using the n indicated in parentheses for at least three independent trials. The n values for synaptophysin and GFAP are the same as indicated for GAP-43. C, control; S, schizophrenic.
P < 0.05.
In Situ Hybridization Analysis of the Pattern of Increase of GAP-43 Expression in Association Cortex in Schizophrenia.
To ascertain the cellular distribution of GAP-43 expression in schizophrenic and control brain, we carried out in situ hybridization. Examples of the results obtained for A10 are shown (Fig. 7). We had reported previously (22) that expression of GAP-43 mRNA in A20 predominated in layer 2 neurons. In contrast, expression of GAP-43 mRNA in A10 (Fig. 7 A–D) is robust not only in layer 2 neurons but in deeper layers as well, although, as in A20, few GAP-43-positive cells are detected in layer 1. On material counterstained with cresyl violet (Fig. 7E), labeled cells appeared to be neurons. Sections hybridized with sense RNA probes did not display specific hybridization signal (data not shown). A comparison of the in situ hybridization results obtained in A10 from schizophrenic brain (Fig. 7 A and C) relative to those in A10 from control brain (Fig. 7 B and D) revealed that the increased expression of GAP-43 mRNA, as detected at this gross level, does not appear to result in an altered laminar pattern of expression. We cannot rule out the possibility that subtle alterations detectable only by careful quantitation are not present in the schizophrenic brain.
Figure 7.
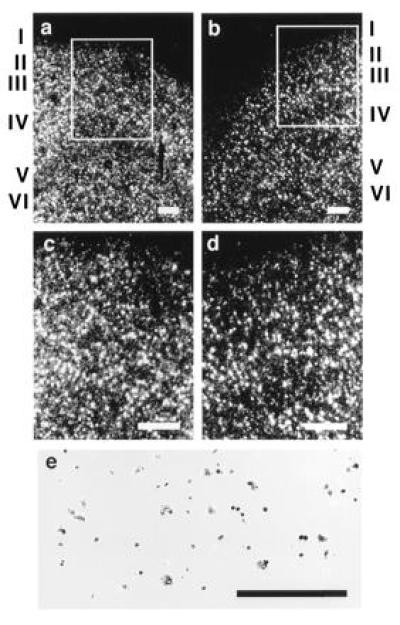
In situ hybridization of a human GAP-43 riboprobe to A10 of human cortex. (a and c) Dark-field micrographs of GAP-43 hybridization in A10 of schizophrenic brain, with c being a higher magnification of the superficial layers outlined in a. (b and d) GAP-43 hybridization in A10 of control brain, with d being a higher magnification of the superficial layers outlined in b. (e) A bright-field view of GAP-43 hybridization in A10 of schizophrenic brain. Cortical layers are indicated in Roman numerals. (a–d, bar = 250 μm; e, bar = 125 μm.)
DISCUSSION
Using quantitative Western blot analysis, we examined the levels of GAP-43, synaptophysin, and GFAP in primary (A17) and associative (A20) visual cortex and in frontal cortex (A9 and A10) of schizophrenic and age-, sex-, and PMI-matched controls. These studies revealed increases in the levels of GAP-43 protein in visual association and frontal cortices of schizophrenic brains. No significant differences in the abundance of GAP-43 protein were found in the primary visual cortex. Given the relationship of GAP-43 expression to the establishment and remodeling of neural connections, our results support the hypothesis that schizophrenia is associated with perturbations of synaptic connections in associative areas of the human brain. The facts that GAP-43 levels were expressed relative to total synaptic protein and that synaptophysin, another synaptic marker, was not increased in these same areas of schizophrenic brain tissues suggest that the perturbation does not consist of a simple increase in synaptic number. Furthermore, our findings that GAP-43 levels were not affected in the brains of other neuropsychiatric populations suggest that these alterations are specific for schizophrenia.
In contrast to that of GAP-43, synaptophysin expression was decreased in all cortical areas examined in schizophrenic brain tissues. These observations are in agreement with recent reports of reduced synaptophysin immunoreactivity in the prefrontal cortex in this disorder (40). We found, however, that the reduced levels of synaptophysin in primary visual cortex of schizophrenic patients were also seen in the brains of patients with mental disorders other than schizophrenia, and that only the lower levels in A20, A10, and A9 were specific to schizophrenia. Thus, synaptophysin levels were selectively decreased in the same areas in which we observed a significant increase in GAP-43 levels. The increased ratios of GAP-43 over synaptophysin seen in schizophrenia are difficult to interpret. Synaptophysin is an integral membrane protein of the synaptic vesicle that is involved in neurotransmitter release (41). GAP-43 is located on the intracellular face of the synaptic plasma membrane and also plays a role in neurotransmitter release (42, 43, 44), perhaps by regulating fusion of synaptic vesicles with the plasma membrane. The alterations in GAP-43 and synaptophysin levels in associative cortical regions in schizophrenia may reflect a functional reorganization of synapses involving alterations in neurotransmitter release, which could cause abnormal processing of neuronal information. Alternatively, given the differential expression of GAP-43 and synaptophysin at different stages during the establishment of synaptic connections (45), the increase in the levels of GAP-43 together with a concomitant decrease in synaptophysin expression suggests that the affected synapses may be functionally immature. In either case, these synaptic alterations could cause the sensory processing dysfunctions characteristic of schizophrenia.
The levels of GFAP were not changed in the regions of schizophrenic brain that were evaluated, showing that the presumptive synaptic reorganization occurring in these cortical areas is not accompanied by neurodegeneration. The abundance of the cytoskeletal protein tubulin also remained unchanged in schizophrenia, suggesting that the changes in levels of GAP-43 and synaptophysin that we observed are related specifically to molecular mechanisms underlying the pathophysiology of schizophrenia. The results do not appear to be due to the effect of medication, since similar changes were not detected in the brains of haloperidol-treated rats (28) or in individuals with neuropsychiatric diseases distinct from schizophrenia (Fig. 5).
It has been hypothesized that schizophrenia is a developmental disorder. Supporting this idea, alterations in hippocampal cytoarchitecture and expression of some neurodevelopmental markers have been found in schizophrenia (46, 47, 48). However, the precise mechanisms underlying these neurodevelopmental changes are far from being understood. Feinberg (10), for example, has suggested that schizophrenia may result from a defect in presumptive synaptic pruning that occurs in cognitive regions of the brain during adolescence. We have shown that GAP-43 levels in the cat visual cortex are correlated with the “critical” period (49). Furthermore, GAP-43 mRNA levels in the primary visual cortex of developing kittens are elevated when the kittens are deprived of light during the critical period of visual cortical plasticity, and exposure of the kittens to light results in a dramatic decrease in GAP-43 within hours (50). We have inferred from these data that light deprivation defers the normal pruning of synaptic connections that is thought to occur during the critical period of development of the primary visual cortex, and that elevated levels of GAP-43 reflect such a delay in synaptic pruning. Similarly, it is possible that the elevated levels of GAP-43 in associative cortical regions of schizophrenic brain are indicative of defects in synaptic pruning that normally occur during development. Such a scenario would be consistent with the finding of increased numbers of axons in the frontal and cingulate cortices of schizophrenic patients (51).
In conclusion, our results suggest that there is an alteration in the organization of synaptic connections in schizophrenia. The selective localization of these alterations to association neocortex is consistent with the clinical features of this illness. Given that the levels of GAP-43 and synaptophysin gene expression are regulated during brain development, our results support the hypothesis of a developmental anomaly in schizophrenia the effects of which are particularly pronounced in integrative regions of the brain.
Acknowledgments
We thank Dr. Francine Benes for her helpful comments and encouragement throughout the course of this study. We also thank Rhonda Belue, Kara Pratt, Dr. Dan Savage, Dr. Steve Matthysse, and Dr. Betty Skipper for their help with the analysis of the data. This work was supported in part by National Institutes of Health Grants HD-24236 (R.L.N.), MH-31862 (E.D.B), EY-05690 (L.I.B.), GM-08139, and NS-30255 (N.I.P.-B.), a grant from the Scottish Rite Schizophrenia Research Program (L.I.B. and N.I.P.-B.), and by Dedicated Health Research Funds from the University of New Mexico School of Medicine (N.I.P.-B.).
Footnotes
The publication costs of this article were defrayed in part by page charge payment. This article must therefore be hereby marked “advertisement” in accordance with 18 U.S.C. §1734 solely to indicate this fact.
Abbreviations: GFAP, glial fibrillary acidic protein; PMI, postmortem interval; SPM, synaptosomal plasma membrane; Ax, Brodmann’s area x.
References
- 1.Shelton R, Weinberger D R. In: Psychopharmacology: The Third Generation of Progress. Meltzer H, editor. New York: Raven; 1987. pp. 773–781. [Google Scholar]
- 2.Pakkenberg B. Br J Psychiatry. 1987;151:744–752. doi: 10.1192/bjp.151.6.744. [DOI] [PubMed] [Google Scholar]
- 3.Benes F M. Schizophr Bull. 1993;19:537–549. doi: 10.1093/schbul/19.3.537. [DOI] [PubMed] [Google Scholar]
- 4.Bloom F E. Arch Gen Psychiatry. 1993;50:224–227. doi: 10.1001/archpsyc.1993.01820150074008. [DOI] [PubMed] [Google Scholar]
- 5.Benes F M, Davison J, Bird E D. Arch Gen Psychiatry. 1986;43:31–35. doi: 10.1001/archpsyc.1986.01800010033004. [DOI] [PubMed] [Google Scholar]
- 6.Benes F M, Bird E D. Arch Gen Psychiatry. 1987;44:608–616. doi: 10.1001/archpsyc.1987.01800190024004. [DOI] [PubMed] [Google Scholar]
- 7.Benes F M, McSparren J, San-Giovanni J P, Vincent S L. Arch Gen Psychiatry. 1991;48:996–1001. doi: 10.1001/archpsyc.1991.01810350036005. [DOI] [PubMed] [Google Scholar]
- 8.Falkai P, Bogerts B. Eur Arch Psychiatry Neurol Sci. 1986;236:154–161. doi: 10.1007/BF00380943. [DOI] [PubMed] [Google Scholar]
- 9.Falkai P, Bogerts B, Rozumek M. Biol Psychiatry. 1988;24:515–521. doi: 10.1016/0006-3223(88)90162-x. [DOI] [PubMed] [Google Scholar]
- 10.Feinberg I. J Psychiatr Res. 1982/83;17:319–334. doi: 10.1016/0022-3956(82)90038-3. [DOI] [PubMed] [Google Scholar]
- 11.Kovelman J A, Scheibe A B. Biol Psychiatry. 1984;19:1601–1621. [PubMed] [Google Scholar]
- 12.Haracz J L. Schizophr Bull. 1985;11:191–229. doi: 10.1093/schbul/11.2.191. [DOI] [PubMed] [Google Scholar]
- 13.Jakob H, Beckmann H. J Neural Transm. 1986;85:303–326. doi: 10.1007/BF01249090. [DOI] [PubMed] [Google Scholar]
- 14.Murray R M, Lewis S W. Br Med J. 1987;95:681–682. doi: 10.1136/bmj.295.6600.681. [DOI] [PMC free article] [PubMed] [Google Scholar]
- 15.Weinberger D R. Arch Gen Psychiatry. 1987;44:660–669. doi: 10.1001/archpsyc.1987.01800190080012. [DOI] [PubMed] [Google Scholar]
- 16.Roberts G W. Trends Neurosci. 1990;13:207–211. doi: 10.1016/0166-2236(90)90161-3. [DOI] [PubMed] [Google Scholar]
- 17.Benes F M. In: Developmental Psychopathology. Cichetti D, editor. Hillsdale, NJ: Lawrence Erlbaum Associates; 1991. pp. 161–184. [Google Scholar]
- 18.Benowitz L I, Routtenberg A. Trends Neurosci. 1987;1:527–532. [Google Scholar]
- 19.Skene J H P. Annu Rev Neurosci. 1989;12:127–156. doi: 10.1146/annurev.ne.12.030189.001015. [DOI] [PubMed] [Google Scholar]
- 20.Jacobson R D, Virag I, Skene J H P. J Neurosci. 1986;6:1843–1855. doi: 10.1523/JNEUROSCI.06-06-01843.1986. [DOI] [PMC free article] [PubMed] [Google Scholar]
- 21.Neve R L, Perrone-Bizzozero N I, Finklestein S, Zwiers H, Bird E, Kurnit D, Benowitz L I. Mol Brain Res. 1987;2:177–183. doi: 10.1016/s0006-8993(87)80012-4. [DOI] [PubMed] [Google Scholar]
- 22.Neve R L, Finch E A, Bird E D, Benowitz L I. Proc Natl Acad Sci USA. 1988;85:3638–3642. doi: 10.1073/pnas.85.10.3638. [DOI] [PMC free article] [PubMed] [Google Scholar]
- 23.Benowitz L I, Perrone-Bizzozero N I, Finklestein S P, Bird E D. J Neurosci. 1989;9:990–995. doi: 10.1523/JNEUROSCI.09-03-00990.1989. [DOI] [PMC free article] [PubMed] [Google Scholar]
- 24.Nelson R B, Friedman D P, O’Neil J B, Mishkin M, Routtenberg A. Brain Res. 1987;416:387–392. doi: 10.1016/0006-8993(87)90924-3. [DOI] [PubMed] [Google Scholar]
- 25.Akers R F, Routtenberg A. Brain Res. 1985;334:147–151. doi: 10.1016/0006-8993(85)90576-1. [DOI] [PubMed] [Google Scholar]
- 26.Lovinger D M, Akers F F, Nelson R B, Barnes C A, McNaughton G L, Routtenberg A. Brain Res. 1985;343:137–143. doi: 10.1016/0006-8993(85)91167-9. [DOI] [PubMed] [Google Scholar]
- 27.Feighner J P, Robins E, Guze S B. Arch Gen Psychiatry. 1972;26:57–63. doi: 10.1001/archpsyc.1972.01750190059011. [DOI] [PubMed] [Google Scholar]
- 28.Sower A C, Bird E D, Perrone-Bizzozero N I. Mol Chem Neuropathol. 1995;24:1–11. doi: 10.1007/BF03160108. [DOI] [PubMed] [Google Scholar]
- 29.Karson C N, Cassanova M, Kleiman J E, Griffin W S T. Am J Psychiatry. 1993;150:454–459. doi: 10.1176/ajp.150.3.454. [DOI] [PubMed] [Google Scholar]
- 30.Dean B, Opeski K, Pavey G, Naylor L, Hill C, Keks N, Copolov D L. J Neurochem. 1995;64:1197–1202. doi: 10.1046/j.1471-4159.1995.64031197.x. [DOI] [PubMed] [Google Scholar]
- 31.Perrone-Bizzozero N I, Weiner D, Hauser G, Benowitz L I. J Neurosci Res. 1988;20:346–350. doi: 10.1002/jnr.490200308. [DOI] [PubMed] [Google Scholar]
- 32.Bradford M. Anal Biochem. 1976;72:248–254. doi: 10.1016/0003-2697(76)90527-3. [DOI] [PubMed] [Google Scholar]
- 33.Laemmli U K. Nature (London) 1970;227:680–685. doi: 10.1038/227680a0. [DOI] [PubMed] [Google Scholar]
- 34.Towbin J, Staehelin T, Gordon J. Proc Natl Acad Sci USA. 1979;76:4350–4354. doi: 10.1073/pnas.76.9.4350. [DOI] [PMC free article] [PubMed] [Google Scholar]
- 35.Benowitz L I, Apostolides P J, Perrone-Bizzozero N I, Finklestein S P, Zwiers H. J Neurosci. 1988;8:339–352. doi: 10.1523/JNEUROSCI.08-01-00339.1988. [DOI] [PMC free article] [PubMed] [Google Scholar]
- 36.Masliah E, Terry R D, Alford M, DeTeresa R. J Histochem Cytochem. 1990;38:837–844. doi: 10.1177/38.6.2110586. [DOI] [PubMed] [Google Scholar]
- 37.Eastwood S L, Harrison P J. Neuroscience. 1995;69:339–343. doi: 10.1016/0306-4522(95)00324-c. [DOI] [PubMed] [Google Scholar]
- 38.Roberts G W, Colter N, Lofthouse R, Johnstone E, Crow T J. Biol Psychiatry. 1987;22:1459–1468. doi: 10.1016/0006-3223(87)90104-1. [DOI] [PubMed] [Google Scholar]
- 39.Winn P. Trends Neurosci. 1994;17:265–268. doi: 10.1016/0166-2236(94)90054-x. [DOI] [PubMed] [Google Scholar]
- 40.Glantz L A, Lewis D A. Soc Neurosci Abstr. 1994;20:622. [Google Scholar]
- 41.Alder J, Kanki H, Valtorta F, Greengard P, Poo M-m. J Neurosci. 1995;15:511–519. doi: 10.1523/JNEUROSCI.15-01-00511.1995. [DOI] [PMC free article] [PubMed] [Google Scholar]
- 42.Dekker L V, De Grann P N E, Oestreicher A B, Versteeg D H G, Gispen W H. Nature (London) 1989;342:74–76. doi: 10.1038/342074a0. [DOI] [PubMed] [Google Scholar]
- 43.Dekker L V, De Graan P N E, De Wit M, Hens J J H, Gispen W H. J Neurochem. 1990;54:1645–1652. doi: 10.1111/j.1471-4159.1990.tb01217.x. [DOI] [PubMed] [Google Scholar]
- 44.Ivins K J, Neve K A, Feller D J, Fidel S A, Neve R L. J Neurochem. 1993;60:626–633. doi: 10.1111/j.1471-4159.1993.tb03194.x. [DOI] [PubMed] [Google Scholar]
- 45.Tohyama T, Lee V M-Y, Rorke L B, Trojanowski J Comp Neurol. 1991;310:285–299. doi: 10.1002/cne.903100302. [DOI] [PubMed] [Google Scholar]
- 46.Arnold S E, Lee V M, Gur R E, Trojanowski J Q. Proc Natl Acad Sci USA. 1991;88:10850–10854. doi: 10.1073/pnas.88.23.10850. [DOI] [PMC free article] [PubMed] [Google Scholar]
- 47.Browning M D, Durek E M, Rapier J L, Leonard S, Freedman R. Biol Psychiatry. 1993;34:529–535. doi: 10.1016/0006-3223(93)90195-j. [DOI] [PubMed] [Google Scholar]
- 48.Barbeau D, Liang J J, Robitaille Y, Quirion R, Srivastava L K. Proc Natl Acad Sci USA. 1995;92:2785–2789. doi: 10.1073/pnas.92.7.2785. [DOI] [PMC free article] [PubMed] [Google Scholar]
- 49.Benowitz L I, Perrone-Bizzozero N I. Progr Brain Res. 1991;89:69–87. doi: 10.1016/s0079-6123(08)61716-1. [DOI] [PubMed] [Google Scholar]
- 50.Neve R L, Bear M F. Proc Natl Acad Sci USA. 1989;86:4781–4784. doi: 10.1073/pnas.86.12.4781. [DOI] [PMC free article] [PubMed] [Google Scholar]
- 51.Benes F M, Majocha R, Bird E D, Marrotta C A. Arch Gen Psychiatry. 1987;44:1017–1021. doi: 10.1001/archpsyc.1987.01800230097015. [DOI] [PubMed] [Google Scholar]


