

Abstract
Viruses employ various modes to evade immune detection. Two possible evasion modes are a reduction of the number of epitopes presented and the mimicry of host epitopes. The immune evasion efforts are not uniform among viral proteins. The number of epitopes in a given viral protein and the similarity of the epitopes to host peptides can be used as a measure of the viral attempts to hide this protein. Using bioinformatics tools, we here present a genomic analysis of the attempts of four human herpesviruses (herpes simplex virus type 1-human herpesvirus 1, Epstein-Barr virus-human herpesvirus 4, human cytomegalovirus-human herpesvirus 5, and Kaposi's sarcoma-associated herpesvirus-human herpesvirus 8) and one murine herpesvirus (murine herpesvirus 68) to escape from immune detection. We determined the full repertoire of CD8 T-lymphocyte epitopes presented by each viral protein and show that herpesvirus proteins present many fewer epitopes than expected. Furthermore, the epitopes that are presented are more similar to host epitopes than are random viral epitopes, minimizing the immune response. We defined a score for the size of the immune repertoire (the SIR score) based on the number of epitopes in a protein. The numbers of epitopes in proteins expressed in the latent and early phases of infection were significantly smaller than those in proteins expressed in the lytic phase in all tested viruses. The latent and immediate-early epitopes were also more similar to host epitopes than were lytic epitopes. A clear trend emerged from the analysis. In general, herpesviruses demonstrated an effort to evade immune detection. However, within a given herpesvirus, proteins expressed in phases critical to the fate of infection (e.g., early lytic and latent) evaded immune detection more than all others. The application of the SIR score to specific proteins allows us to quantify the importance of immune evasion and to detect optimal targets for immunotherapy and vaccine development.
One of the immune system's main roles is the protection of its host against pathogens, including viruses. Viruses have developed a large array of methods to minimize their exposure to the immune system, such as major histocompatibility complex (MHC) down-regulation (16) and antigen mutation (17). The destruction of virally infected cells is mediated by CD8 T lymphocytes (CTLs). Through their T-cell receptors, CTLs recognize viral peptides presented in the context of MHC class I (MHC-I) molecules (41, 43). In general, CTL epitopes originate from short peptides cleaved by the proteasome (38) that can associate noncovalently with the grooves of MHC-I molecules. A cleaved nonamer is presented on an MHC-I molecule only if its affinity for the MHC molecule is high enough. This affinity is determined by the peptide's length and by its anchor and helping residues. In recent years, the anchor residues for many human MHC-I alleles have been determined experimentally (25, 36). The progression of a viral infection and the immune response against it can be schematized by the following stages. Viral particles infect a host cell. Once the viral genetic material is inserted into the host cell, the virus uses the cell machinery and starts producing viral proteins. Peptides from these proteins are cleaved and eventually presented on host MHC-I molecules. Clonally expanding CTLs recognize these peptides and deliver apoptotic signals to the infected cells. A virus can propagate only if it manages to complete virus assembly and to infect other cells before its own host cell undergoes apoptosis. However, for some viruses, such as herpesviruses, the viral infection may lead to a long-lasting latent phase.
Three approaches are often used by viruses to evade the immune system's pressure: (i) an evolutionary reduction in the number of epitopes (10), (ii) the mimicry of host epitopes (4), and (iii) mutations of epitopes evoking an immune response within a specific host (3, 10, 27). Over the long term, the last mechanism can induce the first two if viruses are transmitted to new hosts after a continuous long internal evolution (e.g., in mother-to-child transmission of human immunodeficiency virus [39]). The efficacy of the immune response against different viral proteins can vary. Some proteins may be expressed very early and induce a rapid immune response that can stop the viral infection in its first stages, before the virus has had any chance of propagating. One can thus define the intensity of the immune pressure felt by a viral protein as the expected probability of CTL-mediated lysis of the host cell if this protein is exposed. The use of all three evasion methods is expected to arise as a function of immune pressure. The number of CTL epitopes, their similarity to host peptides, and the number of mutations they accumulate are thus candidates for tools to measure this immune pressure. The accumulation of genomic data and a combination of bioinformatics tools have allowed us now, for the first time, to measure these three effects and assess the immune pressure on different proteins. We used these measures in the context of viruses from the Herpesviridae family. We show a clear distinction between the extents of the immune pressure felt by the viruses at the different phases of infection.
The Herpesviridae are a large family of double-stranded DNA viruses that infect a wide range of hosts. Based on biological characteristics, the herpesviruses are classified into three major subfamilies (alpha-, beta-, and gammaherpesviruses), and eight herpesviruses belonging to different subfamilies have been identified as having humans as their primary host. With the exceptions of Kaposi's sarcoma-associated herpesvirus (KSHV) and herpes simplex virus type 2 (HSV-2), the human herpesviruses are ubiquitous, and infections with these viruses are common worldwide. The herpesvirus genome is 120 to 250 kbp, comprising dozens of genes and several microRNAs. Within all characterized herpesvirus genomes, there are conserved regions that code mainly for structural proteins and replication enzymes and are more conserved among members of the same subfamily than among subfamilies.
Herpesviruses exhibit two divergent phases of infection: lytic (productive) and latent (nonproductive), characterized by distinct patterns of viral gene expression.
Extensive viral gene expression characterizes productive infection, which culminates in virus production and release along with cell lysis and death. In contrast, only a few viral genes are expressed and no viral progeny are produced during the latent phase, in which the virus genome is maintained as a circular episome in the host cell (19). Several physiological conditions may induce the reactivation of a hidden virus, switching the latent infection into a lytic infection. In fact, primary host infection with herpesvirus leads to lifelong latent infection with periodic reactivation of the virus. This unique life cycle of the Herpesviridae family makes these viruses ideal for testing the relationship between the number of epitopes and the immune pressure.
A limited set of viral genes that enable the virus to replicate are expressed during the latent infection phase of gammaherpesviruses, while in the alphaherpesvirus subfamily, there are no latent proteins but there are latent RNA transcripts (19). Latency of the betaherpesvirus subfamily is less understood and appears to rely on host gene control and host differentiation signals. The production of the virus depends on another cascade that classifies the viral genes into three major groups according to their respective expression patterns: immediate early (IE), early, and late. The IE genes encode proteins that are expressed first and are regulatory in nature. These proteins control the expression of viral and cellular genes and are critical in the determination of whether the infection will be abortive or productive (12). Therefore, it is expected that over evolutionary periods the virus will minimize the exposure of these proteins to the immune system.
We hypothesized that the destruction of the virus during latent or productive infection would prevent further virus infection and dissemination. We expected to observe reduced exposure of viral proteins expressed during the latent phase of the infection. We investigated the number of epitopes expressed by each viral protein and defined a score representing the immune pressure. Here, we focus on four human herpesviruses and one murine herpesvirus: one virus from the alphaherpesvirus subgroup (HSV-1-human herpesvirus 1 [HHV-1]), one virus from the betaherpesvirus subgroup (human cytomegalovirus [HCMV]-HHV-5), and three viruses from the gammaherpesvirus subgroup (Epstein-Barr virus [EBV]-HHV-4, KSHV-HHV-8, and the murine gammaherpesvirus 68 [MHV-68]).
MATERIALS AND METHODS
Genomic data.
Viral and human protein sequences were used for this analysis. Human gene sequences were obtained from the Ensembl database (8), and all the predicted protein-encoding regions were used to deduce the protein sequences. In the present analysis, we ignored the effects of point mutations. The herpesviruses sequences were obtained from the NCBI database (http://www.ncbi.nlm.nih.gov/). We examined four human herpesviruses, HSV-1-HHV-1, EBV-HHV-4, HCMV-HHV-5, and KSHV-HHV-8. We also examined as an independent control the results for one mouse gammaherpesvirus, MHV-68. The proteins of each of the viruses were divided into groups (Table 1).
TABLE 1.
Functional groups of proteins of each virusa
| Virus | Protein groups corresponding to phases of infection (reference[s]) | Protein groups corresponding to levels of conservation (reference) |
|---|---|---|
| HSV-1 | IE, early, late (19) | |
| EBV | Latent, IE, lytic (19, 34) | |
| HCMV | IE, early, late (21) | Core, noncore (19) |
| KSHV | Latent, IE, lytic (12) | Conserved, unique (12) |
| MHV-68 | Latent, IE, lytic (13, 26) |
The proteins of most viruses (KSHV, EBV, and MHV-68) were divided into latent, IE, and lytic proteins. HSV-1 has no latent proteins (only RNA transcripts), and for CMV, we had no clear data about the classification of latent proteins. The proteins of these viruses were classified as IE and lytic proteins.
The HSV-1 strain used comprised the complete genome of HHV-1 strain 17 (Refseq, NC_001806; GenBank accession no. X14112). The EBV strain used included the complete wild-type genome of HHV-4 (type 1) strain B95-8 (Raji; Refseq, NC_007605; GenBank accession no. AJ507799). The HCMV strain used carried the complete genome of the HHV-5 laboratory strain AD169 (Refseq, NC_001347; GenBank accession no. BK000394). The KSHV strain used comprised the complete genome of HHV-8 (type P) isolate GK18 (Refseq, NC_009333; GenBank accession no. AF148805). The MHV-68 strain used had the complete genome of murid herpesvirus 4 (MHV-68) strain WUMS (Refseq, NC_001826; GenBank accession no. U97553).
Cleavage score.
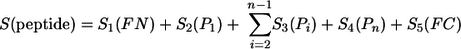
Given a peptide with N- and C-terminal flanking regions FN and FC and residues P1, … Pi, … Pn, where Pi represents any residue 1, and n represents C and N positions, the following score was defined:
 |
A peptide with a high score, S, has a high probability of being produced, while a low score corresponds to a low probability of production. The appropriate values for S1 to S5 were learned using a simulated annealing process (18). Two learning sets were used. The positive learning set (containing 645 peptides) was composed of peptides observed to be produced in a variety of cleavage experiments. The negative learning set (containing 560 peptides) was composed of peptides observed to be either cleaved in their center or not cleaved at their extremities in the same cleavage experiments. Extra subunits are added to the proteasome in the presence of gamma interferon, changing its cleavage properties. Since our main interest was in the production of peptides presented on MHC-I molecules, we incorporated results from both the standard and so-called immunoproteasome into our analysis. The algorithm was validated to give a rate of false positives of less than 16% and a rate of false negatives of less than 10% (22). A detailed description of the data used for the cleavage analysis can be found in the supplemental material.
TAP binding frequency.
The probability that a peptide binds the transporter associated with antigen processing (TAP) machinery is mainly a function of the residues at the first N-terminal and the last three C-terminal positions. Moreover, this probability can be estimated through a linear combination of the binding energies of the residues. Multiple algorithms for TAP binding frequency were checked. The score computed by Peters et al. (33) gave the best differentiation between presented and random peptides (23).
MHC binding motifs.
Each protein was divided into all possible nonamers by using a sliding window (e.g., a 300-amino-acid protein was divided into 292 nonamers, positions 1 to 9, positions 2 to 10, and so on). For each nonamer, we computed the MHC binding energies of 31 different class I human leukocyte antigen (HLA) molecules, most of them HLA-A and HLA-B. The affinity of a candidate peptide for each HLA molecule was estimated using the BIMAS software and the binding coefficients predicted by Parker (31; http://bimas.cit.nih.gov/). These matrices estimate the contribution of each amino acid at each position to the total binding strength. Anchor residues have a high level of contribution, while neutral residues have a value of 1. The overall binding strength is the product of the binding strengths of the amino acids at each of the nine positions. For the murine analysis (MHV-68), the same approach with six mouse MHC-I molecules was used.
HLA allele frequency and weighted average.
The HLA locus has the highest level of polymorphism among all human loci (30). MHC-peptide binding prediction algorithms are specific for each HLA allele. There are presently 282 known HLA-A alleles, 537 known HLA-B alleles, and 135 HLA-C alleles (37). Most individuals are heterozygous for HLA-A, HLA-B, and HLA-C and express three different heterozygous MHC-I molecules. Different MHC-I molecules have different racial distributions (44).
We considered the repertoires corresponding to 31 alleles to maximize the population coverage (in order to determine the average distribution frequencies of human HLA alleles). We used 9 HLA-A (frequency, 60.2%), 19 HLA-B (frequency, 44.2%), and 3 HLA-C (frequency, 31.2%) alleles. To identify the properties of the repertoire in a given population, we used scores for the size of the immune repertoire (the SIR scores) corresponding to the available HLA alleles and calculated the average of scores weighted based on the HLA allele frequencies in this population (37). The averages for HLA-A, HLA-B, and HLA-C alleles were calculated separately, and the weighted score for the HLA-A, HLA-B, and HLA-C alleles was averaged with the mean score determined when the scores for the alleles were given equal weights.
Validation.
To validate our results, we checked the scores of peptides listed in six different databases: SYFPEITHI (35; http://www.syfpeithi.de), MHCBN (7; http://www.imtech.res.in/raghava/mhcbn/), MPID (15), MHCPEP (11; http://www3.oup.co.uk/nar/database/), AntiJen (9, 28; http://www.jenner.ac.uk/AntiJen/), and HLALigand (40). Assuming that most peptide sequences in the various databases are correct, we computed the threshold that would maximize the number of presented peptides from the positive databases and minimize the number of peptides from a set of 50,000 neutral peptides with the amino acid distribution reflected in the NCBI database (http://prowl.rockefeller.edu/aainfo/contents.htm). For each HLA allele, we checked the levels of type I and type II errors (e.g., for allele B*5101, see Fig. 1) and attempted to find a cutoff minimizing both types. For most alleles, we found cutoffs reducing the rates of both types of errors to less than 10% (i.e., resulting in the inclusion of 90% of the presented peptides and the exclusion of 90% of the random peptides).
FIG. 1.

B*5101 MHC binding prediction validation. The upper diagram shows a comparison between the scores predicted by the BIMAS algorithm for experimentally measured peptides and random peptides. The cutoff presented in the diagram corresponds to the inclusion of 90% of the presented peptides and the exclusion of 90% of the random peptides. The left curve represents the distribution of the scores for random peptides, and the right curves represent the distributions of scores for presented peptides. As can be seen, even for this extreme threshold (taking into account the large number of false positives in existing databases), there is a clear distinction between the upper cutoff for random peptides and the lower cutoff for experimentally observed peptides (this is true for the vast majority of alleles). The lower diagram represents the fractions of false positives (pos.) and false negatives (neg.) for all cutoffs. The optimal cutoff was designed as the one minimizing both false positives and false negatives. Note that the MHC binding prediction method used was not based on the peptides present in the databases. Thus, the validation and training sets are independent.
Similarity to host peptides.
The similarity of each viral peptide to a human expressed peptide was computed as the minimal distance between the viral peptide and any human epitope corresponding to the same HLA allele. The distance was measured in amino acid substitutions. The minimal distance was obviously 0 (full similarity). A distance of 4 or more was considered a distance of 4. For example, the similarity of the HHV-1 rs1 HLA-A*0101 epitope PADGPAVSR to a human peptide was determined by comparing this epitope to all human HLA-A*0101 epitopes. If the same epitope was found in the human epitope list, its similarity to a host epitope would be set at 0. If the epitope itself was not present but the same epitope with a single mutation (e.g., PADKPAVSR, where the mutated amino acid is underlined) was found in the human epitope list, the distance would be set at 1. If no epitope with a distance of 1 was found in the human epitope list, we looked for epitopes with a distance of 2 (e.g., PAEGPAHSR). The same procedure was repeated for the identification of epitopes with a distance of 3. If no epitope with a distance of 3 or less was found in the human epitope list, the similarity of PADGPAVSR to a host epitope was set at 4.
In order to optimize the comparison process, we first created 31 lists, one for each allele in the analysis. Each list included the full repertoire of human epitopes expressed by the allele as computed from 33,869 human proteins corresponding to the appropriate allele. We then compared each viral epitope to the human epitope list for the appropriate allele.
We avoided checking each viral epitope against each human epitope by arranging all human epitopes (for a single allele) into trees based on all possible contiguous amino acid triplets. There were seven such trees, representing the seven possible sequential triplets of amino acids of each epitope. For example, the epitope ECAGKAHMF would be in the position ECA in the first tree, in the position CAG in the second tree, etc., and in the HMF position in the seventh tree (i.e., H at the first level of the tree, M at the second level, and F at the third). A couple of nonamers are similar in at least six positions if they either have three consecutive identical amino acids or have identical amino acids at one of the following triplets of positions: 3, 6, and 9; 1, 2, and 4; or 1, 2, and 5. We thus created three more trees for these triplets. For example, the ECAGKAHMF epitope would be in the AAF position of the 3-6-9 tree. For each viral epitope, we scanned all human epitopes at the appropriate positions in all trees and computed the distance between the human and the viral epitopes (1, 2, or 3). All viral epitopes with no human counterpart in any of the trees was defined as having a distance of 4. Note that there are many possible combinations of trees that would cover all possible nonamers with a distance of 3 or less.
Conservation.
Conservation was computed through a comparison of all available sequences for a given gene with the consensus sequence of the same gene. A conservation score was computed only for genes with at least three different sequences. The conservation score at each position was defined to be the fraction of sequences similar to the consensus at this position. The conservation score of a nonamer was defined as the minimal conservation score over the nine positions.
RESULTS
Using bioinformatics tools, we have determined all the presented CTL epitopes of herpesviruses and of human proteins and have compared the numbers of epitopes presented among different proteins. We defined CTL epitopes as nonamers fulfilling three conditions: (i) presentation in the context of MHC-I, (ii) production through proteasomal cleavage of endogenous proteins (in other words, a given peptide can potentially be presented if its extreme and flanking residues enhance proteasomal cleavage and it is not cleaved in its center), and (iii) transport through the TAP machinery to the endoplasmic reticulum. We have used algorithms (22, 31, 33; http://bimas.cit.nih.gov/) to predict all peptides within a protein successfully meeting all these criteria. These algorithms were systematically applied to all nonamers within each protein. A small fraction of the epitopes are transported through a TAP-independent pathway. We ignored those epitopes, since they do not contribute significantly to the statistics. We also ignored octamers and decamers for the same reason. Each MHC molecule has a different peptide binding motif. In this analysis, MHC polymorphism was considered. Human MHC-I molecules are encoded by HLA-A, HLA-B, and HLA-C genes. We estimated the number of epitopes from viral proteins corresponding to 9, 19, and 3 of the most common HLA-A, HLA-B, and HLA-C alleles, respectively, encoding molecules whose binding motifs are well defined. All algorithms used here were validated using a quality assurance process with six different databases of epitopes experimentally determined to be presented. The validation process ensured that the error levels were very low and rarely passed 10% (Fig. 1).
A measure of the attempts of the virus to evade detection and thus of the immune pressure on a given virus or a viral protein is the ratio between the number of epitopes in the protein and the number of epitopes in a random sequence of equal length. We have defined the SIR score as the ratio of the number of expected CTL epitopes to the number of epitopes expected within a sequence consisting of the same number of random nonamers with a similar amino acid distribution. For example, assume a sequence of 300 amino acids containing four HLA-A*0201 epitopes. If a set of 300 random amino acids with a distribution similar to that of the first sequence is expected to have 10 HLA-A*0201 epitopes, the SIR score of the sequence for HLA-A*0201 would be 0.4. The SIR score of a protein in a population is defined as the average of the SIR scores for all HLA alleles, weighted by the frequency of the HLA alleles in this population. The amino acid distribution used for the random peptides represents the average amino acid usage in sequences in the NCBI database (http://prowl.rockefeller.edu/aainfo/contents.htm) and not specifically a herpesvirus amino acid distribution.
We computed the epitope repertoires of four different human herpesviruses (HSV-1, EBV, HCMV, and KSHV) and one murine herpesvirus (MHV-68). The human repertoire was determined using human HLA alleles, while the mouse repertoire was determined based on mouse H-2 alleles. From the repertoire, the SIR score of each protein from each virus was computed. The first striking result was that the average SIR score for all human herpesviruses was significantly lower than 1 (P, <1e−10 for all four herpesviruses). The SIR score of a complete virus was defined as the average of the numbers of epitopes in the virus for all HLA alleles, weighted based on the frequencies of the alleles, divided by the number of epitopes expected in the number of random peptides equal to the number of viral proteins (Fig. 2). The frequencies of the mouse alleles are unknown, so the SIR score was computed for each allele. For most HLA alleles tested (except the H-2Kd allele), the SIR score was lower than 1 or approximately 1. The low SIR scores were consistent across all the human herpesviruses tested, while the average SIR score for all the fully sequenced viruses presently included in the NCBI data bank (http://www.ncbi.nlm.nih.gov/) (approximately 1,200 viruses, listed in the supplemental material) was close to 1. This low SIR score is a direct result of the evolution of the attempts of viruses to evade detection by the immune system. The low SIR score was actually surprising, since there is significant pressure on the immune system itself to adapt to viruses through the high level of HLA locus polymorphism. The low SIR score shows that the pressure on the herpesviruses to evade immune detection is much stronger than the pressure on the immune system to detect herpesviruses. A plausible explanation is the low level of pathogenicity of herpesviruses. Even a productive infection with a herpesvirus is not fatal in immunocompetent hosts. We have computed the SIR scores of a large set of randomly chosen nonhuman viruses (including nonhuman herpesviruses). For these viruses, the SIR scores were indeed distributed around 1. Furthermore, the average SIR score of the 18 nonhuman herpesviruses tested (see Table S1 in the supplemental material) was higher than that of the human herpesviruses (0.95 versus 0.89). Thus, in the absence of immune pressure on the virus or viral pressure on the human population, the SIR score is approximately 1. If indeed the SIR score represents the balance between the evolutionary pressure on the virus to present fewer epitopes and the evolutionary pressure on the human MHC system to present more epitopes, we would expect viruses leading to an acute fatal infection to have high SIR scores. We calculated the SIR scores of lethal human viruses, such as Ebola and smallpox viruses, and indeed, their SIR scores were significantly higher than 1 (1.076 for Ebola virus and 1.303 for smallpox virus; P < 1.e−8.). Herpesviruses are not the only human viruses to have low SIR scores. Actually, many nonlethal human viruses have lower scores than herpesviruses (23). These low scores seem to highlight the fact that for nonlethal viruses the evolutionary pressure of the immune system on the viruses is stronger than the one the viruses effect on the distribution of MHC alleles in the human population.
FIG. 2.

Average SIR scores of latent, IE, and lytic proteins. Data for HSV-1, CMV, KSHV, and EBV are shown. Each column represents proteins highly expressed in a specific phase, the latent, IE, or lytic phase, or all the viral proteins, as indicated. Two asterisks represent a P value of less than 0.01. The latent proteins express fewer epitopes (per candidate nonamer) than the IE proteins (for KHSV, P is <0.001, while for the EBV, the difference is not statistically significant). Both the IE and the latent proteins express fewer epitopes than the lytic proteins (P < 0.001). The values are the average SIR scores for all HLA alleles weighted by the HLA allele frequency in the total human population.
Viruses can also evade immune detection by mimicking host peptides (5). Even if a viral epitope is presented, it will not evoke an immune response if it is very similar to a host epitope. We have computed the fraction of all HHV epitopes similar to at least one human epitope (differing by up to two amino acid substitutions) of the corresponding HLA. The average similarity for all known viral epitopes was approximately 1%. The similarity of presented human herpesvirus epitopes was approximately 13% (Fig. 3). This huge difference further reduces the number of epitopes that can evoke an immune response. Not only were herpesviruses determined to have many fewer epitopes than expected, but these epitopes were also significantly more similar to human epitopes (by a 20-fold factor) than expected. Note that this similarity may also be the simple result of the long coevolution of humans and herpesviruses. We cannot rule out this possibility. However, we here show that this level of similarity is specific to protein groups within the virus that reduce their epitope numbers.
FIG. 3.

Similarity of viral epitopes to host epitopes (self). Data for all the viruses are shown. Each column represents proteins highly expressed in a specific phase, the lytic, latent, or IE phase, or all the viral proteins, as indicated. The IE and the latent proteins are much more similar to the host epitopes than the lytic proteins (for HSV-1 and latent KHSV, P is <0.01 [marked with two asterisks]; for CMV and IE KHSV, P is <0.05 [marked with one asterisk]). There is no statistical difference between levels of similarity of proteins in the latent and IE groups to human epitopes.
A third way for herpesviruses to evade detection may be a higher mutation rate in epitopes than other sequences during evolution within the host. A high mutation rate would induce a high level of variability in herpesvirus sequences in different hosts at different times. We calculated the fraction of epitopes containing no mutations (in at least 90% of the sequences) and compared it to the fraction of conserved peptides (that are not epitopes) in the same proteins. We found no clear difference between the level of conservation of epitopes and random peptides. This result may suggest that mutations within a given strain are not a major way of evading detection. This possibility is in contrast with known results for human immunodeficiency virus (27) and influenza virus (14). This difference may be due to the inherent weakness of the conservation score, which may represent more the variability among hosts than the internal viral variability within a host. A second reason for the difference may be the limited numbers of gene sequences for many proteins.
Not all proteins sustain the same pressure. One may assume, for example, that latent proteins would undergo the most significant long-term evolution to evade detection. We looked for all latent proteins. The KSHV genome encodes more than 90 proteins. Of these proteins, 82 were classified into one of three groups (latent, IE, and lytic) based on the phase during which they are expressed (12). We expected the SIR scores of the latent proteins to be lower than those of all other proteins. The 77 EBV proteins were also divided into IE, latent, and lytic proteins (34). In HSV-1, there are only latent transcripts and no latent viral proteins are expressed. HCMV also has latent proteins, but a list of such proteins was not found. The HCMV genes were divided into lytic and IE genes. The SIR scores of the latent proteins in both KSHV and EBV were indeed significantly lower than the average SIR score for all proteins, while lytic proteins had higher-than-average SIR scores (Fig. 2). If a lower SIR score is indeed a measure of immune pressure, one would expect the fraction of latent-group epitopes similar to host epitopes to be higher also. This was indeed the case for both EBV and KSHV (Fig. 2). The escape from the immune system is thus accomplished using both a reduction in the number of epitopes and mimicry. The number of immunogenic epitopes is, however, still not reduced to zero. The remaining epitopes may either evoke no immune response or develop alternative evasion methods, such as MHC down-regulation and interference with the cleavage process (1, 2). Obviously, some epitopes are left, since many of the low-SIR-score proteins are actually very immunogenic. The low SIR score is not evidence of a low level of immunogenicity but of the fact that the virus attempts to hide the epitopes of the specific protein. The low score may actually indicate the opposite: the proteins that the virus would try to hide may be the most immunogenic proteins.
The virus is most sensitive to destruction by the cellular immune system when the virion number is small. This situation happens during latency, when there are no virions at all. Virions are also not present in the earliest phase of infection, during the expression of IE genes. The IE proteins are expressed during the initial infection, having mainly regulatory functions (although they are also required for genome replication). As in the case of the latent proteins, one would expect the SIR scores of the IE proteins to be low. We defined the IE proteins of HSV-1, EBV, HCMV, and KSHV. The SIR score of the IE proteins was indeed significantly lower than the SIR score of all proteins in the virus, which in turn was lower than the SIR score of lytic proteins (Fig. 2) (P < 1e−6). Similarly, the fraction of epitopes within the IE proteins that were similar to host epitopes was again higher (on average) than that within all other protein groups. The SIR score of IE proteins and their similarity to host epitopes were intermediate between those of the latent and all other lytic proteins, although for KSHV there was no statistical difference between the levels of similarity of latent and IE proteins to human epitopes. In the early phase of infection, when the stealth of the infection and viral population growth may be critical, it is probably important (from the virus point of view) to reduce host detection, but not as much as in the latent phase. In contrast with latent proteins, the IE proteins are expressed for a short period, since they are down-regulated by the early proteins. Thus, even if the IE epitopes are partially presented to the immune system, CTLs have limited time to use the IE epitopes in order to destroy the virally infected cells.
Thus, the clear hierarchy seems to be that latent proteins express the fewest epitopes (per candidate nonamer). IE proteins are next, and then all other lytic proteins. The SIR score was the average of scores for 31 common MHC-I alleles weighted according to allele frequency. The differences among the SIR scores of different groups were not the result of one or two extreme alleles but were observed for most HLA alleles (Fig. 4) and are thus consistent markers of this population of viruses. The consistent difference among HLA alleles and different herpesviruses is powerful evidence of the strong pressure of the immune system on the viruses.
FIG. 4.

SIR scores of different groups of KSHV proteins for all candidate HLA alleles. The x axis represents each of the alleles (31 alleles total). For each allele, there are three SIR scores (corresponding to latent, IE, and lytic proteins). For most HLA alleles, the same patterns of differences between the groups are observed, although for four HLA alleles, including HLA-A*3101, lytic proteins express fewer epitopes than latent ones.
The validity of these results was also tested with a murine virus. We tested the ratio between the SIR scores of lytic, latent, and IE proteins in MHV-68 (13, 26) for six different H-2 alleles. The viral model was quite different from that for the human herpesviruses, and the SIR score of MHV-68 was computed for mouse H-2 alleles and not human HLA alleles. Still, the SIR scores (averaged for all alleles with equal weights) of the IE and latent groups were similar to each other, and both were significantly lower than that of the lytic group (Fig. 5).
FIG. 5.

Average SIR scores of MHV-68 protein groups for five latent H-2 alleles. The alleles were given equal weights (since we had no data about their frequency in the population). The MHV-68 proteins were divided into IE, latent, and lytic proteins. The latent and IE proteins express much fewer epitopes than the lytic proteins. Note that in order to obtain a precise statistical estimate of the significance of the differences, the weighted average should be computed.
The comparison between the human and murine herpesviruses actually shows that the reduction in the epitope numbers is host specific. When the SIR score of MHV-68 for human MHC molecules or those of human herpesviruses for mouse MHC molecules were tested, the clear order among groups was lost. In general, IE proteins of human herpesviruses had high SIR scores for mouse MHC molecules, and latent proteins of MHV-68 had high SIR scores for human MHC molecules (see Fig. S1 in the supplemental material).
The main factor preventing herpesviruses from systematically mutating all their proteins is the need to maintain functional and structural elements. These elements can be detected by the comparison of proteins conserved among herpesviruses (either among subgroups or within a subgroup) and proteins specific for a single virus type. At the level of all herpesviruses, there is a known core set of approximately 40 open reading frames conserved in all mammalian and avian herpesviruses. We have compiled a list of proteins specific to KSHV and compared their SIR score to the SIR score of proteins conserved among the gammaherpesvirus subgroup. As expected, the score of specific proteins was lower than the score of conserved proteins (0.7915 versus 0.9323; P < 0.001). A similar result for HCMV was obtained. We divided HCMV proteins into core and noncore proteins. Again, the SIR score of the noncore proteins was lower (0.8285 versus 0.9159; P < 1e−7). The common open reading frames encode mainly replication functions which are essential for virus production. We postulate that there is a conservation pressure on these core sequences, limiting the reduction in the number of epitopes.
The average score, however, does not tell the full story. In order to understand the full repertoire, we made a histogram of the SIR score of each protein group and each herpesvirus considered in the present analysis. We here discuss the HCMV SIR score histogram (Fig. 6). Similar conclusions can be obtained for all other herpesviruses studied. The HCMV proteins were divided based on the phases of infection in which they are expressed (IE, early, and late proteins) (21) and the level of conservation among herpesviruses (i.e., core versus noncore proteins). The histogram showed that there was no difference between the different subgroups of the lytic population (early versus late) but that there was a clear distinction between the lytic proteins and the IE proteins. IE protein SIR scores were all less than 1, while the early and late proteins had SIR scores randomly distributed around 1. A similar distinction for core versus noncore proteins existed. The SIR scores for core proteins were distributed around 1, while the majority of SIR scores for unique proteins were lower than 1. Note that these distinctions are not deterministic. Some conserved and lytic proteins had very low SIR scores. We checked if these proteins had specific reasons to lower the number of presented epitopes. For KSHV and EBV, the lowest SIR scores obtained were those of latent proteins. The KSHV ORF73 protein is very significantly underpresented to the immune system (SIR score, 0.34634). ORF73 encodes latency-associated nuclear antigen 1, which is critical for the latent life cycle (20). This protein tethers the viral genome to the host chromosome and participates in the replication of the viral genome. In addition, it activates and represses transcription, it is an antiapoptotic protein, and it stimulates cellular transformation. This protein is indeed the most essential one in the latent phase. EBV nuclear antigen 1 has the lowest SIR score of the EBV proteins. It is known that the Gar domain of EBV nuclear antigen 1 prevents the cleavage of its own defective ribosomal products and thus facilitates the escape from recognition by CTLs (29). Some of the low SIR scores were those of lytic proteins, but these proteins were found to be mostly delayed early proteins, such as HSV-1 UL11 (24) and HCMV UL94 (45), and proteins expressed early postinfection, such as HSV-1 ICP34.5 (32). For most of the cases that we tested, the low-SIR-score proteins were expressed very early even if they were not tagged as IE proteins. There also were some proteins with surprisingly high SIR scores (see the supplemental material). We have not systematically studied them, since our main interest is in proteins trying to evade immune detection. Interesting examples in this context were HCMV US2 and US11 (6), which overpresent epitopes. These proteins are associated with MHC-I degradation and thus are not harmed by epitope overpresentation. Since MHC-I binding motifs are biased toward an increased viral epitope presentation (23), the lack of immune pressure can actually lead to epitope overpresentation.
FIG. 6.

SIR score distribution for each group of HCMV proteins. Two histograms are presented. The upper histogram represents the phases of infection (IE, early lytic, and late lytic). The lower inverted histogram represents conservation. The x axis represents the SIR score, and the y axis represents the fraction of proteins with this score. There was no difference between the different subgroups of the lytic population (early versus late), but there was a clear distinction between the lytic and the IE proteins. The IE SIR scores were all less than 1, while the early and the late lytic proteins had SIR scores randomly distributed around approximately 1. A similar distinction for core versus noncore proteins existed. The SIR scores of core proteins were distributed around 1, while the majority of SIR scores for unique proteins were lower than 1.
DISCUSSION
Viruses and the immune system play an intricate evolutionary game. Viruses attempt to evade immune detection, while the human population is constantly driven by epidemics of viral infections to use HLA alleles presenting virus epitopes. Viruses use a wide variety of immune evasion mechanisms, such as (among others) the down-regulation of MHC-I expression (16), mimicry (4), the down-regulation of CD1d surface expression (46), and the mutation of T-cell epitopes (10, 27). If the selective pressures on the viruses and the immune system are balanced, the numbers of epitopes from viruses and from random sequences presented on MHC molecules should be similar. An interesting test case is the Herpesviridae family. These viruses have a peculiar life cycle and a long history of evolution with humans (42). We can assume from the long coevolution that the immune system and the herpesviruses have reached a sort of equilibrium. The peculiar herpesvirus life cycle consisting of two critical phases (IE and latent) allows us to test our assumptions about the relationship between the epitope number and the effect of the immune system. There is strong pressure on the herpesviruses to reduce their epitope numbers, especially during their latent phase. The pressure on the human population selecting for HLA alleles that present herpesvirus epitopes is limited since herpesviruses are rarely lethal in immunocompetent hosts.
We have performed an immunomic analysis of the herpesvirus epitope immune system evasion repertoire by using a combination of bioinformatics methods and genomic data from four human herpesviruses (KSHV, EBV, CMV, and HSV-1) and one murine herpesvirus. Our analysis shows that all studied herpesviruses indeed reduce the number of MHC-I epitopes they present on human host cells.
We have defined a new score directly measuring the attempts of viruses to evade immune detection. For a given protein and genome, a library of all presented epitopes was devised. The size of the library was compared to the size of its counterpart for a random sequence of similar length. The size ratio was designated the SIR score.
The SIR scores of all herpesviruses studied in this analysis were lower than 1. In other words, the number of presented epitopes was significantly reduced compared to the number of expected epitopes. This finding is in clear contrast with results for viruses causing acute infections, such as Ebola and smallpox viruses, which show SIR scores higher than 1. A reduction in the number of presented epitopes can have crucial effects on the immune response, since the average number of epitopes is of the order of one per protein per HLA allele (23). A reduction in this number can simply prevent the immune system's detection of a given protein. Furthermore, the presented herpesviruses epitopes are much more similar to host epitopes than random viral epitopes are (13% similarity versus 1%). Thus, herpesviruses present fewer epitopes than expected, and among this limited number of epitopes, many would not induce an immune response. Note that a single epitope may theoretically induce an immune response. Thus, theoretically, as long as the SIR score is not 0, an immune response is possible. However, the immune response is a stochastic process. The viral effort to reduce the epitope number, accompanied by other immune evasion methods, is meant to reduce the probability that an infected cell will be destroyed to a level allowing some of the infected cells to produce virions or to become latent. Even if most cells are indeed destroyed, a small number of surviving infected cells can be enough to ensure a successful infection.
The herpesvirus life cycle allowed us to test the details of immune evasion. Proteins related to the latent and the IE phases had much lower scores than lytic proteins. Moreover, epitopes in latent and IE proteins were much more similar to human epitopes than were lytic ones. The escape from immune detection in the early phases of infection may be almost as important as the escape in the latent phase. The early presentation of an epitope may give the immune system enough time to kill the infected cell, before budding, while late destruction may not prevent budding and the infection of new cells. Moreover, abortive infection can lead directly to latency, so the destruction of cells during the IE phase may be the only way to avoid latency. The clear hierarchy among herpesvirus protein groups emerging from our analysis is that latent proteins express the fewest epitopes, followed by IE proteins, and only then come all lytic proteins. Our analysis of each herpesvirus was done independently, and the results were consistent for all the viruses. We also used the fraction of epitopes similar to human epitopes as a measure of immune evasion. The results obtained for similarity to host epitopes and the SIR scores were consistent for all groups. The consistent results are one more validation of the methodology and a proof that immune evasion is a multimodal process.
An important caveat is that the SIR score and the epitope similarity to host epitopes represent strictly the attempts of the virus to evade immune detection and not its success. Theoretically, even a single immunodominant epitope may be enough to induce CTL-mediated apoptosis of the host cell. Furthermore, not all epitopes in a given protein are similar, and the sheer number of epitopes does not reveal the full picture. Some of the epitopes are immunodominant, and those are the ones evoking the strongest immune response. A second important caveat is that the immunogenicity of a protein reflects a combination of the epitopes it presents on MHC-I molecules to CTLs and its expression level. Even epitopes with low affinities for an MHC-I molecule can be presented if the protein concentration in the cytoplasm is high enough. Thus, a low SIR score does not show that the protein is not immunogenic. It simply shows that the virus attempts to reduce its exposure.
Beyond its explanatory power, the SIR score has important applications. The detection of outliers in the distribution allows us to detect proteins that the virus tries to hide from the immune system. Their epitopes are optimal targets for immunotherapy or simply for vaccination. One can assume that if the viruses attempt to hide a protein from the immune system, the detection of this protein would maximize the immune impact. Thus, the SIR score can track the proteins important for immunotherapy even if their functions are not known. It can be used for any virus. The full list of epitopes for other viruses for any HLA alleles can be obtained from the PEPTIBASE server at http://peptibase.cs.biu.ac.il.
Supplementary Material
Acknowledgments
This work was supported by NIH grant 1 R01 AI61062-01. The work of T.V.-S. was also supported by a scholarship from the Yeshaia Hororwitz Foundation.
We thank Ronit Sarid for helpful comments.
Footnotes
Published ahead of print on 3 July 2007.
Supplemental material for this article may be found at http://jvi.asm.org/.
REFERENCES
- 1.Abendroth, A., and A. Arvin. 2001. Immune evasion mechanisms of varicella-zoster virus. Arch. Virol. Suppl. 2001:99-107. [DOI] [PubMed] [Google Scholar]
- 2.Abendroth, A., and A. Arvin. 1999. Varicella-zoster virus immune evasion. Immunol. Rev. 168:143-156. [DOI] [PubMed] [Google Scholar]
- 3.Aebischer, T., D. Moskophidis, U. H. Rohrer, R. M. Zinkernagel, and H. Hengartner. 1991. In vitro selection of lymphocytic choriomeningitis virus escape mutants by cytotoxic T lymphocytes. Proc. Natl. Acad. Sci. USA 88:11047-11051. [DOI] [PMC free article] [PubMed] [Google Scholar]
- 4.Alcami, A. 2003. Viral mimicry of cytokines, chemokines and their receptors. Nat. Rev. Immunol. 3:36-50. [DOI] [PubMed] [Google Scholar]
- 5.Banks, T. A., and B. T. Rouse. 1992. Herpesviruses: immune escape artists? Clin. Infect. Dis. 14:933-941. [DOI] [PubMed] [Google Scholar]
- 6.Barel, M. T., G. C. Hassink, S. van Voorden, and E. J. Wiertz. 2006. Human cytomegalovirus-encoded US2 and US11 target unassembled MHC class I heavy chains for degradation. Mol. Immunol. 43:1258-1266. [DOI] [PubMed] [Google Scholar]
- 7.Bhasin, M., H. Singh, and G. P. Raghava. 2003. MHCBN: a comprehensive database of MHC binding and non-binding peptides. Bioinformatics 19:665-666. [DOI] [PubMed] [Google Scholar]
- 8.Birney, E., T. D. Andrews, P. Bevan, M. Caccamo, Y. Chen, L. Clarke, G. Coates, J. Cuff, V. Curwen, T. Cutts, T. Down, E. Eyras, X. M. Fernandez-Suarez, P. Gane, B. Gibbins, J. Gilbert, M. Hammond, H. R. Hotz, V. Iyer, K. Jekosch, A. Kahari, A. Kasprzyk, D. Keefe, S. Keenan, H. Lehvaslaiho, G. McVicker, C. Melsopp, P. Meidl, E. Mongin, R. Pettett, S. Potter, G. Proctor, M. Rae, S. Searle, G. Slater, D. Smedley, J. Smith, W. Spooner, A. Stabenau, J. Stalker, R. Storey, A. Ureta-Vidal, K. C. Woodwark, G. Cameron, R. Durbin, A. Cox, T. Hubbard, M. Clamp, D. Andrews, T. Cox, H. Hotz, C. Woodwark, M. Egerton, R. Scollay, K. Shortman, L. Schlosstein, P. I. Terasaki, R. Bluestone, and C. M. Pearson. 2004. An overview of Ensembl. Genome Res. 14:925-928.15078858 [Google Scholar]
- 9.Blythe, M. J., I. A. Doytchinova, and D. R. Flower. 2002. JenPep: a database of quantitative functional peptide data for immunology. Bioinformatics 18:434-439. [DOI] [PubMed] [Google Scholar]
- 10.Bowen, D. G., and C. M. Walker. 2005. Mutational escape from CD8+ T cell immunity: HCV evolution, from chimpanzees to man. J. Exp. Med. 201:1709-1714. [DOI] [PMC free article] [PubMed] [Google Scholar]
- 11.Brusic, V., G. Rudy, and L. C. Harrison. 1998. MHCPEP, a database of MHC-binding peptides: update 1997. Nucleic Acids Res. 26:368-371. [DOI] [PMC free article] [PubMed] [Google Scholar]
- 12.Dourmishev, L. A., A. L. Dourmishev, D. Palmeri, R. A. Schwartz, and D. M. Lukac. 2003. Molecular genetics of Kaposi's sarcoma-associated herpesvirus (human herpesvirus 8) epidemiology and pathogenesis. Microbiol. Mol. Biol. Rev. 67:175-212. [DOI] [PMC free article] [PubMed] [Google Scholar]
- 13.Ebrahimi, B., B. M. Dutia, K. L. Roberts, J. J. Garcia-Ramirez, P. Dickinson, J. P. Stewart, P. Ghazal, D. J. Roy, and A. A. Nash. 2003. Transcriptome profile of murine gammaherpesvirus-68 lytic infection. J. Gen. Virol. 84:99-109. [DOI] [PubMed] [Google Scholar]
- 14.Ghedin, E., N. A. Sengamalay, M. Shumway, J. Zaborsky, T. Feldblyum, V. Subbu, D. J. Spiro, J. Sitz, H. Koo, P. Bolotov, D. Dernovoy, T. Tatusova, Y. Bao, K. St. George, J. Taylor, D. J. Lipman, C. M. Fraser, J. K. Taubenberger, and S. L. Salzberg. 2005. Large-scale sequencing of human influenza reveals the dynamic nature of viral genome evolution. Nature 437:1162-1166. [DOI] [PubMed] [Google Scholar]
- 15.Govindarajan, K. R., P. Kangueane, T. W. Tan, and S. Ranganathan. 2003. MPID: MHC-peptide interaction database for sequence-structure-function information on peptides binding to MHC molecules. Bioinformatics 19:309-310. [DOI] [PubMed] [Google Scholar]
- 16.Hilleman, M. R. 2004. Strategies and mechanisms for host and pathogen survival in acute and persistent viral infections. Proc. Natl. Acad. Sci. USA 101(Suppl. 2):14560-14566. [DOI] [PMC free article] [PubMed] [Google Scholar]
- 17.Kiepiela, P., A. J. Leslie, I. Honeyborne, D. Ramduth, C. Thobakgale, S. Chetty, P. Rathnavalu, C. Moore, K. J. Pfafferott, L. Hilton, P. Zimbwa, S. Moore, T. Allen, C. Brander, M. M. Addo, M. Altfeld, I. James, S. Mallal, M. Bunce, L. D. Barber, J. Szinger, C. Day, P. Klenerman, J. Mullins, B. Korber, H. M. Coovadia, B. D. Walker, and P. J. Goulder. 2004. Dominant influence of HLA-B in mediating the potential co-evolution of HIV and HLA. Nature 432:769-775. [DOI] [PubMed] [Google Scholar]
- 18.Kirkpatrick, S., C. D. Gelatt, and M. P. Vecchi. 1983. Optimization by simulated annealing. Science 220:671. [DOI] [PubMed] [Google Scholar]
- 19.Knipe, D. M., P. M. Howley, D. E. Griffin, R. A. Lamb, M. A. Martin, B. Roizman, and S. E. Straus (ed.). 2001. Fields virology, 4th ed. Lippincott Williams & Wilkins, Philadelphia, PA.
- 20.Krishnan, H. H., P. P. Naranatt, M. S. Smith, L. Zeng, C. Bloomer, and B. Chandran. 2004. Concurrent expression of latent and a limited number of lytic genes with immune modulation and antiapoptotic function by Kaposi's sarcoma-associated herpesvirus early during infection of primary endothelial and fibroblast cells and subsequent decline of lytic gene expression. J. Virol. 78:3601-3620. [DOI] [PMC free article] [PubMed] [Google Scholar]
- 21.Landolfo, S., M. Gariglio, G. Gribaudo, and D. Lembo. 2003. The human cytomegalovirus. Pharmacol. Ther. 98:269-297. [DOI] [PubMed] [Google Scholar]
- 22.Louzoun, Y., and T. Vider. 2004. Score for proteasomal peptide production probability. Immunology 1:45-50. [Google Scholar]
- 23.Louzoun, Y., T. Vider, and M. Weigert. 2006. T-cell epitope repertoire as predicted from human and viral genomes. Mol. Immunol. 43:559-569. [DOI] [PubMed] [Google Scholar]
- 24.MacLean, C. A., A. Dolan, F. E. Jamieson, and D. J. McGeoch. 1992. The myristylated virion proteins of herpes simplex virus type 1: investigation of their role in the virus life cycle. J. Gen. Virol. 73:539-547. [DOI] [PubMed] [Google Scholar]
- 25.Marsh, S. G. E., P. Parham, and L. D. Barber. 2000. The HLA facts book. Academic Press, London, United Kingdom.
- 26.Martinez-Guzman, D., T. Rickabaugh, T. T. Wu, H. Brown, S. Cole, M. J. Song, L. Tong, and R. Sun. 2003. Transcription program of murine gammaherpesvirus 68. J. Virol. 77:10488-10503. [DOI] [PMC free article] [PubMed] [Google Scholar]
- 27.McMichael, A. J., and R. E. Phillips. 1997. Escape of human immunodeficiency virus from immune control. Annu. Rev. Immunol. 15:271-296. [DOI] [PubMed] [Google Scholar]
- 28.McSparron, H., M. J. Blythe, C. Zygouri, I. A. Doytchinova, and D. R. Flower. 2003. JenPep: a novel computational information resource for immunobiology and vaccinology. J. Chem. Inf. Comput. Sci. 43:1276-1287. [DOI] [PubMed] [Google Scholar]
- 29.Munz, C. 2004. Epstein-Barr virus nuclear antigen 1: from immunologically invisible to a promising T cell target. J. Exp. Med. 199:1301-1304. [DOI] [PMC free article] [PubMed] [Google Scholar]
- 30.Parham, P., and T. Ohta. 1996. Population biology of antigen presentation by MHC class I molecules. Science 272:67-74. [DOI] [PubMed] [Google Scholar]
- 31.Parker, K. C., M. A. Bednarek, L. K. Hull, U. Utz, B. Cunningham, H. J. Zweerink, W. E. Biddison, and J. E. Coligan. 1992. Sequence motifs important for peptide binding to the human MHC class I molecule, HLA-A2. J. Immunol. 149:3580-3587. [PubMed] [Google Scholar]
- 32.Pasieka, T. J., T. Baas, V. S. Carter, S. C. Proll, M. G. Katze, and D. A. Leib. 2006. Functional genomic analysis of herpes simplex virus type 1 counteraction of the host innate response. J. Virol. 80:7600-7612. [DOI] [PMC free article] [PubMed] [Google Scholar]
- 33.Peters, B., S. Bulik, R. Tampe, P. M. V. Endert, and H. G. Holzhutter. 2003. Identifying MHC class I epitopes by predicting the TAP transport efficiency of epitope precursors. J. Immunol. 171:1741-1749. [DOI] [PubMed] [Google Scholar]
- 34.Pudney, V. A., A. M. Leese, A. B. Rickinson, and A. D. Hislop. 2005. CD8+ immunodominance among Epstein-Barr virus lytic cycle antigens directly reflects the efficiency of antigen presentation in lytically infected cells. J. Exp. Med. 201:349-360. [DOI] [PMC free article] [PubMed] [Google Scholar]
- 35.Rammensee, H., J. Bachmann, N. P. Emmerich, O. A. Bachor, and S. Stevanovic. 1999. SYFPEITHI: database for MHC ligands and peptide motifs. Immunogenetics 50:213-219. [DOI] [PubMed] [Google Scholar]
- 36.Rammensee, H.-G., J. Bachmann, and S. Stevanović. 1997. MHC ligands and peptide motifs. Landes Bioscience, Austin, TX. [DOI] [PubMed]
- 37.Robinson, J., M. J. Waller, P. Parham, J. G. Bodmer, and S. G. E. Marsh. 2001. IMGT/HLA database: a sequence database for the human major histocompatibility complex. Nucleic Acids Res. 29:210-213. [DOI] [PMC free article] [PubMed] [Google Scholar]
- 38.Rock, K. L., I. A. York, T. Saric, and A. L. Goldberg. 2002. Protein degradation and the generation of MHC class I-presented peptides. Adv. Immunol. 80:1-70. [DOI] [PubMed] [Google Scholar]
- 39.Sandler, S. G., and C. Fang. 1991. Preventing transfusion-transmitted infections: issues related to migrating populations and increasing world travel. Haematologia (Budapest) 24:197-210. [PubMed] [Google Scholar]
- 40.Sathiamurthy, M., H. D. Hickman, J. W. Cavett, A. Zahoor, K. Prilliman, S. Metcalf, M. Fernandez Vina, and W. H. Hildebrand. 2003. Population of the HLA ligand database. Tissue Antigens 61:12-19. [DOI] [PubMed] [Google Scholar]
- 41.Sebzda, E., S. Mariathasan, T. Ohteki, R. Jones, M. F. Bachmann, and P. S. Ohashi. 1999. Selection of the T cell repertoire. Annu. Rev. Immunol. 17:829-874. [DOI] [PubMed] [Google Scholar]
- 42.Soderberg-Naucler, C. 2006. Human cytomegalovirus persists in its host and attacks and avoids elimination by the immune system. Crit. Rev. Immunol. 26:231-264. [DOI] [PubMed] [Google Scholar]
- 43.van den Broek, M. F., and H. Hengartner. 2000. The role of perforin in infections and tumour surveillance. Exp. Physiol. 85:681-685. [DOI] [PubMed] [Google Scholar]
- 44.Wheeler, D. L., T. Barrett, D. A. Benson, S. H. Bryant, K. Canese, D. M. Church, M. DiCuccio, R. Edgar, S. Federhen, W. Helmberg, D. L. Kenton, O. Khovayko, D. J. Lipman, T. L. Madden, D. R. Maglott, J. Ostell, J. U. Pontius, K. D. Pruitt, G. D. Schuler, L. M. Schriml, E. Sequeira, S. T. Sherry, K. Sirotkin, G. Starchenko, T. O. Suzek, R. Tatusov, T. A. Tatusova, L. Wagner, and E. Yaschenko. 2005. Database resources of the National Center for Biotechnology Information. Nucleic Acids Res. 33:D39-45. [DOI] [PMC free article] [PubMed] [Google Scholar]
- 45.Wing, B. A., G. C. Lee, and E. S. Huang. 1996. The human cytomegalovirus UL94 open reading frame encodes a conserved herpesvirus capsid/tegument-associated virion protein that is expressed with true late kinetics. J. Virol. 70:3339-3345. [DOI] [PMC free article] [PubMed] [Google Scholar]
- 46.Yuan, W., A. Dasgupta, and P. Cresswell. 2006. Herpes simplex virus evades natural killer T cell recognition by suppressing CD1d recycling. Nat. Immunol. 7:8 35-42. [DOI] [PubMed] [Google Scholar]
Associated Data
This section collects any data citations, data availability statements, or supplementary materials included in this article.