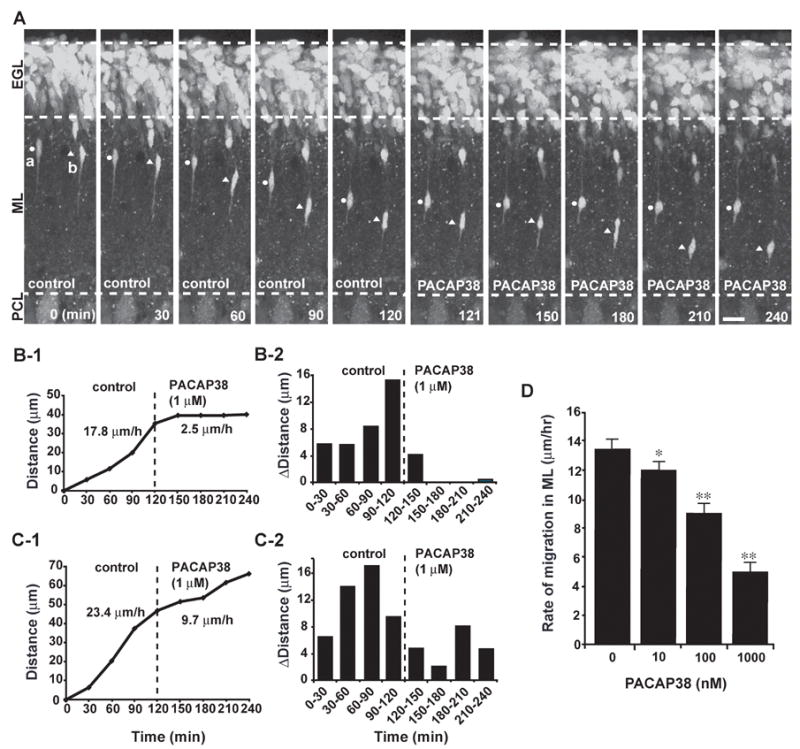
Fig. 2.

Dose-dependent inhibition of granule cell migration in the ML of P10 mouse cerebellumby PACAP38. (A) Time-lapse images showing that application of 1 μM PACAP38 immediately slows the migration of granule cells in the ML. Elapsed time (in minutes) is indicated on the bottom of each photograph. Circles (a) and triangles (b) mark the cell bodies of migrating granule cells. Scale bar: 16μm. (B1,2 and C1,2) Sequential changes in the total distance (B1 and C1) and the distance (B2 and C2) traveled during each 30 minutes of the testing period by granule cells marked by circles (B) and triangles (C) in A were plotted as a function of elapsed time before and after application of 1 μM PACAP38. (D) Dose-dependent reduction of the rate of granule cell migration in the ML of P10 mouse cerebella by PACAP38. Each column represents the average rate obtained from at least 30 migrating cells. Bar: S.D.
