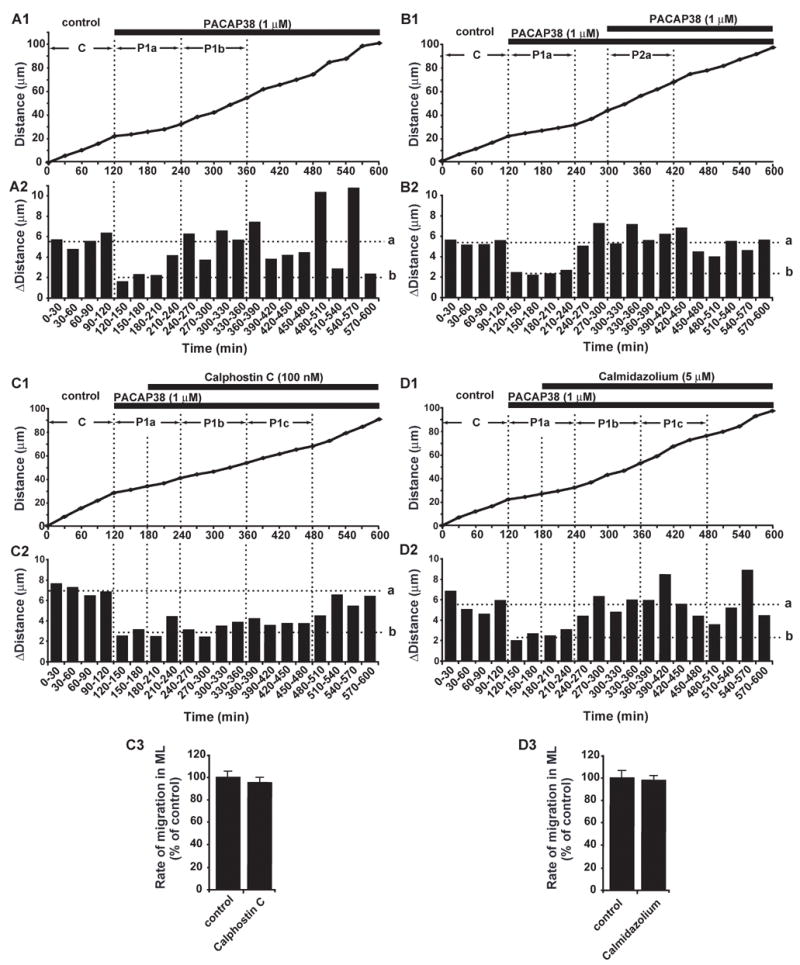
Fig. 5.

Recovery of granule cells from PACAP38-induced inhibition of migration by desensitization of PACAP receptors. (A1,2) Sequential changes in granule cell migration in the ML of the P10 mouse cerebella after application of 1 μM PACAP38. In A1, C, P1a and P1b indicate the 2 hours control period, the first 2 hours period and the second 2 hours period after application of PACAP38, respectively. (B1,2) Loss of granule cell response in the ML to the 2nd application of 1 μM PACAP38 after prolonged application of 1 μM PACAP38. In B1, C, P1a and P2a indicate the 2 hours control period, the first 2 hours period after first application of PACAP38, and the first 2 hours period after second application of PACAP38, respectively. (C)Delay in the recovery of granule cells from the PACAP38 (1 μM)-induced inhibition of migration in the ML by application of 100 nM calphostin C. In C1, C, P1a, P1b, and P1c indicate the 2 hours control period, the first 2 hours period, the second 2 hours period and third 2 hours period after application of PACAP38, respectively. (D) Application of 5 μM calmidazolium did not alter the recovery of granule cells from the PACAP38-induced slowdown of migration in the ML. In D1, C, P1a, P1b and P1c indicate the 2 hours control period, the first 2 hours period, the second 2 hours period and third 2 hours period after application of PACAP38, respectively. In (A)–(D), the total distance (A1, B1, C1 and D1) and the distance (A2, B2, C2 and D2) traveled by the granule cell somata during each 30 minutes of the testing period were plotted as a function of elapsed time. The horizontal dotted lines (a) in A2, B2, C2 and D2 represent the average distances traversed by granule cells during each 30 minutes in the control periods. The horizontal dotted lines (b) in A2, B2, C2 and D2 represent the average distances traversed by granule cells during each 30 minutes in the first hour after application of 1 μM PACAP38. C3 and D3, Effect of 100 nM calphostin C (C3) and 5 μM calmidazolium (D3) on the rate of granule cell migration in the ML in the absence of exogenous PACAP38. In C3 and D3, each column represents the average rate obtained from at least 30 migrating cells. Bar is S.D.
