

Abstract
Elevated circulating levels of soluble adhesion molecules as markers of endothelial dysfunction have been related to insulin resistance and its associated metabolic abnormalities. However, their associations with type 2 diabetes remain inconclusive. We conducted a prospective nested case-control study to examine the associations between plasma levels of E-selectin, intercellular adhesion molecule-1 (ICAM-1), and vascular cell adhesion molecule-1 (VCAM-1) and diabetes risk among 82,069 initially healthy women aged 50 to 79 years from the Women’s Health Initiative Observational Study. During a median follow-up of 5.9 years, 1,584 incident diabetes case subjects were matched with 2,198 control subjects by age, ethnicity, clinical center, time of blood draw, and follow-up time. Baseline median levels of the biomarkers were each significantly higher among case subjects than among control subjects (E-selectin, 49 vs. 37 ng/ml; ICAM-1, 324 vs. 280 ng/ml; and VCAM-1, 765 vs. 696 ng/ml [all P values <0.001]). After adjustment for risk factors, the relative risks of diabetes among women in the highest quartile versus those in the lowest quartile were 3.46 for E-selectin (95% confidence interval 2.56–4.68; P for trend <0.0001), 2.34 for ICAM-1 (1.75–3.13; P for trend <0.0001), and 1.48 for VCAM-1 (1.07–2.04; P for trend = 0.009). E-selectin and ICAM-1 remain significant in each ethnic group. Higher levels of E-selectin and ICAM-1 were consistently associated with increased diabetes risk in a multiethnic cohort of U.S. postmenopausal women, implicating an etiological role of endothelial dysfunction in the pathogenesis of type 2 diabetes.
Endothelial dysfunction has been closely related to insulin resistance (1–4), implicating its etiological role in the development of early atherosclerotic cardiovascular disease (CVD) and type 2 diabetes (5,6). Endothelial dysfunction/activation can readily be assessed by measuring circulating levels of endothelial soluble adhesion molecules. Certain proinflammatory stimuli can elicit the expression of adhesion molecules, including E-selectin, intercellular adhesion molecule-1 (ICAM-1), and vascular cell adhesion molecule-1 (VCAM-1) on the surface of vascular endothelial cells (5,6). Soluble forms of these molecules are released from shedding or proteolytic cleavage from the endothelial cell surface and may reflect overexpression of their respective membrane-bound forms (6,7).
Cross-sectional studies have shown an elevation in circulating levels of E-selectin, ICAM-1, and VCAM-1 not only among type 2 diabetes patients (8–11) but also among nondiabetic individuals with insulin resistance (1–4), obesity (12–15), hypertension (16–19), and dyslipidemia (20,21). However, prospective data for the relationship between these endothelial adhesion molecules and risk of type 2 diabetes are very limited, and the results have been inconsistent (22–24). Furthermore, there is evidence to suggest ethnic differences in plasma levels of endothelial adhesion molecules (25), but it remains unclear whether the relationship between these biomarkers and diabetes risk varies among different ethnic populations. In addition, the deterioration of endothelial function has been strongly associated with age (26) and menopause in women (27), and its causal relationship to type 2 diabetes remains to be determined among postmenopausal women.
We therefore prospectively examined the association between baseline levels of endothelial adhesion molecules and diabetes risk in initially healthy women aged 50 to 79 years from the Women’s Health Initiative Observational Study, an ethnically diverse cohort of postmenopausal women, including whites, blacks, Hispanics, and Asians/Pacific Islanders.
RESEARCH DESIGN AND METHODS
Study population
The Women’s Health Initiative Observational Study is an ongoing longitudinal study designed to examine the association between clinical, socioeconomic, behavioral, and dietary risk factors and subsequent incidence of several health outcomes, including diabetes. Details of the scientific rationale, eligibility, and other design aspects have been published elsewhere (28,29). The study has been reviewed and approved by human subjects review committees at each participating institution, and signed informed consent was obtained from all women enrolled.
Assessment of baseline variables
As described previously (28,29), all Women’s Health Initiative Observational Study participants completed self-administered questionnaires at study entry that included information on demographic and lifestyle variables. A detailed dietary assessment was performed using a standardized food frequency questionnaire. During the initial screening visit, their anthropometric measurements, blood pressure, and fasting blood specimens were also obtained. Ethnicity was determined by self-report and identified as white not of Hispanic origin, African American, Hispanic, American Indian or Alaskan Native, Asian/Pacific Islander, or unknown (none of the above). Prevalent diabetes was defined as self-report of diabetes for women reporting diagnosis when they were not pregnant and those reporting treatment by diet, oral hypoglycemic medications, or insulin. Family history of diabetes was defined by self-report of diabetes in a first-degree relative. Physical activity was expressed in terms of MET-hours. BMI was calculated as weight in kilograms divided by the square of height in meters.
Ascertainment of incident diabetes
Women’s Health Initiative Observational Study participants were followed by annual mailed self-administered questionnaires (medical history and exposure updates) and an additional clinical center visit for physical measurements 3 years after enrollment. Of the 93,676 postmenopausal women enrolled into the Women’s Health Initiative Observational Study cohort, 82,069 (87.6%) women had no prior history of diabetes or CVD. Incident cases of diabetes were identified based on post-baseline self-report of first-time use of hypoglycemic medication (oral hypoglycemic agents or insulin) during a median follow-up period of 5.9 years (mean 5.5 years). Following the principle of risk-set sampling (30), for each incident case, appropriate control subjects were selected at random from women who remained free of CVD and/or diabetes at the diagnosed time in the case patient. Control subjects were matched to the case subjects by age (±2.5 years), racial/ethnic group (white/Caucasian, black/African, Hispanic/Latino, and Asian/Pacific Islander), clinical center (geographic location), time of blood draw (±0.10 h), and length of follow-up. In the present study, 968 case subjects in whites were randomly chosen and matched with one control subject each. Of 749 incident case subjects among ethnic minority women, 366 case subjects were black, 152 case subjects were Hispanics, and 98 case subjects were Asian/Pacific Islanders. The 1:2 matching ratio was used for minorities to strengthen the power in these smaller numbers of case subjects. Our study did not include American-Indian or Alaskan-Native women because of limited sample size for these groups.
Measurement of biochemical variables
Fasting blood specimens were collected from each participant at baseline and processed locally according to a standardized protocol. All biochemical assays were carried out by laboratory staff blinded to case/control status. Blood samples from case subjects and their matched control subjects were handled identically, shipped in the same batch, and assayed in random order in the same analytical run to reduce systematic bias and interassay variation. Soluble E-selectin, ICAM-1, and VCAM-1 were measured by an ELISA assay (R&D Systems, Minneapolis, MN). C-reactive protein (CRP) was measured with a high-sensitivity assay by using reagents from Denka Seiken (Niigata, Japan). Fasting glucose was measured enzymatically on the Hitachi 911 analyzer using reagents from Roche Diagnostics (Indianapolis, IN). Fasting insulin was measured by an ultra-sensitive ELISA assay from ALPCO Diagnostics (Windham, NH). The coefficients of variation for each analyte were 6.5% for E-selectin, 6.7% for ICAM-1, 8.9% for VCAM-1, 1.61% for CRP, 1.7% for fasting glucose, and 5.7% for fasting insulin.
Statistical analysis
To take into account the correlation within matched case-control sets, particularly with different matching ratios, we used mixed-effects regression to evaluate differences of baseline variables in means with case-control cluster modeled as a random effect. A matched χ2 test was used to assess differences in proportions. Age- and ethnicity-adjusted Pearson’s partial correlation coefficients were calculated to evaluate associations between endothelial markers and BMI, waist circumference, CRP, and insulin resistance index estimated using the homeostasis model assessment (HOMA-IR) among control subjects. For continuous variables with markedly skewed distributions, we made logarithmic transformations to enhance compliance with normality assumption.
We divided participants into quartiles according to distributions of the endothelial adhesion markers among the control subjects and used conditional logistic regression to estimate the odds ratio (OR) and 95% confidence interval (95% CI) for diabetes in each quartile using the lowest quartile as the referent category. Because risk-set sampling was used for our matched case-control pairs, the ORs yield unbiased estimates of the relative risk (RR) (30). To test for log-linear trend, we used the median levels of endothelial markers within quartiles as a continuous variable. We also estimated the RR per SD increase in each of the biomarkers, assuming a linear relationship. We first adjusted for matching factors such as age, ethnicity, clinical center, and time of blood draw. In multivariate analyses, we further adjusted for BMI (modeled as a continuously distributed covariate), family history of diabetes (yes or no), smoking (never, past, and current smokers), alcohol intake (never, past, and current drinkers), physical activity (quintiles), and current postmenopausal hormone use (yes or no). We also included E-selectin, ICAM-1, and VCAM-1 simultaneously in the same multivariate model. To control for potential confounding due to insulin resistance or systemic inflammation, we additionally adjusted for levels of fasting glucose, HOMA-IR, and CRP. We also conducted the same analyses for subgroups stratified by ethnicity. The log likelihood ratio test was used to test the significance of the interactions between biomarkers and ethnicity by comparing models with and without the interaction terms.
To evaluate the joint relationship among each of three endothelial biomarkers and CRP levels for diabetes risk, we divided the study population into nine groups according to the tertile cut points of each marker in the control subjects and three clinical cut points for CRP (<1, 1–3, and >3 mg/l).
To address the issue of undiagnosed diabetes at baseline, we also conducted sensitivity analyses excluding those case and control subjects who had fasting glucose ≥126 mg/dl at baseline (Supplementary Table, which is detailed in the online appendix [available at http://dx.doi.org/10.2337/db07–0250]). To further assess the robustness of our findings, we also excluded case subjects with clinical diabetes reported during the 1st year of follow-up, who were more likely to have undiagnosed diabetes at baseline.
All P values were two-tailed, and P values below 0.05 were considered to indicate statistical significance. All analyses were performed with the use of SAS software, version 9.1 (SAS Institute, Cary, NC).
RESULTS
Overall, diabetes case subjects had a higher prevalence of traditional risk factors for diabetes at baseline than control subjects (Table 1). Women with incident diabetes had significantly higher levels of E-selectin, ICAM-1, VCAM-1, CRP, and HOMA-IR at baseline compared with control subjects (Table 1). The differences in levels of these biomarkers varied according to race/ethnic groups, and the relative increased proportion was highest among whites for each of three endothelial markers. The average difference of E-selectin between case and control subjects in blacks was considerably lower than for other ethnic groups. Comparing levels of both ICAM-1 and VCAM-1 between case and control subjects, the differences in Black women were higher than those in Asian and Pacific Islanders but lower than those in White and Hispanic women.
TABLE 1.
Baseline characteristics among 1,584 women with diabetes and 2,198 matched control subjects according to ethnicity and diabetes status*
| Whites
|
Blacks
|
Hispanics
|
Asian/Pacific Islanders
|
|||||
|---|---|---|---|---|---|---|---|---|
| Characteristic† | Case subjects | Control subjects | Case subjects | Control subjects | Case subjects | Control subjects | Case subjects | Control subjects |
| Participants (N) | 968 | 968 | 366 | 732 | 152 | 303 | 98 | 195 |
| Age (years) | 64 ± 6.9 | 64 ± 6.9 | 61 ± 6.7 | 61 ± 6.7 | 60 ± 6.8 | 60 ± 6.7 | 64 ± 7.7 | 64 ± 7.6 |
| BMI (kg/m2) | 33 ± 6.9 | 26 ± 5.1 | 34 ± 7.7 | 30 ± 6.6 | 31 ± 5.8 | 28 ± 5.3 | 27 ± 4.3 | 24 ± 4.6 |
| Waist (inches) | 39 ± 5.9 | 32 ± 4.8 | 38 ± 6.1 | 34 ± 5.3 | 36 ± 5.9 | 33 ± 4.4 | 33 ± 4.1 | 29 ± 3.8 |
| Waist-to-hip ratio | 0.87 ± 0.08 | 0.80 ± 0.08 | 0.85 ± 0.08 | 0.80 ± 0.07 | 0.86 ± 0.10 | 0.81 ± 0.07 | 0.87 ± 0.07 | 0.80 ± 0.06 |
| Physical activity (MET-hours/week) | ||||||||
| Median | 6.1 | 10 | 4.5 | 6.3 | 4.3 | 7.5 | 8.6 | 9.3 |
| Interquartile range | 1.0–14 | 3.8–20 | 0–13 | 1.2–15 | 0–13 | 1.3–18 | 2.3–19 | 3.5–18 |
| Current smoker (%) | 6.9 | 5.5 | 11 | 11 | 8.0 | 3.3 | 3.1 | 4.1 |
| Alcohol intake (%) | ||||||||
| Nondrinker | 13 | 10 | 20 | 16 | 25 | 19 | 40 | 41 |
| Past drinker | 23 | 16 | 35 | 31 | 34 | 21 | 32 | 16 |
| Current drinker | ||||||||
| <1 drink/month | 18 | 11 | 12 | 14 | 16 | 17 | 12 | 14 |
| 1 drink/month to 1 drink/week | 24 | 21 | 18 | 20 | 14 | 22 | 12 | 15 |
| ≥1 drink/week | 23 | 41 | 15 | 20 | 11 | 21 | 4.1 | 14 |
| Current hormone therapy (%) | 37 | 49 | 22 | 35 | 32 | 46 | 53 | 48 |
| Family history of diabetes (%)‡ | 51 | 31 | 70 | 45 | 71 | 45 | 60 | 40 |
| Biomarkers | ||||||||
| E-selectin (ng/ml) | ||||||||
| Median | 50 | 34 | 47 | 41 | 55 | 40 | 48 | 36 |
| Interquartile range | 34–73 | 25–48 | 33–67 | 28–53 | 39–79 | 29–57 | 31–72 | 24–47 |
| ICAM-1 (ng/ml) | ||||||||
| Median | 337 | 290 | 288 | 260 | 335 | 290 | 276 | 258 |
| Interquartile range | 289–397 | 253–338 | 218–349 | 179–320 | 286–399 | 249–338 | 219–338 | 220–294 |
| VCAM-1 (ng/ml) | ||||||||
| Median | 829 | 751 | 628 | 612 | 766 | 738 | 694 | 684 |
| Interquartile range | 655–1,014 | 601–926 | 497–784 | 475–776 | 599–995 | 555–878 | 534–910 | 538–857 |
| C-reactive protein (mg/liter) | ||||||||
| Median | 4.25 | 2.03 | 4.41 | 2.53 | 4.30 | 2.50 | 1.52 | 0.73 |
| Interquartile range | 2.18–7.50 | 0.90–4.12 | 2.12–8.69 | 0.88–5.26 | 2.49–8.09 | 1.15–4.83 | 0.76–2.96 | 0.32–1.82 |
| HOMA-IR§ | ||||||||
| Median | 4.06 | 1.28 | 4.16 | 1.75 | 4.35 | 1.71 | 3.05 | 1.18 |
| Interquartile range | 2.52–6.42 | 0.85–1.87 | 2.49–6.23 | 1.16–2.75 | 2.73–5.95 | 1.05–2.57 | 2.00–4.84 | 0.84–1.75 |
Plus-minus values are means ± SD.
Data on women are from the Women’s Health Initiative Observational Study and include 5.9 years of follow-up. Matching criteria were age, race/ethnicity, clinical center, time of blood draw, and duration of follow-up. Medians and interquartile ranges are provided for continuous variables with skewed distributions.
Differences of covariates (except for age) between case and control subjects in each group were statistically significant (P < 0.05).
Family history of diabetes was defined as self-reported diabetes in a first-degree relative.
HOMA-IR was calculated as the product of fasting serum insulin and fasting plasma glucose divided by 22.5.
E-selectin was modestly correlated with ICAM-1, VCAM-1, CRP, HOMA-IR, BMI, and waist circumference, with partial correlation coefficients ranging from 0.19 to 0.31 (Table 2). ICAM-1 levels were positively associated with VCAM-1 but weakly associated with other variables. However, VCAM-1 levels were positively associated with only E-selectin and ICAM-1 levels (Table 2).
TABLE 2.
Age- and ethnicity-adjusted Pearson partial-correlation coefficients between selected diabetes risk factors among 2,135 control women*
| Variables | E-selectin | ICAM-1 | VCAM-1 | CRP | HOMA-IR | BMI | Waist |
|---|---|---|---|---|---|---|---|
| E-selectin | — | ||||||
| ICAM-1 | 0.23† | — | |||||
| VCAM-1 | 0.28† | 0.29† | — | ||||
| CRP | 0.19† | 0.11† | −0.03 | — | |||
| HOMA-IR | 0.31† | 0.10† | −0.03 | 0.30† | — | ||
| BMI | 0.25† | 0.04 | −0.02 | 0.40† | 0.54† | — | |
| Waist | 0.27† | 0.07‡ | −0.01 | 0.39† | 0.56† | 0.82† | — |
Data on all control subjects without missing values for all of these variables.
P < 0.0001.
P < 0.01.
After adjustment for matching factors, circulating levels of all three endothelial biomarkers were positively and significantly associated with diabetes risk (Table 3). Further adjustment for BMI and other traditional risk factors attenuated but did not eliminate these associations; the RRs of type 2 diabetes in the highest quartile compared with the lowest quartile were 3.46 (95% CI 2.56–4.68; P for trend <0.0001) for E-selectin, 2.34 (1.75–3.13; P for trend <0.0001) for ICAM-1, and 1.48 (1.07–2.04; P for trend = 0.009) for VCAM-1. Additional control for CRP, fasting glucose, or HOMA-IR levels did not materially alter our results. When mutually adjusted, VCAM-1 was no longer predictive of diabetes risk, but E-selectin and ICAM-1 remained statistically significant (Table 3).
TABLE 3.
RRs for diabetes according to quartiles of plasma levels of endothelial adhesion molecules
| Quartile 1 | Quartile 2 | Quartile 3 | Quartile 4 | P value for trend* | Continuous (per 1 SD increase)† | |
|---|---|---|---|---|---|---|
| E-selectin | ||||||
| Median (ng/ml) | 20 | 32 | 43 | 68 | ||
| Quartile range (ng/ml) | 3.4–26 | 27–36 | 37–51 | 52–705 | ||
| Model 1 (matching factors)‡ | 1.00 | 1.95 (1.54–2.47) | 2.39 (1.89–3.04) | 5.48 (4.33–6.94) | <0.0001 | 1.83 (1.70–1.97) |
| Model 2 (multivariable)§ | 1.00 | 1.68 (1.25–2.27) | 1.95 (1.44–2.64) | 3.46 (2.56–4.68) | <0.0001 | 1.58 (1.45–1.73) |
| Model 2 + CRP | 1.00 | 1.71 (1.25–2.32) | 1.90 (1.39–2.59) | 3.14 (2.31–4.28) | <0.0001 | 1.53 (1.39–1.67) |
| Model 2 + fasting glucose | 1.00 | 1.53 (1.03–2.28) | 1.63 (1.09–2.45) | 2.42 (1.64–3.59) | <0.0001 | 1.37 (1.23–1.53) |
| Model 2 + HOMA-IR | 1.00 | 1.57 (1.11–2.22) | 1.57 (1.10–2.25) | 2.08 (1.47–2.94) | 0.0001 | 1.30 (1.18–1.44) |
| Model 2 + ICAM-1, VCAM-1 | 1.00 | 1.56 (1.15–2.12) | 1.73 (1.27–2.37) | 2.89 (2.11–3.96) | <0.0001 | 1.50 (1.36–1.65) |
| ICAM-1 | ||||||
| Median (ng/ml) | 196 | 259 | 302 | 382 | ||
| Quartile range (ng/ml) | 0.40–234 | 235–280 | 281–330 | 331–1,131 | ||
| Model 1 (matching factors)‡ | 1.00 | 1.11 (0.88–1.40) | 1.58 (1.26–1.98) | 3.32 (2.67–4.11) | <0.0001 | 1.62 (1.50–1.75) |
| Model 2 (multivariable)§ | 1.00 | 1.13 (0.84–1.53) | 1.23 (0.92–1.65) | 2.34 (1.75–3.13) | <0.0001 | 1.43 (1.29–1.58) |
| Model 2 + CRP | 1.00 | 1.14 (0.84–1.54) | 1.19 (0.88–1.61) | 2.13 (1.59–2.87) | <0.0001 | 1.38 (1.25–1.53) |
| Model 2 + fasting glucose | 1.00 | 1.42 (0.94–2.13) | 1.44 (0.97–2.16) | 2.65 (1.79–3.93) | <0.0001 | 1.43 (1.25–1.63) |
| Model 2 + HOMA-IR | 1.00 | 1.13 (0.80–1.60) | 1.05 (0.74–1.48) | 1.78 (1.27–2.50) | 0.0003 | 1.26 (1.12–1.41) |
| Model 2 + E-selectin, VCAM-1 | 1.00 | 1.15 (0.85–1.57) | 1.14 (0.84–1.54) | 1.85 (1.35–2.52) | <0.0001 | 1.20 (1.06–1.34) |
| VCAM-1 | ||||||
| Median (ng/ml) | 464 | 619 | 779 | 1,013 | ||
| Quartile range (ng/ml) | 15–543 | 544–696 | 697–861 | 862–3,749 | ||
| Model 1 (matching factors)‡ | 1.00 | 1.16 (0.94–1.43) | 1.29 (1.02–1.62) | 2.05 (1.62–2.59) | <0.0001 | 1.35 (1.25–1.46) |
| Model 2 (multivariable)§ | 1.00 | 1.08 (0.81–1.44) | 1.09 (0.80–1.49) | 1.48 (1.07–2.04) | 0.009 | 1.22 (1.10–1.35) |
| Model 2 + CRP | 1.00 | 1.08 (0.81–1.44) | 1.11 (0.81–1.52) | 1.48 (1.07–2.06) | 0.01 | 1.23 (1.10–1.36) |
| Model 2 + fasting glucose | 1.00 | 1.15 (0.78–1.70) | 1.31 (0.87–1.99) | 1.92 (1.25–2.95) | 0.001 | 1.27 (1.11–1.46) |
| Model 2 + HOMA-IR | 1.00 | 1.30 (0.94–1.81) | 1.26 (0.88–1.81) | 1.59 (1.09–2.31) | 0.03 | 1.19 (1.06–1.34) |
| Model 2 + E-selectin, ICAM-1 | 1.00 | 1.03 (0.76–1.39) | 0.94 (0.67–1.31) | 1.05 (0.74–1.50) | 0.65 | 1.02 (0.91–1.16) |
P values for trend are based on the median levels of endothelial markers in quartiles of the control subjects.
RRs for endothelial markers as continuous variables were RR for per 1 SD; SDs were based on the control subjects: per 20.4 ng/ml increase in E-selectin, per 89.3 ng/ml increase in ICAM-1, and per 245 ng/ml increase in VCAM-1.
Model 1 was adjusted for matching factors (age, race/ethnicity, clinical center, time of blood draw, and duration of follow-up).
Model 2 was adjusted for matching factors, BMI, alcohol intake, level of physical activity, cigarette smoking status, the use or nonuse of postmenopausal hormone therapy, and presence or absence of family history of diabetes.
The associations of E-selectin and ICAM-1 persisted when we excluded 737 case subjects and 27 control subjects with a fasting glucose ≥126 mg/dl at baseline or when we further excluded 36 case subjects occurring in the 1st year of follow-up.
In subgroup analyses, E-selectin showed the strongest association with diabetes risk in all ethnic groups, whereas VCAM-1 remained significant only among white women (Table 4). Elevated levels of ICAM-1 were significantly associated with an increased risk of diabetes among whites, blacks, and Hispanics but not among Asians/Pacific Islanders. Ethnic differences in the relationship between E-selectin and diabetes risk were evident when tested for a formal interaction (P = 0.02). The RRs by E-selectin quartiles in the Asian/Pacific Islanders were larger than those in other groups.
TABLE 4.
Ethnicity-specific RRs for diabetes according to quartiles of plasma levels of endothelial adhesion molecules
| Variable | Quartile 1 | Quartile 2 | Quartile 3 | Quartile 4 | P value for trend* | Continuous (per 1 SD increase)† | P value for interaction‡ |
|---|---|---|---|---|---|---|---|
| E-selectin | |||||||
| Multivariable model§ | |||||||
| Whites | 1.00 | 1.54 (1.01–2.35) | 2.36 (1.50–3.72) | 4.03 (2.59–6.28) | <0.0001 | 1.75 (1.51–2.02) | 0.02 |
| Blacks | 1.00 | 1.62 (0.92–2.87) | 1.30 (0.73–2.30) | 1.97 (1.12–3.46) | 0.04 | 1.27 (1.08–1.49) | |
| Hispanics | 1.00 | 1.11 (0.37–3.32) | 2.21 (0.89–5.49) | 4.79 (1.89–12.1) | <0.0001 | 1.84 (1.41–2.41) | |
| Asian/Pacific Islanders | 1.00 | 4.96 (1.50–16.4) | 2.35 (0.69–8.05) | 12.3 (3.02–49.8) | 0.002 | 2.24 (1.46–3.44) | |
| Multivariable model + ICAM-1, VCAM-1¶ | |||||||
| Whites | 1.00 | 1.48 (0.96–2.28) | 2.14 (1.33–3.44) | 3.35 (2.10–5.35) | <0.0001 | 1.64 (1.40–1.92) | 0.06 |
| Blacks | 1.00 | 1.63 (0.88–3.00) | 1.17 (0.63–2.18) | 1.91 (1.04–3.54) | 0.06 | 1.26 (1.06–1.50) | |
| Hispanics | 1.00 | 1.11 (0.35–3.51) | 2.05 (0.80–5.28) | 3.55 (1.31–9.61) | 0.001 | 1.68 (1.27–2.22) | |
| Asian/Pacific Islanders | 1.00 | 5.18 (1.52–17.7) | 2.40 (0.69–8.39) | 13.1 (2.90–59.2) | 0.005 | 2.21 (1.39–3.50) | |
| ICAM-1 | |||||||
| Multivariable model§ | |||||||
| Whites | 1.00 | 0.95 (0.58–1.57) | 1.32 (0.80–2.18) | 2.44 (1.47–4.03) | <0.0001 | 1.64 (1.37–1.95) | 0.35 |
| Blacks | 1.00 | 1.62 (0.95–2.78) | 1.03 (0.62–1.69) | 1.95 (1.22–3.11) | 0.01 | 1.17 (1.00–1.37) | |
| Hispanics | 1.00 | 1.42 (0.52–3.86) | 1.25 (0.48–3.22) | 3.65 (1.44–9.28) | 0.001 | 1.68 (1.27–2.22) | |
| Asian/Pacific Islanders | 1.00 | 1.23 (0.54–2.84) | 1.11 (0.36–3.39) | 2.49 (0.77–8.03) | 0.16 | 1.69 (1.05–2.71) | |
| Multivariable model + E-selectin, VCAM-1¶ | |||||||
| Whites | 1.00 | 0.86 (0.50–1.47) | 1.02 (0.59–1.75) | 1.55 (0.87–2.73) | 0.02 | 1.22 (0.98–1.51) | 0.54 |
| Blacks | 1.00 | 1.71 (0.99–2.97) | 1.03 (0.62–1.72) | 1.92 (1.18–3.13) | 0.02 | 1.15 (0.97–1.36) | |
| Hispanics | 1.00 | 1.53 (0.51–4.59) | 1.09 (0.39–3.09) | 2.88 (0.99–8.38) | 0.06 | 1.35 (0.97–1.87) | |
| Asian/Pacific Islanders | 1.00 | 1.24 (0.48–3.19) | 0.65 (0.18–2.34) | 1.30 (0.30–5.55) | 0.56 | 1.19 (0.67–2.11) | |
| VCAM-1 | |||||||
| Multivariable model§ | |||||||
| Whites | 1.00 | 0.93 (0.58–1.52) | 1.20 (0.72–2.00) | 1.62 (0.96–2.71) | 0.008 | 1.25 (1.08–1.45) | 0.32 |
| Blacks | 1.00 | 1.28 (0.80–2.05) | 1.04 (0.60–1.80) | 0.87 (0.46–1.66) | 0.60 | 0.98 (0.77–1.25) | |
| Hispanics | 1.00 | 1.34 (0.59–3.07) | 0.69 (0.28–1.67) | 1.79 (0.75–4.30) | 0.19 | 1.35 (1.04–1.75) | |
| Asian/Pacific Islanders | 1.00 | 1.25 (0.47–3.34) | 1.21 (0.38–3.82) | 1.11 (0.39–3.13) | 0.92 | 1.20 (0.81–1.76) | |
| Multivariable model + E-selectin, ICAM-1¶ | |||||||
| Whites | 1.00 | 0.80 (0.47–1.35) | 0.97 (0.55–1.69) | 1.03 (0.57–1.85) | 0.46 | 1.03 (0.86–1.23) | 0.38 |
| Blacks | 1.00 | 1.48 (0.89–2.48) | 1.06 (0.58–1.93) | 0.81 (0.39–1.66) | 0.42 | 0.88 (0.66–1.16) | |
| Hispanics | 1.00 | 1.56 (0.62–3.90) | 0.64 (0.23–1.70) | 1.22 (0.45–3.35) | 0.71 | 1.09 (0.78–1.51) | |
| Asian/Pacific Islanders | 1.00 | 1.25 (0.40–3.92) | 1.12 (0.31–4.05) | 0.91 (0.25–3.26) | 0.58 | 0.86 (0.53–1.38) | |
P values for trend are based on the median levels of endothelial markers in quartiles of the control subjects.
RRs based on per 1 SD increase in endothelial markers as continuous variables (each SD was based on the control subjects: per 20.4 ng/ml increase in E-selectin, per 89.3 ng/ml increase in ICAM-1, and per 245 ng/ml increase in VCAM-1).
P values for interactions by ethnicity.
Model 1 was adjusted for matching factors, BMI, alcohol intake, level of physical activity, cigarette smoking status, the use or nonuse of postmenopausal hormone therapy, and presence or absence of family history of diabetes.
Model 2 was simultaneously adjusted for E-selectin, ICAM1, and VCAM-1 in model 1.
As shown in Fig. 1, we found that increasing levels of E-selectin remain independently associated with diabetes risk irrespective of CRP levels at baseline. Both ICAM-1 and VCAM-1 were associated with diabetes risk independently of CRP only among women with CRP levels >3 mg/l.
FIG. 1.
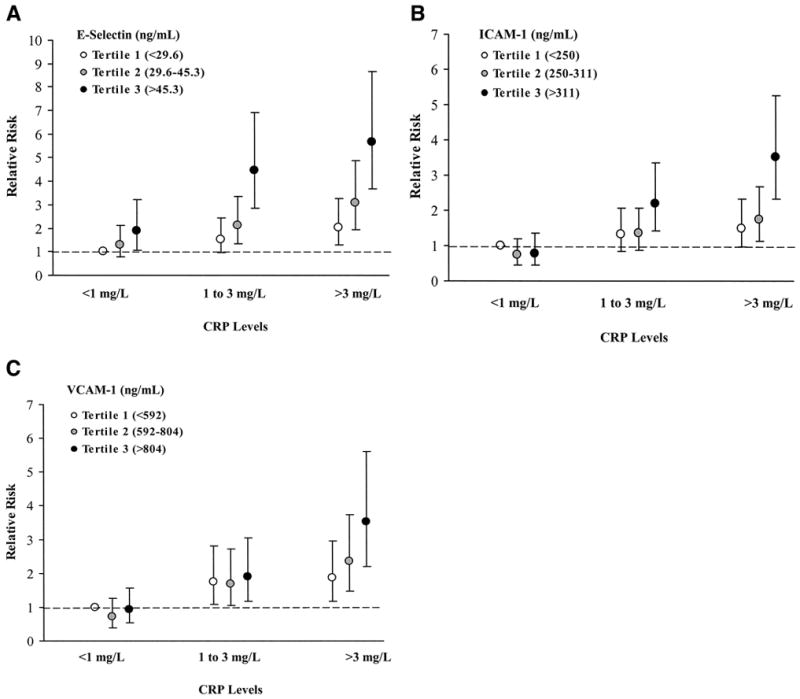
Joint effect of CRP and plasma levels of endothelial adhesion molecules in predicting diabetes risk. Levels of CRP have been divided into three categories (<1, 1–3, or >3 mg/l); the distribution of biomarkers, including E-selectin (A), ICAM-1 (B), and VCAM-1 (C), was categorized into tertiles. The adjusted RR of diabetes among women in each category is shown relative to women with CRP<1 mg/l and with biomarker levels in the lowest tertile. The model was adjusted for matching factors, BMI, alcohol intake, level of physical activity, cigarette smoking status, the use or nonuse of postmenopausal hormone therapy, and presence or absence of family history of diabetes.
DISCUSSION
In this prospective, nested case-control study from an ethnically diverse cohort of U.S. postmenopausal women followed for 5.9 years, we found that circulating levels of endothelial soluble adhesion molecules, including E-selectin, ICAM-1, and VCAM-1, at baseline were significantly elevated among initially healthy women who subsequently developed clinical diabetes. E-selectin and ICAM-1 were strongly and significantly related to an increased risk of diabetes across diverse ethnic groups. These associations were independent of traditional risk factors, including several measures of obesity, insulin resistance, and systemic inflammation.
Experimental and cross-sectional studies support a link between endothelial dysfunction and insulin resistance syndrome, implicating its role in the pathogenesis of type 2 diabetes. To date, very few prospective studies have directly evaluated the role of endothelial biomarkers in predicting risk of type 2 diabetes (23,24,31). In the Nurses’ Health Study, Meigs et al. (24) reported that elevated levels of E-selectin, ICAM-1, and VCAM-1 were independent predictors of incident diabetes in initially nondiabetic Caucasian women. E-selectin, in particular, was the strongest predictor. In a recent population-based case-cohort study, E-selectin but not ICAM-1 was shown to be an independent predictor of type 2 diabetes risk in middle-aged German men and women (31). In line with these prospective findings, we found that E-selectin was a stronger predictor for type 2 diabetes than ICAM-1 and VCAM-1. Our study also showed a consistent pattern for significant associations of both E-selectin and ICAM-1 with diabetes risk across diverse ethnic groups with different risk factor profiles.
These observations may reflect mechanisms underlying the metabolism and function of these adhesion molecules. First, there is evidence that expression of soluble adhesion molecules varies with cell type. An elevated E-selectin level may be a better marker of early endothelial dysfunction than other endothelial adhesion molecules, because only E-selectin is expressed exclusively by endothelial cells, whereas ICAM-1 and VCAM-1 are expressed on a number of other cells (6). Also, circulating E-selectin measurement may be more sensitive and robust than other endothelial markers in accurately reflecting amounts of its membrane-bound form. Soluble forms of these molecules are released from either passive shedding or active proteolytic cleavage from the endothelial cell surface (6), but the biological mechanisms underlying the release and clearance of soluble endothelial adhesion molecules and their true biological functions in circulation remain to be fully elucidated. Furthermore, elevated levels of endothelial adhesion molecules may, to some extent, reflect chronic inflammatory state, because systemic inflammation can directly elicit overproduction of endothelial adhesion molecules (32). Despite positive correlations of CRP, although modest, with elevated levels of E-selectin and ICAM-1, our findings clearly showed that the level of E-selectin provided an additional measure of diabetes risk beyond that afforded by CRP.
Endothelial dysfunction characterizes all phases of insulin resistance and its related metabolic abnormalities, lending support to the “common soil” hypothesis that endothelial dysfunction, as reflected by elevated levels of soluble endothelial adhesion molecules, may be one of the common antecedents for the pathogenesis of both atherosclerotic CVD and type 2 diabetes. The capillary and arteriolar endothelium has been hypothesized to play a central role in the initiation of insulin resistance (33). Expression of endothelial cellular adhesion molecules promotes the adherence and transmigration of leukocytes into the sub-endothelial space, eventually leading to endothelial and sub-endothelial structural changes. Reduced vascular permeability due to structural alterations can then reduce insulin delivery to insulin-sensitive peripheral tissues, which in turn impairs nitric oxide–mediated vasodilation and insulin-mediated glucose metabolism (33,34). Alternatively, insulin resistance may directly promote endothelial dysfunction. Several studies in nondiabetic individuals have suggested that mildly impaired glucose tolerance within the normoglycemic range may accelerate the progression of endothelial dysfunction via adverse effects on oxidative stress, formation of advanced glycation end products, and elevated levels of free fatty acids (35,36).
Of note, there is growing evidence that interventions aimed at reducing individual risk factors correlated with insulin resistance, such as pharmacological treatments with peroxisome proliferator–activated receptor γ ligands, 3-hydroxy-3-methylglutaryl coenzyme A reductase inhibitors (also termed statins), angiotensin-converting enzyme inhibitors, or angiotensin receptor blockers, and nonpharmacological interventions, including weight loss, physical activity, and Mediterranean-style diet, also improve endothelial function (37). These findings indicate the complexity of the interplay between insulin resistance and endothelial dysfunction and also highlight the therapeutic potential of targeting the vascular endothelium for prevention and/or treatment of CVD disease and type 2 diabetes.
The strengths of our study include its prospective study design, the large sample size, and detailed measures of variables. Nonetheless, our study has some limitations. In particular, potential biases due to the inclusion of some women with undiagnosed diabetes merit careful consideration. However, our results were virtually unchanged by control for baseline fasting glucose or insulin levels. Our secondary analyses also yielded similar results after excluding all case and control subjects with a fasting glucose ≥ 126 mg/dl at baseline and all of the case subjects occurring in the 1st follow-up year who were more likely to be undiagnosed diabetes case subjects. Also, random measurement errors from one single measurement of each endothelial biomarker, especially for VCAM-1, might have biased the results toward the null.
In conclusion, this study found that endothelial biomarkers, particularly E-selectin and ICAM-1, were independently associated with an increased risk of diabetes in apparently healthy postmenopausal women from diverse ethnic groups. Our findings lend support to the hypothesis that endothelial dysfunction may play an etiological role in the pathogenesis of type 2 diabetes. These prospective data also offer new insights into the potential clinical value of endothelial function modulation in diabetes prevention.
Acknowledgments
This study has received National Institute of Diabetes and Digestive and Kidney Diseases Grant R01-DK-062290 from the National Institutes of Health. The Women’s Health Initiative program is funded by the National Heart, Lung and Blood Institute, U.S. Department of Health and Human Services.
We acknowledge all Women’s Health Initiative centers and their principal investigators for their participation in this study. We are indebted to all dedicated and committed participants of the Women’s Health Initiative Observational Study. We thank Alyssa Smith and Joseph Larson from the Women’s Health Initiative Clinical Coordinating Center for their assistance.
- CRP
C-reactive protein
- CVD
cardiovascular disease
- HOMA-IR
insulin resistance index estimated using the homeostasis model assessment
- ICAM-1
intercellular adhesion molecule-1
- VCAM-1
vascular cell adhesion molecule-1
Footnotes
Additional information for this article can be found in an online appendix at http://dx.doi.org/10.2337/db07-0250.
References
- 1.Chen NG, Holmes M, Reaven GM. Relationship between insulin resistance, soluble adhesion molecules, and mononuclear cell binding in healthy volunteers. J Clin Endocrinol Metab. 1999;84:3485–3489. doi: 10.1210/jcem.84.10.6065. [DOI] [PubMed] [Google Scholar]
- 2.Hak AE, Pols HA, Stehouwer CD, Meijer J, Kiliaan AJ, Hofman A, Breteler MM, Witteman JC. Markers of inflammation and cellular adhesion molecules in relation to insulin resistance in nondiabetic elderly: the Rotterdam study. J Clin Endocrinol Metab. 2001;86:4398–4405. doi: 10.1210/jcem.86.9.7873. [DOI] [PubMed] [Google Scholar]
- 3.Matsumoto K, Miyake S, Yano M, Ueki Y, Tominaga Y. High serum concentrations of soluble E-selectin in patients with impaired glucose tolerance with hyperinsulinemia. Atherosclerosis. 2000;152:415–420. doi: 10.1016/s0021-9150(99)00487-6. [DOI] [PubMed] [Google Scholar]
- 4.Weyer C, Yudkin JS, Stehouwer CD, Schalkwijk CG, Pratley RE, Tataranni PA. Humoral markers of inflammation and endothelial dysfunction in relation to adiposity and in vivo insulin action in Pima Indians. Atherosclerosis. 2002;161:233–242. doi: 10.1016/s0021-9150(01)00626-8. [DOI] [PubMed] [Google Scholar]
- 5.Ross R. Atherosclerosis: an inflammatory disease. N Engl J Med. 1999;340:115–126. doi: 10.1056/NEJM199901143400207. [DOI] [PubMed] [Google Scholar]
- 6.Price DT, Loscalzo J. Cellular adhesion molecules and atherogenesis. Am J Med. 1999;107:85–97. doi: 10.1016/s0002-9343(99)00153-9. [DOI] [PubMed] [Google Scholar]
- 7.Leeuwenberg JF, Smeets EF, Neefjes JJ, Shaffer MA, Cinek T, Jeunhomme TM, Ahern TJ, Buurman WA. E-selectin and intercellular adhesion molecule-1 are released by activated human endothelial cells in vitro. Immunology. 1992;77:543–549. [PMC free article] [PubMed] [Google Scholar]
- 8.Koga M, Otsuki M, Kubo M, Hashimoto J, Kasayama S. Relationship between circulating vascular cell adhesion molecule-1 and microvascular complications in type 2 diabetes mellitus. Diabet Med. 1998;15:661–667. doi: 10.1002/(SICI)1096-9136(199808)15:8<661::AID-DIA645>3.0.CO;2-G. [DOI] [PubMed] [Google Scholar]
- 9.Lim SC, Caballero AE, Smakowski P, LoGerfo FW, Horton ES, Veves A. Soluble intercellular adhesion molecule, vascular cell adhesion molecule, and impaired microvascular reactivity are early markers of vasculopathy in type 2 diabetic individuals without microalbuminuria. Diabetes Care. 1999;22:1865–1870. doi: 10.2337/diacare.22.11.1865. [DOI] [PubMed] [Google Scholar]
- 10.Schmidt AM, Crandall J, Hori O, Cao R, Lakatta E. Elevated plasma levels of vascular cell adhesion molecule-1 (VCAM-1) in diabetic patients with microalbuminuria: a marker of vascular dysfunction and progressive vascular disease. Br J Haematol. 1996;92:747–750. doi: 10.1046/j.1365-2141.1996.379915.x. [DOI] [PubMed] [Google Scholar]
- 11.Stehouwer CD, Gall MA, Twisk JW, Knudsen E, Emeis JJ, Parving HH. Increased urinary albumin excretion, endothelial dysfunction, and chronic low-grade inflammation in type 2 diabetes: progressive, interrelated, and independently associated with risk of death. Diabetes. 2002;51:1157–1165. doi: 10.2337/diabetes.51.4.1157. [DOI] [PubMed] [Google Scholar]
- 12.Ito H, Ohshima A, Inoue M, Ohto N, Nakasuga K, Kaji Y, Maruyama T, Nishioka K. Weight reduction decreases soluble cellular adhesion molecules in obese women. Clin Exp Pharmacol Physiol. 2002;29:399–404. doi: 10.1046/j.1440-1681.2002.03672.x. [DOI] [PubMed] [Google Scholar]
- 13.Matsumoto K, Sera Y, Abe Y, Tominaga T, Horikami K, Hirao K, Ueki Y, Miyake S. High serum concentrations of soluble E-selectin correlate with obesity but not fat distribution in patients with type 2 diabetes mellitus. Metabolism. 2002;51:932–934. doi: 10.1053/meta.2002.33354. [DOI] [PubMed] [Google Scholar]
- 14.Ferri C, Desideri G, Valenti M, Bellini C, Pasin M, Santucci A, De Mattia G. Early upregulation of endothelial adhesion molecules in obese hypertensive men. Hypertension. 1999;34:568–573. doi: 10.1161/01.hyp.34.4.568. [DOI] [PubMed] [Google Scholar]
- 15.Straczkowski M, Lewczuk P, Dzienis-Straczkowska S, Kowalska I, Stepien A, Kinalska I. Elevated soluble intercellular adhesion molecule-1 levels in obesity: relationship to insulin resistance and tumor necrosis factor-alpha system activity. Metabolism. 2002;51:75–78. doi: 10.1053/meta.2002.28095. [DOI] [PubMed] [Google Scholar]
- 16.Blann AD, Tse W, Maxwell SJ, Waite MA. Increased levels of the soluble adhesion molecule E-selectin in essential hypertension. J Hypertens. 1994;12:925–928. [PubMed] [Google Scholar]
- 17.Buemi M, Allegra A, Aloisi C, Corica F, Alonci A, Ruello A, Montalto G, Frisina N. Cold pressor test raises serum concentrations of ICAM-1, VCAM-1, and E-selectin in normotensive and hypertensive patients. Hypertension. 1997;30:845–847. doi: 10.1161/01.hyp.30.4.845. [DOI] [PubMed] [Google Scholar]
- 18.De Caterina R, Ghiadoni L, Taddei S, Virdis A, Almerigogna F, Basta G, Lazzerini G, Bernini W, Salvetti A. Soluble E-selectin in essential hypertension: a correlate of vascular structural changes. Am J Hypertens. 2001;14:259–266. doi: 10.1016/s0895-7061(00)01276-0. [DOI] [PubMed] [Google Scholar]
- 19.DeSouza CA, Dengel DR, Macko RF, Cox K, Seals DR. Elevated levels of circulating cell adhesion molecules in uncomplicated essential hypertension. Am J Hypertens. 1997;10:1335–1341. doi: 10.1016/s0895-7061(97)00268-9. [DOI] [PubMed] [Google Scholar]
- 20.Abe Y, El-Masri B, Kimball KT, Pownall H, Reilly CF, Osmundsen K, Smith CW, Ballantyne CM. Soluble cell adhesion molecules in hypertriglyceridemia and potential significance on monocyte adhesion. Arterioscler Thromb Vasc Biol. 1998;18:723–731. doi: 10.1161/01.atv.18.5.723. [DOI] [PubMed] [Google Scholar]
- 21.Hackman A, Abe Y, Insull W, Jr, Pownall H, Smith L, Dunn K, Gotto AM, Jr, Ballantyne CM. Levels of soluble cell adhesion molecules in patients with dyslipidemia. Circulation. 1996;93:1334–1338. doi: 10.1161/01.cir.93.7.1334. [DOI] [PubMed] [Google Scholar]
- 22.Duncan BB, Schmidt MI, Offenbacher S, Wu KK, Savage PJ, Heiss G. Factor VIII and other hemostasis variables are related to incident diabetes in adults: The Atherosclerosis Risk in Communities (ARIC) Study. Diabetes Care. 1999;22:767–772. doi: 10.2337/diacare.22.5.767. [DOI] [PubMed] [Google Scholar]
- 23.Krakoff J, Funahashi T, Stehouwer CD, Schalkwijk CG, Tanaka S, Matsuzawa Y, Kobes S, Tataranni PA, Hanson RL, Knowler WC, Lindsay RS. Inflammatory markers, adiponectin, and risk of type 2 diabetes in the Pima Indian. Diabetes Care. 2003;26:1745–1751. doi: 10.2337/diacare.26.6.1745. [DOI] [PubMed] [Google Scholar]
- 24.Meigs JB, Hu FB, Rifai N, Manson JE. Biomarkers of endothelial dysfunction and risk of type 2 diabetes mellitus. JAMA. 2004;291:1978–1986. doi: 10.1001/jama.291.16.1978. [DOI] [PubMed] [Google Scholar]
- 25.Miller MA, Sagnella GA, Kerry SM, Strazzullo P, Cook DG, Cappuccio FP. Ethnic differences in circulating soluble adhesion molecules: the Wandsworth Heart and Stroke Study. Clin Sci (Lond) 2003;104:591–598. doi: 10.1042/CS20020333. [DOI] [PubMed] [Google Scholar]
- 26.Celermajer DS, Sorensen KE, Spiegelhalter DJ, Georgakopoulos D, Robinson J, Deanfield JE. Aging is associated with endothelial dysfunction in healthy men years before the age-related decline in women. J Am Coll Cardiol. 1994;24:471–476. doi: 10.1016/0735-1097(94)90305-0. [DOI] [PubMed] [Google Scholar]
- 27.Taddei S, Virdis A, Ghiadoni L, Mattei P, Sudano I, Bernini G, Pinto S, Salvetti A. Menopause is associated with endothelial dysfunction in women. Hypertension. 1996;28:576–582. doi: 10.1161/01.hyp.28.4.576. [DOI] [PubMed] [Google Scholar]
- 28.Anderson GL, Manson J, Wallace R, Lund B, Hall D, Davis S, Shumaker S, Wang CY, Stein E, Prentice RL. Implementation of the Women’s Health Initiative study design. Ann Epidemiol. 2003;13:S5–S17. doi: 10.1016/s1047-2797(03)00043-7. [DOI] [PubMed] [Google Scholar]
- 29.The Women’s Health Initiative Study Group. Design of the Women’s Health Initiative clinical trial and observational study. Control Clin Trials. 1998;19:61–109. doi: 10.1016/s0197-2456(97)00078-0. [DOI] [PubMed] [Google Scholar]
- 30.Prentice RL, Moolgavkar SH, Farewell VT. Biostatistical issues and concepts in epidemiologic research. J Chronic Dis. 1986;39:1169–1183. doi: 10.1016/0021-9681(86)90147-5. [DOI] [PubMed] [Google Scholar]
- 31.Thorand B, Baumert J, Chambless L, Meisinger C, Kolb H, Doring A, Lowel H, Koenig W. Elevated markers of endothelial dysfunction predict type 2 diabetes mellitus in middle-aged men and women from the general population. Arterioscler Thromb Vasc Biol. 2006;26:398–405. doi: 10.1161/01.ATV.0000198392.05307.aa. [DOI] [PubMed] [Google Scholar]
- 32.Pasceri V, Willerson JT, Yeh ET. Direct proinflammatory effect of C-reactive protein on human endothelial cells. Circulation. 2000;102:2165–2168. doi: 10.1161/01.cir.102.18.2165. [DOI] [PubMed] [Google Scholar]
- 33.Pinkney JH, Stehouwer CD, Coppack SW, Yudkin JS. Endothelial dysfunction: cause of the insulin resistance syndrome. Diabetes. 1997;46 (Suppl 2):S9–S13. doi: 10.2337/diab.46.2.s9. [DOI] [PubMed] [Google Scholar]
- 34.Caballero AE. Endothelial dysfunction in obesity and insulin resistance: a road to diabetes and heart disease. Obes Res. 2003;11:1278–1289. doi: 10.1038/oby.2003.174. [DOI] [PubMed] [Google Scholar]
- 35.Vehkavaara S, Seppala-Lindroos A, Westerbacka J, Groop PH, Yki-Jarvinen H. In vivo endothelial dysfunction characterizes patients with impaired fasting glucose. Diabetes Care. 1999;22:2055–2060. doi: 10.2337/diacare.22.12.2055. [DOI] [PubMed] [Google Scholar]
- 36.Rodriguez CJ, Miyake Y, Grahame-Clarke C, Di Tullio MR, Sciacca RR, Boden-Albala B, Sacco RL, Homma S. Relation of plasma glucose and endothelial function in a population-based multiethnic sample of subjects without diabetes mellitus. Am J Cardiol. 2005;96:1273–1277. doi: 10.1016/j.amjcard.2005.06.070. [DOI] [PubMed] [Google Scholar]
- 37.Brunner H, Cockcroft JR, Deanfield J, Donald A, Ferrannini E, Halcox J, Kiowski W, Luscher TF, Mancia G, Natali A, Oliver JJ, Pessina AC, Rizzoni D, Rossi GP, Salvetti A, Spieker LE, Taddei S, Webb DJ. Endothelial function and dysfunction. Part II: Association with cardiovascular risk factors and diseases. A statement by the Working Group on Endothelins and Endothelial Factors of the European Society of Hypertension. J Hypertens. 2005;23:233–246. doi: 10.1097/00004872-200502000-00001. [DOI] [PubMed] [Google Scholar]