

Abstract
Hendra virus, like most paramyxoviruses, requires both a fusion (F) and attachment (G) protein for promotion of cell-cell fusion. Recent studies determined that Hendra F is proteolytically processed by the cellular protease cathepsin L after endocytosis. This unique cathepsin L processing results in a small percentage of Hendra F on the cell surface. To determine how the surface densities of the two Hendra glycoproteins affect fusion promotion, we performed experiments that varied the levels of glycoproteins expressed in transfected cells. Using two different fusion assays, we found a marked increase in fusion when expression of the Hendra G protein was increased, with a 1:1 molar ratio of Hendra F:G on the cell surface resulting in optimal membrane fusion. Our results also showed that Hendra G protein levels are modulated by both more rapid protein turnover and slower protein trafficking than is seen for Hendra F.
Keywords: membrane fusion, attachment protein, paramyxovirus, Hendra virus, degradation
INTRODUCTION
Hendra virus and Nipah virus are newly emerged pathogens which belong to the Henipavirus genus within the family Paramyxoviridae (Wang et al., 2001; Wang et al., 2000). Nipah virus first emerged in Malaysia in 1999 when individuals in close contact with swine were infected, resulting in acute febrile encephalitis which caused the deaths of over 100 people. In addition, over one million swine were culled to halt the spread of the infection (Goldsmith et al., 2003). Subsequent outbreaks of Nipah virus in Bangladesh from 2001 to 2005 resulted in fatality rates as high as 75% and the first evidence of human-to-human transmission of the virus (2004; Hsu et al., 2004). Hendra virus, which is closely related to Nipah virus, was first discovered in 1994 when an outbreak of acute respiratory syndrome resulted in the deaths of fourteen horses in Hendra, Australia (Field et al., 2001). The virus exhibited the ability to cross species when the veterinarian and horse trainer caring for the sick horses were infected. Hendra claimed its first human fatality when the trainer succumbed to a severe respiratory infection (Field et al., 2001). Additionally, Hendra virus was also responsible for a second human death in October of 1995 in Mackay, Australia (Field et al., 2001). Both Hendra and Nipah have been classified as bio-safety level four pathogens, and pose a serious public health hazard due to their virulence and lack of approved antiviral therapies (Daniels, Ksiazek, and Eaton, 2001; Eaton et al., 2006).
Hendra virus, like the majority of other paramyxoviruses, possesses two surface glycoproteins, a fusion protein (F) and an attachment protein (G), that are involved in promotion of fusion between the viral membrane and the membrane of the target host cell. The fusion and attachment proteins also mediate the process of cell-to-cell fusion to form multi-nucleated giant cells called syncytia after either viral infection or through transient transfection of the viral glycoproteins into cells. Hendra and Nipah viruses require both their attachment and fusion proteins to initiate membrane fusion (Bossart et al., 2001; Bossart et al., 2002). However, while many paramyxoviruses require their homotypic fusion and attachment protein for membrane fusion, Hendra and Nipah viruses can utilize their fusion and attachment proteins interchangeably (Bossart et al., 2001). Recently, the cellular receptor utilized by Hendra and Nipah viruses was determined to be ephrin-B2 or ephrin-B3, which are ligands for a receptor tyrosine kinase family (Bonaparte et al., 2005; Negrete et al., 2005; Negrete et al., 2006).
The Hendra virus F protein is a class I viral fusion protein that requires trimerization and proteolytic cleavage into two disulfide-linked subunits, F1 and F2, to be fusogenically active. Several paramyxovirus fusion proteins, including those from measles, simian virus 5 (SV5), and respiratory syncytial virus (RSV) are cleaved by furin in the trans-Golgi network (Bolt and Pedersen, 1998; Garten et al., 1994; Sugrue et al., 2001). Interestingly, it was recently shown that the cellular endosomal/lysosomal protease cathepsin L cleaves both the Hendra and Nipah virus fusion proteins (Pager et al., 2006; Pager and Dutch, 2005). Proteolytic processing places the hydrophobic fusion peptide at the N-terminus of the F1 subunit, thus making it available for insertion into the membrane of a target cell. However, the event that triggers this insertion is yet undefined for paramyxoviruses, although the binding of the cellular receptor by the attachment protein is thought to play an important role (Earp et al., 2005; Lamb, 1993; Russell, Jardetzky, and Lamb, 2001; Takimoto et al., 2002; Tamm and Han, 2000).
Paramyxovirus attachment proteins are classified according to their ability to bind and cleave sialic acid. These proteins are thought to function as tetramers which are arranged in a dimer-dimer formation (Bossart et al., 2005; Takimoto et al., 2002) and are synthesized as type II integral membrane proteins. The attachment proteins of paramyxoviruses have a cytoplasmic tail at the N-terminus, a transmembrane domain, a stem or stalk region and finally a large globular head domain at the C-terminus. Co-immunoprecipitation experiments have suggested that there are physical interactions between the attachment and fusion proteins at the surface of the cell (Aguilar et al., 2006; Deng et al., 1999; Stone-Hulslander and Morrison, 1997; Yao, Hu, and Compans, 1997). The production of chimeric attachment proteins provided evidence that the stalk region of the attachment protein is important for its interaction with the fusion protein (Deng et al., 1995; Tanabayashi and Compans, 1996). This type of direct interaction is hypothesized to account for the requirement of most paramyxovirus F protein for the homotypic attachment to promote membrane fusion (Takimoto et al., 2002).
Previous work with SV5 and HPIV3 examined the effect of the surface density of the fusion and attachment proteins on membrane fusion. Studies involving SV5 indicated that although expression of an attachment protein was required for membrane fusion when cell-cell binding was required, membrane fusion was dependent on the surface expression of SV5 F, consistent with the HN-independent fusion observed in syncytia formation (Dutch, Joshi, and Lamb, 1998). For HPIV3, which requires its homotypic fusion and attachment proteins, a 1:1 surface density ratio of fusion to attachment protein is required for maximal fusion (Dutch, Joshi, and Lamb, 1998). Fusion promoted by the Hendra fusion protein requires co-expression of either Hendra or Nipah G protein (Bossart et al., 2001). However, Hendra and Nipah virus F proteins are unique among paramyxovirus fusion proteins in that they are cleaved by the endosomal/lysosomal protease cathepsin L (Pager et al., 2006; Pager and Dutch, 2005), and require endocytosis for efficient processing (Meulendyke et al., 2005; Vogt et al., 2005). Endocytosis has been shown to decrease surface levels of Hendra F and Nipah F and explains the low level of Hendra F or Nipah F on the surface of cells (Meulendyke et al., 2005; Vogt et al., 2005). As a low level of Hendra F is expressed on the cell surface, we anticipated that very low levels of Hendra G would provide optimal membrane fusion with this system. However, nothing was previously known regarding the expression levels of these two important viral proteins needed for optimal fusion.
Research presented in this paper focuses on the attachment protein requirements for optimal Hendra F-mediated fusion. Using two distinct cell-to-cell fusion assays, we have determined that the ratio of Hendra F to Hendra G plasmids transfected into cells can strongly influence membrane fusion. Increasing the cell surface expression of the Hendra G protein allows for increased cell-to-cell fusion but does not effect the expression of Hendra F. Although three to four times more Hendra G plasmid is required for optimal Hendra F-mediated fusion, the protein ratio of Hendra F to Hendra G at the cell surface is nearly 1:1. As Hendra F protein levels at the cell surface are significantly reduced by endocytosis, we investigated the trafficking of the Hendra G protein. We found that the Hendra G protein was very slowly transported through the secretory pathway compared to Hendra F. Pulse-chase analysis also showed that Hendra F is stable up to 24 hours (Pager, Wurth, and Dutch, 2004), whereas, six hours after the initial label, the majority of the Hendra G protein was found to be degraded. These results suggest that both slowed folding and/or transport and subsequently more rapid degradation modulate the cell surface expression of Hendra G.
RESULTS
Increasing levels of Hendra G plasmid increases syncytia formation
Syncytia are large, multi-nucleated giant cells that form upon the fusion of the lipid bilayers of neighboring cells. Syncytia formation promoted by the Hendra glycoproteins is relevant to the disease state of these viruses, as syncytia formation occurs in patients that have been infected with both Hendra and Nipah (Wong, 2000; Wong et al., 2002). To address the effect of varying Hendra F and G levels on syncytia formation, varying levels of pCAGGS-Hendra F and pCAGGS-Hendra G were transfected into cells (Niwa, Yamamura, and Miyazaki, 1991). The amount of Hendra F plasmid remained constant at 0.25 μg while the amount of Hendra G plasmid ranged between 0.25 μg to 2.5 μg depending on the ratio of the plasmids used, except for the F:G (5:1) sample where 0.25 μg of Hendra G plasmid and 1.25 μg Hendra F plasmid was used. The total amount of plasmid DNA transfected into cells remained constant between samples by addition of empty vector. Twenty-four hours post-transfection, cells were examined for the formation of multi-nucleated cells. BHK cells transfected with either the Hendra F or Hendra G plasmids alone showed no syncytia formation above normal background levels (Fig. 1). Samples transfected with fives times more Hendra F plasmid than Hendra G plasmid showed very little syncytia formation. However, at a 1:1 ratio of Hendra F : Hendra G plasmids, small syncytia were observed (Fig. 1). The formation of syncytia increased both in number and size as the amount of Hendra G plasmid transfected into the cells increased to three times that of the fusion protein plasmid. This confirmed that both the fusion protein and attachment protein must be present for cell-to-cell fusion to occur, and suggested that Hendra F- mediated fusion is modulated by the level of Hendra G protein present. Similar results were observed in Vero cells expressing the Hendra F and G proteins, which indicated that this observation was not confined to a single cell type (data not shown). Results were also confirmed using the pGEM expression system in BSR cells, which stably express T7 polymerase, suggesting that this observation was not dependent on the expression system (data not shown).
Figure 1. Syncytia using increasing amounts of the Hendra G plasmid.
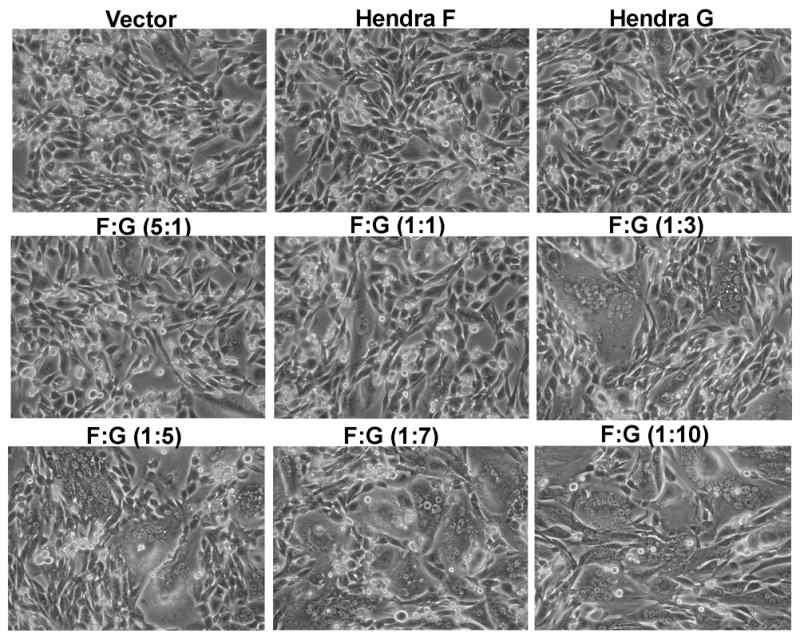
BHK cells were transfected with a constant amount of Hendra F plasmid and increasing amounts of Hendra G plasmid. Twenty-four hours post-transfection photographs of the syncytia were taken.
Increased fusion observed in luciferase reporter gene assay with increasing levels of Hendra G plasmid present
The luciferase reporter gene fusion assay is a quantitative fusion assay which allows earlier examination of cell-to-cell fusion events compared to the syncytia assay. One population of cells was transfected with a constant amount of Hendra F plasmid, increasing levels of Hendra G plasmid, and a luciferase plasmid under the control of the T7 promoter, with total plasmid DNA levels kept constant by addition of empty vector. Target cells expressing T7 polymerase were overlaid onto the effector cells expressing the Hendra glycoproteins, and six hours after the overlay the cells were assayed for luciferase activity. When Vero cells were used as both the effector and target cell line, no fusion above background was seen with effector cells expressing only one of the glycoproteins (Fig. 2A, HeV F, HeV G). Fusion increased when both glycoproteins were present in the effector cells, and was further stimulated as the levels of Hendra G plasmid increased. When a 1:4 ratio of F: G was used, cell-to-cell fusion was approximately four times higher then the level of fusion seen when a 1:1 ratio of F: G was used. To determine if the results were specific to one cell type, BSR cells (which stably express the T7 polymerase), were employed as the target cell (Buchholz, Finke, and Conzelmann, 1999). To allow transfection of higher ratios of Hendra G to F plasmid, 0.1 μg of Hendra F plasmid was used. Similar to the results seen in Vero cells, only background levels of luciferase activity were observed when one glycoprotein was present on the effector cell (Fig. 2B, HeV F, HeV G-low, HeV G-high). Samples expressing Hendra G alone included samples transfected with the lowest and highest amount of Hendra G plasmid transfected into cells. As more Hendra G plasmid was transfected into the effector cells, in the presence of Hendra F, the level of fusion increased. Fusion appeared maximal at or above a 1:10 ratio of fusion to attachment protein. When HeLa cells were transfected with a T7 polymerase expressing plasmid and used as target cells, similar results were observed (data not shown). These experiments indicate that the increased fusion seen with greater amounts of the attachment protein plasmid is not cell line-dependent, and is consistent between two different assays for membrane fusion.
Figure 2. Luciferase Assays.
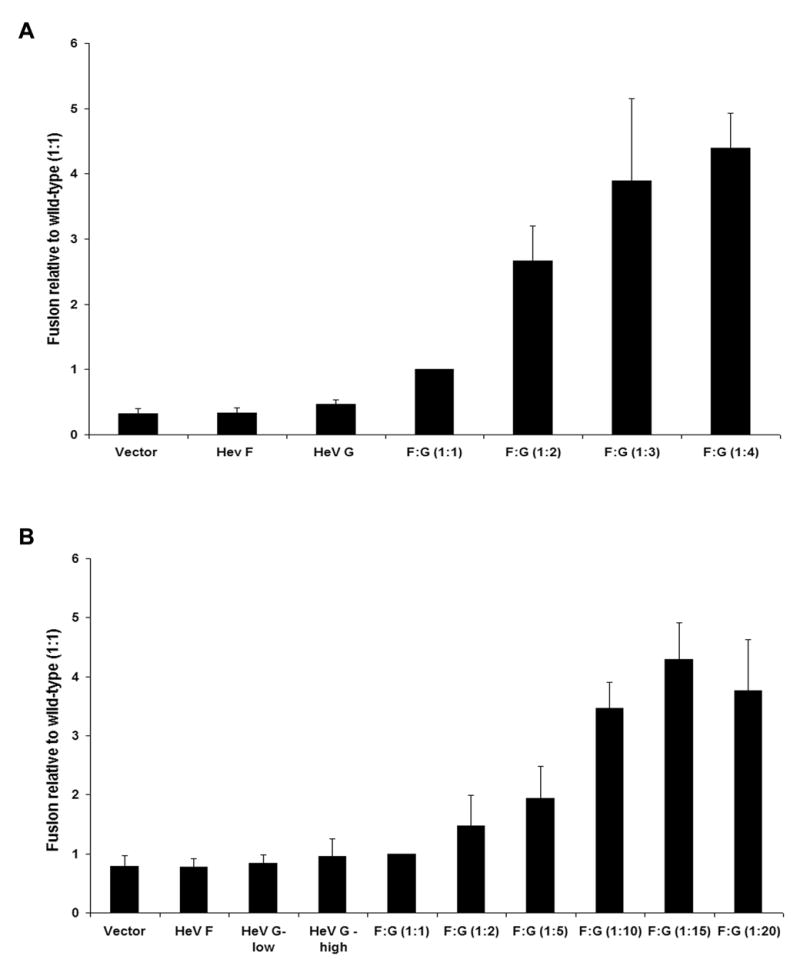
A) Vero cells were transfected with pCAGGS-Hendra F and pCAGGS-Hendra G and a plasmid containing the luciferase gene under the control of the T7 promoter, or T7 polymerase. Twenty-four hours post-transfection, cells expressing the T7 polymerase were overlaid onto the Vero cells expressing the glycoproteins for six hours. The cells were then lysed and the substrate for luciferase added and luciferase production was quantitated using a luminometer. Readings from the 1:1 sample were set as 1 and the other samples are recorded as percent of wildtype. All samples were normalized to F:G (1:1). Error bars represent one standard deviation. B) Vero cells were transfected with pCAGGS-Hendra F and pCAGGS-Hendra G and a plasmid expressing luciferase under the control of a T7 promoter. BSR cells, which stably express the T7 polymerase, were used as the target cells. Twenty-four hours post-transfection the BSR cells were overlaid onto the Vero cells for three hours. The cells were lysed, the luciferase substrate added, and luciferase production was quantitated using a luminometer. Readings for 1:1 sample was set at 1 with other samples graphed as a percent of wildtype. Error bars represent one standard deviation. Sample labeled as HeV G-low was transfected with the lowest amount of Hendra G plasmid used in this experiment. Sample labeled as HeV G-high was transfected with the highest amount of Hendra G plasmid used in this experiment.
Increasing Hendra G plasmid transfected into cells leads to increased Hendra G protein expression and has no effect on the overall expression of Hendra F
As more Hendra G plasmid transfected into cells led to an increase in cell-to-cell fusion, we next verified that the higher levels of plasmid translated into higher protein expression levels. Vero cells were transfected with a constant one μg of Hendra F plasmid and 1 to 4 μg of Hendra G plasmid. Twenty-four hours post-transfection, Vero cells were metabolically labeled for three hours. The cells were lysed and Hendra G protein was immunoprecipitated with a peptide antibody to residues 19-33 of the Hendra G cytoplasmic tail. As the amount of Hendra G plasmid transfected into cells increased to four times that of Hendra F, the amount of Hendra G protein also increased (Fig. 3A, Lanes 4–7), verifying that the increase in cell-to-cell fusion observed correlates with an increase in Hendra G protein levels. To verify that the increasing G protein levels resulted from an increase in protein levels within transfected cells, and not from an increase in the percentage of cells expressing Hendra G, transfection efficiencies at increasing G plasmid levels were examined via immunofluorescence. No significant variation in the percentage of cells expressing Hendra G was observed with the varying amounts of G plasmids utilized in these experiments (data not shown).
Figure 3. Hendra G and F expression.
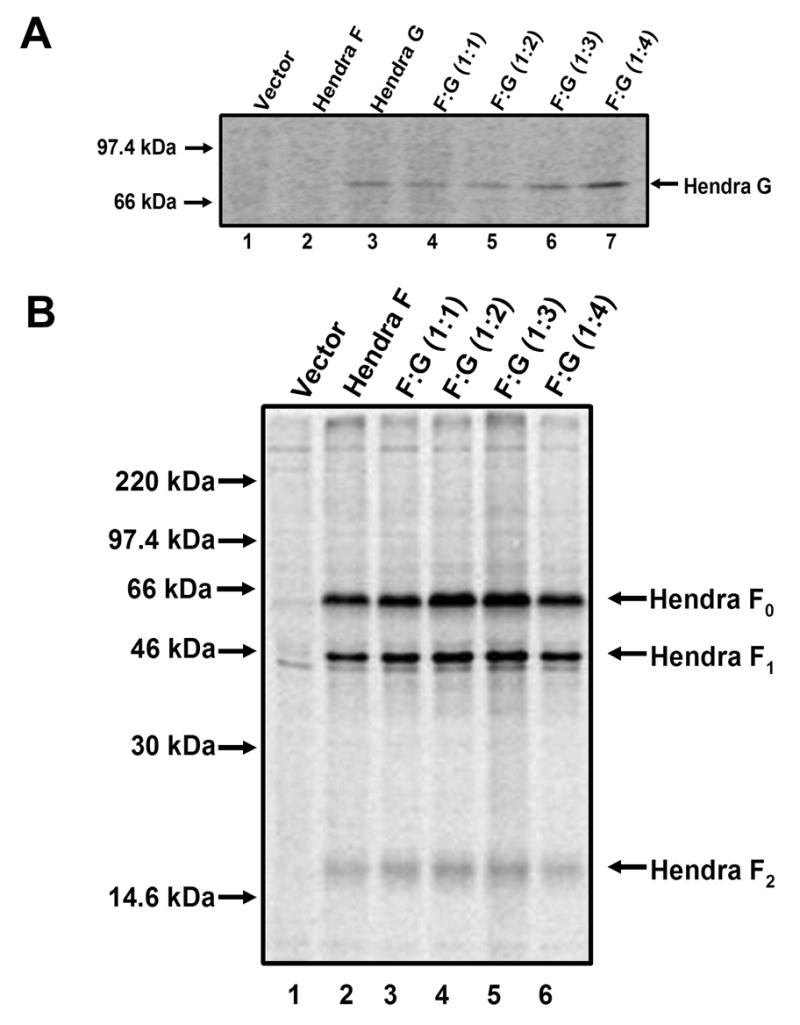
A) Vero cells were transfected with a constant amount of Hendra F plasmid and increasing amounts of Hendra G plasmid. Twenty-four hours post-transfection, cells were starved and metabolically labeled, and Hendra G was immunoprecipitated as previously described. B) Vero cells were transfected with a constant 1μg of Hendra F plasmid and up to 4 μg of Hendra G plasmid. Twenty-four hours post-transfection the cells were starved and metabolically labeled and Hendra F was immunoprecipitated as previously described.
Increased levels of cell-to-cell fusion could result from increased Hendra G protein levels affecting the overall expression of Hendra F, thus leading to greater cell-to-cell fusion. To address this, Vero cells were transfected as described above, cells were metabolically labeled as before and cell lysate was incubated with a Hendra F peptide antibody to residues 526-539. Overall expression and cleavage of the Hendra F protein into the F1 and F2 subunits were consistent between samples expressing only Hendra F (Fig. 3B, Lane 2) and those samples expressing Hendra F and increasing amounts of Hendra G (Fig. 3B, Lanes 3–6). This indicates that increasing levels of Hendra G protein does not affect Hendra F protein levels or efficiency of Hendra F proteolytic processing by cathepsin L. Immunofluoresence again confirmed that the percentage of cells expressing Hendra F was not significantly affected by the varying levels of Hendra G (data not shown).
Increasing amounts of Hendra G does not alter the surface expression of Hendra F
While our previous results demonstrated no overall Hendra F expression changes with increased Hendra G levels, it was possible that higher levels of Hendra G could alter Hendra F levels on the cell surface. Previous studies have determined that Hendra F is endocytosed from the surface of the cell to undergo proteolytic processing (Meulendyke et al., 2005). Increased levels of Hendra G could potentially maintain cleaved Hendra F on the surface and therefore enhance cell-to-cell fusion. To directly compare expression levels of Hendra F and G, immunoprecipitation of Hendra F and G were performed with the same antibody. pCAGGS - Hendra F and Hendra G constructs were HA tagged (F at the C-terminus and G at the N-terminus), and proper fusogenic activity of the tagged versions was confirmed (data not shown). Vero cells transfected with the pCAGGS- Hendra F-HA and/or Hendra G-HA constructs were metabolically labeled and surface proteins were labeled with biotin. Hendra F and G were immunoprecipitated with a monoclonal HA antibody and biotinylated surface proteins were pulled down with streptavidin beads. As the amount of Hendra G plasmid transfected into cells increased from 0.5 to 5.0 μg, the surface expression of the Hendra G protein increased, but the level of Hendra F surface expression varied only slightly (Fig. 4A, Lanes 4–10). This indicated that the higher level of cell-to-cell fusion seen with increased levels of Hendra G plasmid did not result from changes in the overall or surface expression of the Hendra F protein, but does correspond to an increase in Hendra G present at the cell surface.
Figure 4. Analysis of cell surface expression of Hendra F and G.
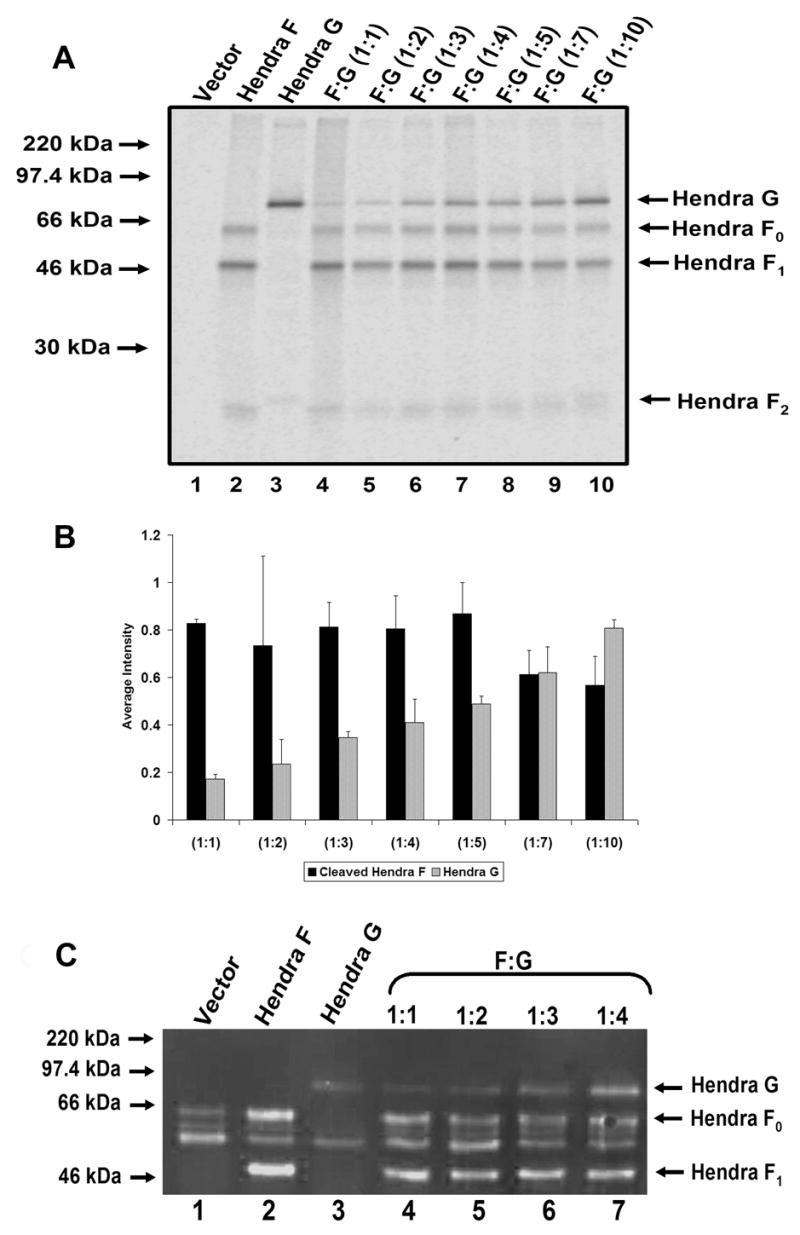
A) Vero cells were transfected with 0.5 μg pCAGGS-Hendra F HA and up to 5.0 μg pCAGGS-Hendra G HA. Cells were labeled with Tran 35S cysteine/methionine, and surface proteins were labeled with Sulfo-NHS-Biotin. Cell lysate was centrifuged, and immunoprecipitated with anti-HA antibody. Protein A sepharose beads were added for 30 minutes, washed, and stripped of protein with 10% SDS. Thirty μl streptavidin beads were added for 1 hour, and washed as previously described. Proteins were separated on a 15% SDS-PAGE gel and visualized using the Typhoon imaging system. B) Quantitation of Hendra F and G surface protein levels was determined using ImageQuant 5.2 software. The graph represents results from three independent experiments and the error bars represent the standard deviation of these experiments. C) Vero cells were transfected with a constant 1μg pCAGGS-Hendra F HA and 1–4 μg pCAGGS-Hendra G HA. Surface proteins were biotinylated and Hendra F and G were immunoprecipitated with a monoclonal HA antibody. Proteins were resolved on a 10% SDS-PAGE gel and transferred to nitrocellulose membrane. The membrane was probed with LI-COR Streptavidin IRDye 800 secondary antibody.
Quantitation of the biotinylation experiments demonstrated that at a 1:7 ratio of Hendra F : Hendra G plasmid, there is approximately a 1:1 ratio of the fusion-competent Hendra F1 + F2 to Hendra G protein on the cell surface (Fig. 4B). These data indicate that although more Hendra G plasmid is needed to achieve optimal fusion conditions, the surface protein ratio of Hendra G to cleaved Hendra F for optimal fusion is approximately 1:1, similar to findings for other paramyxoviruses such as HPIV3 (Dutch, Joshi, and Lamb, 1998).
To confirm these findings, western blots were also performed to compare the cell surface expression of Hendra F and G. Vero cells were transfected with a constant 1 μg of Hendra F-HA plasmid and 1 to 4 μg of the Hendra G-HA plasmid. Twenty-four hours post-transfection, the surface expressed proteins were labeled with biotin. Hendra F and G were immunoprecipitated with a monoclonal HA antibody. Proteins were resolved on a 10% polyacrylamide gel and transferred to nitrocellulose membrane. The membrane was probed with the LI-COR Streptavidin IRDye 800 secondary antibody to detect the biotin-labeled surface populations of Hendra F and G. As the amount of Hendra G-HA plasmid transfected increased, the amount of Hendra G-HA protein at the surface also increased (Fig. 4C, Lanes 4–7). Surface expression of Hendra F remained relatively constant regardless of the amount of Hendra G present (Fig. 4C, Lanes 4–7). The western blot confirms that although more Hendra G plasmid is needed to achieve optimal fusion conditions, an equimolar ratio of Hendra G to cleaved Hendra F protein provides for more efficient fusion.
Hendra G is more rapidly turned over than Hendra F
Our results suggest that total protein levels of Hendra G expressed from pCAGGS is decreased compared to Hendra F. This could result from low levels of transcription or protein translation, from trafficking defects or instability of the Hendra G protein, or from a combination of several factors. Transcription in a Hendra virus-infected cell would occur in a very different manner than from a pCAGGS expression plasmid and studies on transcription and mRNA stability in virus-infected cells will be pursued in future studies. To analyze translation and protein turnover of Hendra G, Vero cells were transfected with the HA-tagged Hendra G alone or both glycoproteins together at a 1:7 ratio of F: G. When Hendra G was expressed alone, a small amount of Hendra G protein was visible after the 30 minute pulse (Fig. 5A, Lane 3) and through the first 30 minutes of the chase period (Fig. 5A, Lane 4). Increased recognition of the Hendra G protein occurred at 1–2 hours post label (Fig. 5A, Lanes 5–6) with significant loss beginning at 3 hours (Fig. 5A, Lane 7). Co-expression of Hendra G with Hendra F showed a similar Hendra G expression pattern (Fig. 5B). Hendra F was detected in the F0 form from 0–1 hour (Fig. 5B, Lane 1–3). The F1 and F2 subunits become detectable at 2 hours (Fig. 5B, Lane 4), there was little decrease in F1 between 3 and 12 hours, and detection extended to 24 hours (Fig. 5B, Lane 8; (Pager, Wurth, and Dutch, 2004)). Very little detectable Hendra G was present at 24 hours (Fig. 5B, Lane 8). These results indicate that the majority of newly synthesized Hendra G is degraded within 6–12 hours after synthesis, and that the Hendra F protein does not modulate Hendra G degradation. Pulse-chase analysis was also performed on untagged versions of the proteins with similar results (data not shown). These results also suggest that Hendra G is more rapidly degraded then Hendra F. This difference in protein stability between Hendra F and G could contribute to the modulation of F and G ratios at the surface of virus-infected cells.
Figure 5. Pulse-chase analysis of the in vivo stability of Hendra G.

A) Vero cells were transfected with 3 μg pCAGGS-Hendra G HA. Twenty-four hours post-transfection, cells were starved for 30 minutes in cysteine/methioine deficient DMEM, labeled with Tran 35S cysteine/methionine for 30 minutes, and chased with cold DMEM for indicated times. Hendra G was immunoprecipitated with anti-HA antibody, samples were then washed, proteins were separated on a 15% SDS-PAGE gel, and visualized using the Typhoon imaging system. B) Pulse-chase performed with a 1:7 ratio of F:G plasmids (0.375 μg pCAGGS-Hendra F HA and 2.625 μg pCAGGS-Hendra G HA).
Degradation of Hendra G protein is not solely due to a defect in trafficking
While a portion of Hendra G clearly reaches the cell surface (Fig. 4). Increased degradation of the Hendra G protein could be explained by a folding defect that would prevent trafficking of much of the protein through the secretory pathway. To address the kinetics of Hendra G trafficking from the ER to the Golgi properly, an Endoglycosidase H (Endo H) digestion was performed. Endo H cleaves the high mannose forms of N-linked sugars present when a glycoprotein has yet to traffic through the Golgi apparatus. Thus, resistance to Endo H indicates protein trafficking through the medial Golgi. Vero cells transfected with pCAGGS Hendra G-HA were metabolically labeled for thirty minutes, chased for the indicated times and subjected to Endo H digestion. In the absence of Endo H, Hendra G ran at approximately 75 kDa while in the presence of Endo H the mobility of the protein increased and ran at ~ 65 kDa, indicating the cleavage of high mannose N-linked sugars (Fig. 6A, Lanes 1–6, Hendra GS). The results indicate that at the 0 – 1 hour time points, the Hendra G protein remains sensitive to Endo H digestion. At 2 hours post-label and continuing through 7 hours, Endo H digestion resulted in a second band that corresponds to the Endo H-resistant product, indicating that a portion of Hendra G had successfully trafficked into the Golgi (Fig. 6A, Lanes 7–14, Hendra GR). Quantitation of the Endo H resistant Hendra G species indicated that no appreciable Endo H cleavage had occurred from 0–30 minutes post label. At 1 hour post label, only 20% of the protein had become resistant while 50% had become resistant by 3 hours. At seven hours, 70% of Hendra G visualized was resistant to Endo H digestion and the level of Hendra G present in cells declined significantly (data not shown). These data suggest that both slow progression through the secretory pathway and a rapid rate of turnover modulate the Hendra G expression at the surface of the cell. Hendra G progresses slowly through the secretory pathway when compared to other paramyxovirus glycoproteins. SV5 F was found to become partially Endo H resistant by 30 minutes (Bagai and Lamb, 1995), and we have observed similar trafficking rates with Hendra F (data not shown). Therefore, these data also indicates that it is unlikely that Hendra F and G traffic through the secretory pathway together.
Figure 6. Endo H digestion of Hendra G.

Vero cells were transfected with 3 μg pCAGGS-Hendra G HA and 24 hours post-transfection the cells were starved for 30 minutes, labeled for 30 minutes, and Hendra G was immunoprecipitated using the anti-HA antibody as previously described. One sample from each time point was then incubated with Endo H overnight in a 37°C water bath. Proteins were separated via SDS-PAGE and visualized using the Typhoon imaging system.
DISCUSSION
Our data demonstrate that the ratio of Hendra G : Hendra F protein expression on cell surfaces significantly modulates membrane fusion, with maximal fusion observed when Hendra G and cleaved Hendra F are present at approximately equal levels at the cell surface. Data from both syncytia assays and luciferase reporter gene assays confirm the need for increased amounts of Hendra G plasmid, which correspond to increased Hendra G protein levels to provide optimal cell-to-cell fusion. Our results clearly show that increasing levels of Hendra G protein expression had no effect on the overall or surface expression of the Hendra F protein. Pulse-chase studies of Hendra F and Hendra G were performed to determine the stability of both of these proteins. It had been previously reported that Hendra F was stable for 24 hours (Pager, Wurth, and Dutch, 2004). However, the stability of Hendra G had not been investigated. Pulse-chase analysis of Hendra G showed that the majority of the newly synthesized protein was degraded 6 hours after the initial label and degradation was nearly complete by 12 hours. We have also demonstrated, using Endo H digestion and pulse-chase analysis that Hendra G traffics through the secretory pathway very slowly. These results indicate that both slow trafficking through the secretory pathway and more rapid turnover modulate the cell surface levels of Hendra G.
Previously reported data indicate that the Hendra F protein is present as the uncleaved F0 and the cleaved F1+F2 form on the surface of both virus-infected cells and cells transfected with plasmids expressing Hendra F (Michalski et al., 2000). Subsequent data from our lab and others have determined that endocytosis of the Hendra F and Nipah F proteins is important in the recycling of the proteins from the surface through endosomes where they are cleaved by cathepsin L (Diederich et al., 2005; Meulendyke et al., 2005; Pager and Dutch, 2005). Internalization and recycling of the Hendra F protein results in decreased Hendra F on the cell surface. Indeed, studies examining the localization of SV5 F show that the majority of the fusion protein is on the cell surface, while immunofluorescence of Hendra F shows that most of it is intracellular (Pager and Dutch, unpublished results). Since our data suggest that optimal membrane fusion occurs when the fusion and the attachment protein are present at similar levels on the cell surface, the high rate of Hendra G turnover combined with its slower trafficking may serve to prevent virions released from cells from having an overwhelming high amount of Hendra G present compared to Hendra F. This data is consistent with a study of viral proteins released from Hendra virus particles, in which detergent-released viral proteins separated by SDS-PAGE and stained with Coomassie Blue were found to have relatively equivalent amounts of Hendra G and Hendra F (Michalski et al., 2000).
In order for Hendra G that has reached the cell surface to undergo degradation, it must first be internalized. The SV5 HN attachment protein has been shown to undergo internalization that is not dependent on signals in the cytoplasmic tail or transmembrane domain (TM) (Leser, Ector, and Lamb, 1996; Leser et al., 1999). However signals in the ectodomain important for SV5 HN internalization were identified (Leser et al., 1999). A glutamic acid at the proposed interface of the TM and ectodomain appears to be required for internalization, and mutation of this residue decreases internalization of the protein (Leser et al., 1999). Studies examining endocytosis of the Nipah G protein indicated that Nipah G was internalized via bulk flow, and mutation of a dityrosine and dileucine motif in the cytoplasmic tail, which can signal for internalization (Dietrich et al., 1994; Jackson, Nilsson, and Peterson, 1993), did not affect Nipah G internalization (Vogt et al., 2005). Hendra G also contains a dityrosine and dileucine motif in the cytoplasmic tail, and the similarity between Nipah and Hendra G proteins suggests these residues are likely not important in internalization. Hendra G also contains several lysines and one dilysine motif in the cytoplasmic tail that could undergo ubiquitination, and the potential roles of these residues in degradation of the protein are currently being investigated.
Another interesting characteristic of the Hendra G protein is its slow progression through the secretory pathway compared to other paramyxovirus attachment proteins. Newcastle disease virus HN was found to be resistant to Endo H digestion after only 15 minutes (Leser et al., 1999), while SV5 and HPIV3 HN were resistant after 30 minutes (Paterson, Johnson, and Lamb, 1997; Schmitt, He, and Lamb, 1999). Hendra G becomes resistant to Endo H digestion more than 2 hours after translation, indicating that Hendra G is folding or trafficking more slowly than other paramyxovirus attachment proteins. This finding indicates that slow initial folding and subsequent trafficking of Hendra G may also contribute to the reduced cell surface levels of this important viral protein. Although Hendra G exhibits slower secretory pathway transport compared to other paramyxovirus attachment proteins, HIV Env displays a similar slow transport. HIV gp160 takes approximately 60 minutes to become Endo H resistant. This is thought to be due to the slow cleavage of the leader peptide of this type I integral membrane protein (Land, Zonneveld, and Braakman, 2003). Signal peptide cleavage would not retain Hendra G in the ER, since it is a type II integral membrane protein, but this characteristic of HIV Env does provide precedence for slow trafficking of a viral glycoprotein.
The slow trafficking of Hendra G through the secretory pathway also provides new insight into when and where paramyxovirus fusion and attachment proteins may initially interact. Previous work on paramyxoviruses such as Newcastle disease virus (NDV) and parainfluenza virus type 3 (HPIV-3) suggests that F-attachment protein interactions occur prior to the trans-Golgi or in the endoplasmic reticulum(ER), respectively (Stone-Hulslander and Morrison, 1997; Tanaka, Heminway, and Galinski, 1996). The trafficking data presented in this paper suggests that Hendra virus glycoproteins do not traffic through the secretory pathway together, as the t1/2 for Hendra F protein Endo H resistance was found to be 30 minutes (Pager, Wurth, and Dutch, 2004; Pager and Dutch, unpublished results), yet our results (Figure 6) demonstrate that it takes more than 2 hours for the majority of Hendra G to proceed through the ER and into the Golgi apparatus. These results strongly suggest that Hendra F and G traffic independently through the secretory pathway and interact only at some later point. Future experiments will be needed to identify the time and position of Hendra F interactions with Hendra G.
In this paper we have addressed the role of protein trafficking and turnover in modulating Hendra G protein levels in transiently transfected cells. However, it is certainly possible that overall Hendra G levels in virus-infected cell are modulated in additional ways, such as modulating mRNA transcript levels within the cell. In the Hendra virus non-segmented RNA genome, the Hendra F gene is present upstream of the Hendra G gene. This order suggests that there will be less Hendra G mRNA transcribed due to the nature of non-segmented viral genome transcription (Lamb, 1993). Future studies on transcript and protein levels in virus-infected cells will be needed to address this. However, our results clearly demonstrate that the Hendra glycoprotein ratios are important factors in membrane fusion, and the Hendra G protein displays unusually slow trafficking and more rapid degradation that the majority of paramyxovirus glycoproteins.
MATERIALS and METHODS
Cell Culture
Vero, Baby Hamster Kidney (BHK), HeLa and BSR cells were maintained in Dulbecco’s modified Eagle’s Media (DMEM; Gibco Invitrogen, Carlsbad, CA) supplemented with 10% Fetal Bovine Serum (FBS) and 1% penicillin/streptomycin.
Plasmid Vectors
Dr. Lin-Fa Wang of the Australian Animal Health Laboratory kindly provided vectors containing the Hendra F and Hendra G genes. Hendra F was transferred from the pUC18 vector by SalI digestion and ligated into pCAGGS digested with XhoI. Hendra G was removed from pGEM-T7 vector by NsiI and XhoI and ligated into pCAGGS digested with NsiI and XhoI (Pager, Wurth, and Dutch, 2004). Hendra F and G proteins were transiently expressed using the pCAGGS mammalian expression vector, which allows for high level of protein expression due to the presence of a chicken actin promoter (Niwa, Yamamura, and Miyazaki, 1991).
Production of Hendra F and G HA constructs
Primers were designed to include an HA tag on the C-terminus of Hendra F. Forward primer: 5′-AAAAACCCGGGATGGCTACACAAGAGGTCAGG-3′. Reverse primer with HA tag: 3′-GTGATCTGTATTATATTGGAACATACCCATACGATGTTC CAGATTACGCTTAATGAAAAAA-5′. The PCR reaction was performed with above primers using pGEM-Hendra F as a template. The correct PCR product was ligated into pCR-BluntII-TOPO (Invitrogen). The Hendra F fragment was ligated into EcoR1 digested pCAGGS. This same general procedure was used to make the HA- tagged Hendra G. The HA tag on Hendra G was added onto its N-terminus using the following primers. Forward primer: 5′-AAAACCATGTACCCATACGATGTTCCAGATTACGCTATGATG GCTGATAAATTG – 3′. Reverse primer: 5′-TTTTTTTCATTACAATCACTCTCTGAACATTG – 3′. Products were sequenced in their entirety.
Antibodies
Hendra F antipeptide antibodies were produced by Genemed Custom Peptide Antibody Service (San Francisco, CA) to residues 526-539 of the cytoplasmic tail of Hendra F. Likewise, Hendra G antipeptide antibodies were produced by Genemed Synthesis, Inc. (San Francisco, CA) to residues 19-33 of the N-terminal cytoplasmic tail of Hendra G. 12CA5 HA monoclonal antibody was kindly provided by Dr. Doug Andres (University of Kentucky).
Syncytia Assay
Subconfluent monolayers of BHK cells were transfected with pCAGGS - Hendra F and G constucts using Lipofectamine Plus reagent (Invitrogen, Carlsbad, CA) according to the manufacturer’s directions. Briefly, 2.75 total micrograms of DNA were transfected at a 1:1 to 1:10 ratio of pCAGGS-Hendra F: pCAGGS-Hendra G, along with 6ul of PLUS reagent, 4ul of Lipofectamine and 0.8mL of OPTI-MEM (Gibco, Carlsbad, CA). This mixture was added to the cells for 3–5 hours, after which cells were rinsed twice with phosphate-buffered saline (PBS) and incubated overnight in 2mL of DMEM + 10% FBS + 1% Penicillin/Streptomycin. Twenty-four hours post transfection, cells were observed for the formation of multi-nucleated cells using a Nikon TS100 microscope. Photographs were taken with the 10X objective using a Nikon digital camera.
Immunoprecipitation
Vero cells were transfected with Lipofectamine Plus reagent (Invitrogen, Carlsbad, CA) as previously described (Pager, Wurth, and Dutch, 2004) or with Lipofectamine 2000, according to the manufactures instructions. Twenty-four hours post transfection, cells were starved for 30 minutes in DMEM deficient in cysteine and methionine. Label media containing cys-/met- DMEM and Tran35S (100uCi/ml; MP Biomedicals, Inc., Irvine, CA) was added for 3 hours. Cells were washed twice in PBS and lysed in Radio Immunoprecipitation Assay (RIPA) buffer containing 100 mM Tris – HCl (pH 7.4), 150 mM NaCl, 0.1% sodium dodecyl sulfate (SDS), 1% Triton X-100, 1% deoxycholic acid, protease inhibitor [1 KalliKrein inhibitory unit of aprotinin, (Calbiochem, San Diego, CA), 1 mM phenylmethylsulfonyl fluoride (Sigma, St. Louis, MO.), 25 mM iodoacetamide (Sigma, St. Louis, MO.) and Complete protease inhibitor tablet (Roche Molecular Biochemicals, Indianapolis, IN)]. The lysate was centrifuged at 55,000 rpm for 13 minutes at 4°C. Supernatants were collected and incubated with antipeptide antibody to either Hendra F or G for three hours at 4°C, followed by a 30 minute incubation with Protein A-Sepharose (GE Healthcare, Piscataway, NJ) to immunoprecipitate proteins. Protein A-Sepharose beads were then washed 2X RIPA + 0.30 M NaCl, 2X RIPA + 0.15M NaCl and 1X with SDS Wash II (150mM NaCl, 50mM TrisHCl pH=7.4, 2.5 mM EDTA). Hendra F and G were analyzed by 15% SDS-PAGE and visualized using the Typhoon imaging system (GE Healthcare, Piscataway, NJ).
Biotinylation of surface proteins
Vero cells were transfected as previously described with Lipofectamine 2000. Cells were starved for 30 minutes in cysteine/methionine deficient DMEM. Tran35S metabolic label was added for 3–4 hours and surface proteins were labeled using Sulfo-NHS-Biotin (Pierce, Rockford, IL) at 1mg/ml. Cells were lysed in RIPA lysis buffer + protease inhibitors. Hendra F and G proteins were immunoprecipitated with antipeptide antibodies as previously described. To separate the surface population of Hendra F and G, 40ul of 10% SDS was added and the samples were boiled for 10 minutes. The SDS supernatant was transferred to a new eppendorf tube, and an additional 60ul of 10% SDS was added to each sample, which was boiled for 10 minutes. The SDS supernatant was removed to an eppendorf for a total of ~ 100ul. Ten μl of the supernatant was then removed from the 100 μl total and represents the “total” protein population. To remaining 90 μl, 30 μl of Streptavidin beads (Pierce, Rockford, IL) and 400 μl of biotinylation buffer (20mM Tris pH8, 150mM NaCl, 5mM EDTA, 1% Triton X-100, 0.2% BSA) was added for one hour with rocking at 4°C. Surface protein populations were resolved on 15% polyacrylamide gels and imaged using the Typhoon imaging system (GE Healthcare, Piscataway, NJ).
Western Blot
Vero cells were transfected as previously described in 10 cm cell culture plates with the HA-tagged version of Hendra F and G. Twenty-four hours post-transfection, cells were labeled with biotin as previously described and lysed. Lysate centrifuged at 55,000 rpm for 13 minutes, after which the supernatant was removed and 1μl of HA antibody was added to each sample. Antibody incubated for three hours at 4° C with rocking. Protein-A sepharose was added to lysate for 30 minutes and immunoprecipitation was performed as previously described. Proteins were resolved on a 10% polyacrylamide gel, and transferred to nitrocellulose using MP Transfer Salt buffer (0.24 M Glycine, 0.031 M Tris free base) overnight at 4°C at 30 volts. The nitrocellulose membrane was blocked with a 1:1 dilution of the Li-cor Odyssey blocking buffer with phosphate buffered saline for one hour. The Li-cor streptavidin IRDye800 secondary was diluted 1:20,000 in Odyssey blocking buffer and added to the membrane for 1 hour. The membrane was washed 4X for five minutes with PBS + 0.1 % Tween-20 and then analyzed via the Li-cor Odyssey system.
Endo H digestion
Vero cells were transfected with Lipofectamine 2000 with pCAGGS-Hendra F HA and Hendra G HA constructs. Twenty-four hours post-transfection, the cells were starved for 30 minutes in cys-/met- DMEM and metabolically labeled with 100μCi/ml of Tran35S cysteine/methionine for 30 minutes. The cells were washed once with PBS+ and DMEM was added for varying chase times. After the indicated chase time the cells were lysed in RIPA lysis buffer as previously described. The cell lysates were centrifuged at 55,000 rpm for 10–13 minutes and the supernatant was transferred to a new tube. Hendra F and G were immunoprecipitated using the monoclonal HA antibody, and the protein/antibody complex was isolated using Protein A Sepharose beads. Samples were washed as previously described and after the final wash, 20 μl extraction buffer (50mM Tris-HCl pH 7.4, 0.5% (w/v) SDS) was added to each sample. Samples were then boiled for 5 minutes and supernatant was transferred to a new eppendorf tube. Twenty-two μl 0.1M NaCitrate + 1mM PMSF +/− 2mM Endoglycosidase H was added to each sample and samples were incubated overnight in a 37°C water bath. Ten μl of 5X SDS sample buffer was added per sample. Samples were analyzed on a 10% SDS-PAGE and visualized with the Typhoon imaging system.
Luciferase Reporter Gene Assay
Effector Vero cells were transfected as previously described with pCAGGS Hendra F and G at ratios of 1:1 to 1:20, along with a T7 luciferase plasmid. Vero target cells were transfected with a T7 polymerase construct. Twenty-four hours post transfection, target Vero or BSR cells were removed from their plates using trypsin, spun down at 1500 rpm for 5 min, resuspended and overlaid onto Vero cells. The overlay was performed for 3 hours when BSR cells were used or 6 hours when Vero cells were used. Cells were washed 2X with PBS and Reporter Gene Lysis buffer (Pierce, Rockford, IL) added to cells for 10 minutes at −20°C. Cell lysates were centrifuged at 13,000 rpm for 1 minute at 4°C. Twenty μl of lysate was transferred to 96-well luminometer plate and assayed for luciferase activity with 100 μl luciferin by an Lomax luminometer (Molecular Devices, Sunnyvale, CA).
Immunofluroescence
Vero cells were plated on coverslips and transfected with pCAGGS alone, 0.25μg pCAGGS-Hendra F HA and 0.25–2.5μg pCAGGS-Hendra G wt or 0.25μg pCAGGS-Hendra F wt and 0.25–2.5μg pCAGGS-Hendra G HA using Lipofectamine/PLUS reagent as previously described. Twenty-four hours post transfection, cells were rinsed 3 times with PBS+/0.02%NaN3. One mL/well of 4% paraformaldehyde was added for 15 minutes. Cells were then rinsed 3 times with PBS/NaN3 and 1 mL/well of cold PBS + 1% Trition X-100 was added for 15 minutes. Cells were rinsed 3 times with PBS/NaN3 and 150 μl of Block solution (1% Normal Goat Serum + PBS/NaN3 with 0.05% Tween -20) was added for 2 hours at 4°C. After two hours, the Block solution was removed and the primary antibody (mouse anti-HA antibody, 1:2000 dilution) was added overnight. The next day, the primary antibody was removed and the coverslips were washed seven times with PBS + 0.05% Tween-20. The goat anti-mouse secondary antibody was diluted in Block 1:300 and incubated for 2 hours at 4°C. The secondary antibody was removed and the coverslips were washed seven times with PBS/0.05% Tween-20. The coverslips were mounted on slides using Vectashild + DAPI (Vector Laboratories, Inc. Burlingame, CA) and the edges were sealed with nail polish. The samples were stored at −20°C.
Acknowledgments
We thank Lin-fa Wang of the Australian Animal Health Laboratory for the Hendra F and G plasmids, Doug Andres (University of Kentucky) for the monoclonal HA antibody, and Karl-Klaus Conzelman (Max Pettenkofer Institut) for providing the BSR cells. We are also grateful to members of the Dutch lab for critically reviewing this manuscript.
This study was supported by NIAID grant A151517 to R.E.D.
Footnotes
Publisher's Disclaimer: This is a PDF file of an unedited manuscript that has been accepted for publication. As a service to our customers we are providing this early version of the manuscript. The manuscript will undergo copyediting, typesetting, and review of the resulting proof before it is published in its final citable form. Please note that during the production process errors may be discovered which could affect the content, and all legal disclaimers that apply to the journal pertain.
References
- Nipah virus outbreak(s) in Bangladesh, 2004. Wkly Epidemiol Rec. 2004;79(17):168–71. [PubMed] [Google Scholar]
- Aguilar HC, Matreyek KA, Filone CM, Hashimi ST, Levroney EL, Negrete OA, Bertolotti-Ciarlet A, Choi DY, McHardy I, Fulcher JA, Su SV, Wolf MC, Kohatsu L, Baum LG, Lee B. N-glycans on Nipah virus fusion protein protect against neutralization but reduce membrane fusion and viral entry. J Virol. 2006;80(10):4878–89. doi: 10.1128/JVI.80.10.4878-4889.2006. [DOI] [PMC free article] [PubMed] [Google Scholar]
- Bagai S, Lamb RA. Individual roles of N-linked oligosaccharide chains in intracellular transport of the paramyxovirus SV5 fusion protein. Virology. 1995;209(1):250–6. doi: 10.1006/viro.1995.1251. [DOI] [PubMed] [Google Scholar]
- Bolt G, Pedersen IR. The role of subtilisin-like proprotein convertases for cleavage of the measles virus fusion glycoprotein in different cell types. Virology. 1998;252(2):387–98. doi: 10.1006/viro.1998.9464. [DOI] [PubMed] [Google Scholar]
- Bonaparte MI, Dimitrov AS, Bossart KN, Crameri G, Mungall BA, Bishop KA, Choudhry V, Dimitrov DS, Wang LF, Eaton BT, Broder CC. Ephrin-B2 ligand is a functional receptor for Hendra virus and Nipah virus. Proc Natl Acad Sci U S A. 2005;102(30):10652–7. doi: 10.1073/pnas.0504887102. [DOI] [PMC free article] [PubMed] [Google Scholar]
- Bossart KN, Crameri G, Dimitrov AS, Mungall BA, Feng YR, Patch JR, Choudhary A, Wang LF, Eaton BT, Broder CC. Receptor binding, fusion inhibition, and induction of cross-reactive neutralizing antibodies by a soluble G glycoprotein of Hendra virus. J Virol. 2005;79(11):6690–702. doi: 10.1128/JVI.79.11.6690-6702.2005. [DOI] [PMC free article] [PubMed] [Google Scholar]
- Bossart KN, Wang LF, Eaton BT, Broder CC. Functional expression and membrane fusion tropism of the envelope glycoproteins of Hendra virus. Virology. 2001;290(1):121–35. doi: 10.1006/viro.2001.1158. [DOI] [PubMed] [Google Scholar]
- Bossart KN, Wang LF, Flora MN, Chua KB, Lam SK, Eaton BT, Broder CC. Membrane fusion tropism and heterotypic functional activities of the Nipah virus and Hendra virus envelope glycoproteins. J Virol. 2002;76(22):11186–98. doi: 10.1128/JVI.76.22.11186-11198.2002. [DOI] [PMC free article] [PubMed] [Google Scholar]
- Buchholz UJ, Finke S, Conzelmann KK. Generation of bovine respiratory syncytial virus (BRSV) from cDNA: BRSV NS2 is not essential for virus replication in tissue culture, and the human RSV leader region acts as a functional BRSV genome promoter. J Virol. 1999;73(1):251–9. doi: 10.1128/jvi.73.1.251-259.1999. [DOI] [PMC free article] [PubMed] [Google Scholar]
- Daniels P, Ksiazek T, Eaton BT. Laboratory diagnosis of Nipah and Hendra virus infections. Microbes Infect. 2001;3(4):289–95. doi: 10.1016/s1286-4579(01)01382-x. [DOI] [PubMed] [Google Scholar]
- Deng R, Wang Z, Mahon PJ, Marinello M, Mirza A, Iorio RM. Mutations in the Newcastle disease virus hemagglutinin-neuraminidase protein that interfere with its ability to interact with the homologous F protein in the promotion of fusion. Virology. 1999;253(1):43–54. doi: 10.1006/viro.1998.9501. [DOI] [PubMed] [Google Scholar]
- Deng R, Wang Z, Mirza AM, Iorio RM. Localization of a domain on the paramyxovirus attachment protein required for the promotion of cellular fusion by its homologous fusion protein spike. Virology. 1995;209(2):457–69. doi: 10.1006/viro.1995.1278. [DOI] [PubMed] [Google Scholar]
- Diederich S, Moll M, Klenk HD, Maisner A. The nipah virus fusion protein is cleaved within the endosomal compartment. J Biol Chem. 2005;280(33):29899–903. doi: 10.1074/jbc.M504598200. [DOI] [PubMed] [Google Scholar]
- Dietrich J, Hou X, Wegener AM, Geisler C. CD3 gamma contains a phosphoserine-dependent di-leucine motif involved in down-regulation of the T cell receptor. Embo J. 1994;13(9):2156–66. doi: 10.1002/j.1460-2075.1994.tb06492.x. [DOI] [PMC free article] [PubMed] [Google Scholar]
- Dutch RE, Joshi SB, Lamb RA. Membrane fusion promoted by increasing surface densities of the paramyxovirus F and HN proteins: comparison of fusion reactions mediated by simian virus 5 F, human parainfluenza virus type 3 F, and influenza virus HA. J Virol. 1998;72(10):7745–53. doi: 10.1128/jvi.72.10.7745-7753.1998. [DOI] [PMC free article] [PubMed] [Google Scholar]
- Earp LJ, Delos SE, Park HE, White JM. The many mechanisms of viral membrane fusion proteins. Curr Top Microbiol Immunol. 2005;285:25–66. doi: 10.1007/3-540-26764-6_2. [DOI] [PMC free article] [PubMed] [Google Scholar]
- Eaton BT, Broder CC, Middleton D, Wang LF. Hendra and Nipah viruses: different and dangerous. Nat Rev Microbiol. 2006;4(1):23–35. doi: 10.1038/nrmicro1323. [DOI] [PMC free article] [PubMed] [Google Scholar]
- Field H, Young P, Yob JM, Mills J, Hall L, Mackenzie J. The natural history of Hendra and Nipah viruses. Microbes Infect. 2001;3(4):307–14. doi: 10.1016/s1286-4579(01)01384-3. [DOI] [PubMed] [Google Scholar]
- Garten W, Hallenberger S, Ortmann D, Schafer W, Vey M, Angliker H, Shaw E, Klenk HD. Processing of viral glycoproteins by the subtilisin-like endoprotease furin and its inhibition by specific peptidylchloroalkylketones. Biochimie. 1994;76(3–4):217–25. doi: 10.1016/0300-9084(94)90149-x. [DOI] [PubMed] [Google Scholar]
- Goldsmith CS, Whistler T, Rollin PE, Ksiazek TG, Rota PA, Bellini WJ, Daszak P, Wong KT, Shieh WJ, Zaki SR. Elucidation of Nipah virus morphogenesis and replication using ultrastructural and molecular approaches. Virus Res. 2003;92(1):89–98. doi: 10.1016/s0168-1702(02)00323-4. [DOI] [PubMed] [Google Scholar]
- Hsu VP, Hossain MJ, Parashar UD, Ali MM, Ksiazek TG, Kuzmin I, Niezgoda M, Rupprecht C, Bresee J, Breiman RF. Nipah virus encephalitis reemergence, Bangladesh. Emerg Infect Dis. 2004;10(12):2082–7. doi: 10.3201/eid1012.040701. [DOI] [PMC free article] [PubMed] [Google Scholar]
- Jackson MR, Nilsson T, Peterson PA. Retrieval of transmembrane proteins to the endoplasmic reticulum. J Cell Biol. 1993;121(2):317–33. doi: 10.1083/jcb.121.2.317. [DOI] [PMC free article] [PubMed] [Google Scholar]
- Lamb RA. Paramyxovirus fusion: a hypothesis for changes. Virology. 1993;197(1):1–11. doi: 10.1006/viro.1993.1561. [DOI] [PubMed] [Google Scholar]
- Land A, Zonneveld D, Braakman I. Folding of HIV-1 envelope glycoprotein involves extensive isomerization of disulfide bonds and conformation-dependent leader peptide cleavage. Faseb J. 2003;17(9):1058–67. doi: 10.1096/fj.02-0811com. [DOI] [PubMed] [Google Scholar]
- Leser GP, Ector KJ, Lamb RA. The paramyxovirus simian virus 5 hemagglutinin-neuraminidase glycoprotein, but not the fusion glycoprotein, is internalized via coated pits and enters the endocytic pathway. Mol Biol Cell. 1996;7(1):155–72. doi: 10.1091/mbc.7.1.155. [DOI] [PMC free article] [PubMed] [Google Scholar]
- Leser GP, Ector KJ, Ng DT, Shaughnessy MA, Lamb RA. The signal for clathrin-mediated endocytosis of the paramyxovirus SV5 HN protein resides at the transmembrane domain-ectodomain boundary region. Virology. 1999;262(1):79–92. doi: 10.1006/viro.1999.9890. [DOI] [PubMed] [Google Scholar]
- Meulendyke KA, Wurth MA, McCann RO, Dutch RE. Endocytosis plays a critical role in proteolytic processing of the hendra virus fusion protein. J Virol. 2005;79(20):12643–9. doi: 10.1128/JVI.79.20.12643-12649.2005. [DOI] [PMC free article] [PubMed] [Google Scholar]
- Michalski WP, Crameri G, Wang L, Shiell BJ, Eaton B. The cleavage activation and sites of glycosylation in the fusion protein of Hendra virus. Virus Res. 2000;69(2):83–93. doi: 10.1016/s0168-1702(00)00169-6. [DOI] [PubMed] [Google Scholar]
- Negrete OA, Levroney EL, Aguilar HC, Bertolotti-Ciarlet A, Nazarian R, Tajyar S, Lee B. EphrinB2 is the entry receptor for Nipah virus, an emergent deadly paramyxovirus. Nature. 2005;436(7049):401–5. doi: 10.1038/nature03838. [DOI] [PubMed] [Google Scholar]
- Negrete OA, Wolf MC, Aguilar HC, Enterlein S, Wang W, Muhlberger E, Su SV, Bertolotti-Ciarlet A, Flick R, Lee B. Two key residues in ephrinB3 are critical for its use as an alternative receptor for Nipah virus. PLoS Pathog. 2006;2(2):e7. doi: 10.1371/journal.ppat.0020007. [DOI] [PMC free article] [PubMed] [Google Scholar]
- Niwa H, Yamamura K, Miyazaki J. Efficient selection for high-expression transfectants with a novel eukaryotic vector. Gene. 1991;108(2):193–9. doi: 10.1016/0378-1119(91)90434-d. [DOI] [PubMed] [Google Scholar]
- Pager CT, Craft WW, Jr, Patch J, Dutch RE. A mature and fusogenic form of the Nipah virus fusion protein requires proteolytic processing by cathepsin L. Virology. 2006;346(2):251–7. doi: 10.1016/j.virol.2006.01.007. [DOI] [PMC free article] [PubMed] [Google Scholar]
- Pager CT, Dutch RE. Cathepsin L is involved in proteolytic processing of the Hendra virus fusion protein. J Virol. 2005;79(20):12714–20. doi: 10.1128/JVI.79.20.12714-12720.2005. [DOI] [PMC free article] [PubMed] [Google Scholar]
- Pager CT, Wurth MA, Dutch RE. Subcellular localization and calcium and pH requirements for proteolytic processing of the Hendra virus fusion protein. J Virol. 2004;78(17):9154–63. doi: 10.1128/JVI.78.17.9154-9163.2004. [DOI] [PMC free article] [PubMed] [Google Scholar]
- Paterson RG, Johnson ML, Lamb RA. Paramyxovirus fusion (F) protein and hemagglutinin-neuraminidase (HN) protein interactions: intracellular retention of F and HN does not affect transport of the homotypic HN or F protein. Virology. 1997;237(1):1–9. doi: 10.1006/viro.1997.8759. [DOI] [PubMed] [Google Scholar]
- Russell CJ, Jardetzky TS, Lamb RA. Membrane fusion machines of paramyxoviruses: capture of intermediates of fusion. Embo J. 2001;20(15):4024–34. doi: 10.1093/emboj/20.15.4024. [DOI] [PMC free article] [PubMed] [Google Scholar]
- Schmitt AP, He B, Lamb RA. Involvement of the cytoplasmic domain of the hemagglutinin-neuraminidase protein in assembly of the paramyxovirus simian virus 5. J Virol. 1999;73(10):8703–12. doi: 10.1128/jvi.73.10.8703-8712.1999. [DOI] [PMC free article] [PubMed] [Google Scholar]
- Stone-Hulslander J, Morrison TG. Detection of an interaction between the HN and F proteins in Newcastle disease virus-infected cells. J Virol. 1997;71(9):6287–95. doi: 10.1128/jvi.71.9.6287-6295.1997. [DOI] [PMC free article] [PubMed] [Google Scholar]
- Sugrue RJ, Brown C, Brown G, Aitken J, Mc LRHW. Furin cleavage of the respiratory syncytial virus fusion protein is not a requirement for its transport to the surface of virus-infected cells. J Gen Virol. 2001;82(Pt 6):1375–86. doi: 10.1099/0022-1317-82-6-1375. [DOI] [PubMed] [Google Scholar]
- Takimoto T, Taylor GL, Connaris HC, Crennell SJ, Portner A. Role of the hemagglutinin-neuraminidase protein in the mechanism of paramyxovirus-cell membrane fusion. J Virol. 2002;76(24):13028–33. doi: 10.1128/JVI.76.24.13028-13033.2002. [DOI] [PMC free article] [PubMed] [Google Scholar]
- Tamm LK, Han X. Viral fusion peptides: a tool set to disrupt and connect biological membranes. Biosci Rep. 2000;20(6):501–18. doi: 10.1023/a:1010406920417. [DOI] [PubMed] [Google Scholar]
- Tanabayashi K, Compans RW. Functional interaction of paramyxovirus glycoproteins: identification of a domain in Sendai virus HN which promotes cell fusion. J Virol. 1996;70(9):6112–8. doi: 10.1128/jvi.70.9.6112-6118.1996. [DOI] [PMC free article] [PubMed] [Google Scholar]
- Tanaka Y, Heminway BR, Galinski MS. Down-regulation of paramyxovirus hemagglutinin-neuraminidase glycoprotein surface expression by a mutant fusion protein containing a retention signal for the endoplasmic reticulum. J Virol. 1996;70(8):5005–15. doi: 10.1128/jvi.70.8.5005-5015.1996. [DOI] [PMC free article] [PubMed] [Google Scholar]
- Vogt C, Eickmann M, Diederich S, Moll M, Maisner A. Endocytosis of the Nipah virus glycoproteins. J Virol. 2005;79(6):3865–72. doi: 10.1128/JVI.79.6.3865-3872.2005. [DOI] [PMC free article] [PubMed] [Google Scholar]
- Wang L, Harcourt BH, Yu M, Tamin A, Rota PA, Bellini WJ, Eaton BT. Molecular biology of Hendra and Nipah viruses. Microbes Infect. 2001;3(4):279–87. doi: 10.1016/s1286-4579(01)01381-8. [DOI] [PubMed] [Google Scholar]
- Wang LF, Yu M, Hansson E, Pritchard LI, Shiell B, Michalski WP, Eaton BT. The exceptionally large genome of Hendra virus: support for creation of a new genus within the family Paramyxoviridae. J Virol. 2000;74(21):9972–9. doi: 10.1128/jvi.74.21.9972-9979.2000. [DOI] [PMC free article] [PubMed] [Google Scholar]
- Wong KT. Emerging and re-emerging epidemic encephalitis: a tale of two viruses. Neuropathol Appl Neurobiol. 2000;26(4):313–8. doi: 10.1046/j.1365-2990.2000.00256.x. [DOI] [PubMed] [Google Scholar]
- Wong KT, Shieh WJ, Kumar S, Norain K, Abdullah W, Guarner J, Goldsmith CS, Chua KB, Lam SK, Tan CT, Goh KJ, Chong HT, Jusoh R, Rollin PE, Ksiazek TG, Zaki SR. Nipah virus infection: pathology and pathogenesis of an emerging paramyxoviral zoonosis. Am J Pathol. 2002;161(6):2153–67. doi: 10.1016/S0002-9440(10)64493-8. [DOI] [PMC free article] [PubMed] [Google Scholar]
- Yao Q, Hu X, Compans RW. Association of the parainfluenza virus fusion and hemagglutinin-neuraminidase glycoproteins on cell surfaces. J Virol. 1997;71(1):650–6. doi: 10.1128/jvi.71.1.650-656.1997. [DOI] [PMC free article] [PubMed] [Google Scholar]