Two crystal forms of the aconitase version of recombinant human IRP1 are reported.
Keywords: iron-regulatory protein 1, iron metabolism, aconitase
Abstract
Iron-regulatory proteins (IRPs) 1 and 2 are closely related molecules involved in animal iron metabolism. Both proteins can bind to specific mRNA regions called iron-responsive elements and thereby control the expression of proteins involved in the uptake, storage and utilization of iron. In iron-replete cells, IRP1, but not IRP2, binds a [4Fe–4S] cluster and functions as a cytoplasmic aconitase, with simultaneous loss of its RNA-binding ability. Whereas IRP2 is known to be involved in Fe homeostasis, the role of IRP1 is less clear; it may provide a link between citrate and iron metabolisms and be involved in oxidative stress response. Here, two crystal forms of the aconitase version of recombinant human IRP1 are reported. An X-ray fluorescence measurement performed on a gold-derivative crystal showed the unexpected presence of zinc, in addition to gold and iron. Both native and MAD X-ray data at the Au, Fe and Zn absorption edges have been collected from these crystals.
1. Introduction
In animals, two homologous cytosolic iron-regulatory proteins, IRP1 and IRP2, are involved in the metabolism of this biologically essential metal. Regulation of iron concentration is central to the cell because in the presence of molecular oxygen uncomplexed iron generates damaging reactive-oxygen intermediates such as superoxide, peroxide and hydroxyl radicals. These species can, in turn, cause numerous human pathologies including inflammation, cancer and neurodegenerative diseases (Ke & Ming Qian, 2003 ▶; Zecca et al., 2004 ▶). Both IRPs can bind to specific sequences known as iron-responsive elements (IREs) found in the untranslated regions of mRNAs that code for key proteins involved in the storage, transport and utilization of iron (Hentze & Kühn, 1996 ▶). Binding of an IRE located at the 5′ end of mRNA, as in the case of the iron-storage protein ferritin, represses its translation. On the other hand, binding at the 3′ end of several IREs, as in the case of the iron-transporting transferrin receptor, stabilizes the mRNA, thereby enhancing protein synthesis.
It has become increasingly clear that IRP1 and IRP2 represent two functionally different iron-regulatory molecules. IRP2 deletion perturbs intestinal iron absorption and brain iron distribution in mice; the protein does not bind an Fe–S cluster and is degraded in iron-overloaded cells (Meyron-Holtz et al., 2004 ▶). IRP1, on the other hand, is mostly found in normal cell cultures and in most tissues as a cytoplasmic [4Fe–4S]-containing aconitase (Meyron-Holtz et al., 2004 ▶). Levels of the latter seem to be controlled mostly by phosphorylation rather than intracellular Fe levels (Fillebeen et al., 2005 ▶). The two IRP1 activities, IRE-binding and aconitase, are mutually exclusive (Haile et al., 1992 ▶; Hirling et al., 1994 ▶) and depend on the assembly or disassembly of the Fe–S cluster (Haile et al., 1992 ▶; Hirling et al., 1994 ▶; Fillebeen et al., 2005 ▶). A better understanding of the function of both IRP1 and IRP2 in cellular iron metabolism is of great biological and medical interest. Indeed, disturbed iron homeostasis has been observed, for example, in haemochromatosis (Neonaki et al., 2002 ▶) and neurodegenerative conditions such as Alzheimer’s disease (Smith et al., 2000 ▶), Parkinson’s disease (Jellinger, 1999 ▶) and Friedreich’s ataxia (Ponka, 2004 ▶). A detailed atomic model of either IRP1 or IRP2 should help to answer questions related to the mechanisms of deficient IRP–IRE interactions in autosomal dominant iron-overload disorders (Kato et al., 2001 ▶) and hereditary hyperferritinaemia-cataract syndrome (Levi et al., 1998 ▶). Here, we report the crystallization and collection of preliminary X-ray data for the aconitase form of recombinant human IRP1.
2. Crystallization
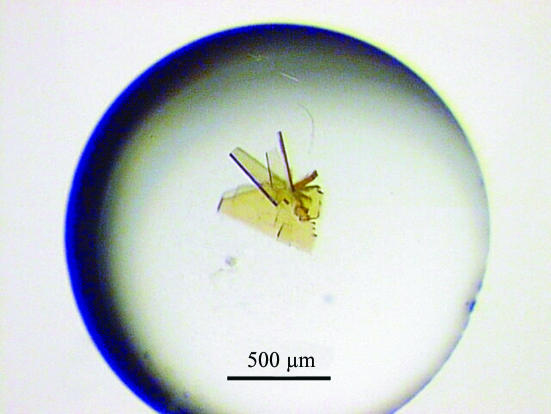
Human IRP1 was overexpressed in Escherichia coli and purified as described previously (Brazzolotto et al., 1999 ▶). Several separate purification batches were used. All crystallization experiments were performed anaerobically because the [4Fe–4S] cluster is unstable in the presence of molecular oxygen and IRP1 contains easily oxidized cysteine thiols (Brazzolotto et al., 1999 ▶). Initial conditions were obtained with the hanging-drop vapour-diffusion method in a glove box at 293 K under an anaerobic atmosphere, using the sparse-matrix sampling technique of Jancarik & Kim (1991 ▶). The protein was concentrated to 20 mg ml−1 in a buffer solution consisting of 10 mM HEPES pH 7.4 and then incubated for 2 h at 293 K with 200 µM trisodium citrate in the same buffer. Hanging drops containing 1 µl protein–citrate solution and 1 µl reservoir solution were equilibrated against 1 ml reservoir solution. Condition No. 41 of Crystal Screen I (Hampton Research), i.e. 0.1 M HEPES pH 7.5, 10%(v/v) 2-propanol and 20%(w/v) PEG 4000, produced thin plates that were covered with large clusters of needles. Crystals were improved by varying the pH and the concentration of the two precipitants. Large stable clusters of plates were obtained in 0.1 M Tris–HCl pH 8.1, 20%(v/v) 2-propanol, 16%(w/v) PEG 4000 and 2 mM sodium dithionite (Fig. 1 ▶).
Figure 1.
Hanging drop with IRP1 crystals (form 1). A single plate crystal (0.25 × 0.15 mm) was separated from this cluster and flash-cooled in a solution consisting of 0.1 M Tris–HCl pH 8.1, 20%(v/v) 2-propanol, 20%(w/v) PEG 4000, 2 mM sodium dithionite and 20%(v/v) glycerol for X-ray data collection.
Similar conditions with a 10 mg ml−1 protein concentration were used with another batch of protein, producing stacked thin plates of various thicknesses. However, they were unstable and dissolved within a few days. This problem was solved by microseeding and by using an oil layer consisting of 50%(v/v) paraffin and 50%(v/v) silicon deposited over the surface of the reservoir solution in order to reduce the vapour-diffusion rate (Chayen, 1997 ▶). Different organic solvents as well as different thicknesses of the oil layer were tested to control the rate of crystal growth. Suitable stable single crystals (crystal form 2) were obtained after 3 d with a reservoir solution containing 0.1 M Tris–HCl pH 8.1, 5%(v/v) glycerol, 16%(w/v) PEG 4000, 2 mM sodium dithionite and 250 µl oil.
3. X-ray diffraction data collection and analysis
The IRP1 crystals were flash-cooled inside the glove box in liquid propane and stored outside the box in liquid nitrogen (Vernède & Fontecilla-Camps, 1999 ▶). X-ray diffraction data sets were collected at the ID14-4 and FIP BM30a beamlines of the European Synchrotron Radiation Facility (ESRF) under a cold nitrogen stream at about 100 K (Table 1 ▶). Crystal 1 was obtained from the initial purification batch (Fig. 1 ▶), whereas crystals 2 and 3 were grown from a subsequent batch of recombinant protein. Attempts to solve the structure of IRP1 by molecular replacement using bovine mitochondrial aconitase (Lloyd et al., 1999 ▶) as a search model (22% sequence identity with IRP1) were unsuccessful. The presence of a [4Fe–4S] cluster suggested the use of the anomalous signal of Fe for phasing. Accordingly, MAD data were collected from crystal 2, but in view of the large size of the protein (98 kDa) additional sources of phasing were needed. Many soaking experiments of IRP1 crystals with heavy-atom salts were performed and for each of them X-ray diffraction data were collected. However, only a KAu(CN)2 soak provided a useful isomorphous derivative (crystal 3).
Table 1. X-ray data-collection statistics.
Values in parentheses are for the highest resolution shell.
| Crystal | 1 | 2 | 2 | 2 | 3 |
|---|---|---|---|---|---|
| ESRF beamline | ID14-4 | BM30a | BM30a | BM30a | BM30a |
| λ (Å) | 0.939 | 1.739 | 1.741 | 1.283 | 1.040 |
 / /
|
— | −6.2/6.4 (Fe) | −9.3/2.9 (Fe) | −9.7/7.5 (Zn) | −17.5/10.2 (Au) |
| Resolution (Å) | 20–1.85 | 25–2.89 | 25–2.88 | 47–2.54 | 47–2.50 |
| No. of observations | 547170 | 128429 | 115555 | 187987 | 448864 |
| Unique reflections | 270649 | 36128 | 35331 | 53181 | 59196 |
| Completeness (%) | 97.5 (92.1) | 94.5 (71.7) | 92.9 (68) | 94.6 (72.9) | 99.9 (99.8) |
| 〈I/σ(I)〉 | 8.6 (3.0) | 10.7 (2.7) | 7.7 (1.6) | 11.1 (3.3) | 13.3 (5.9) |
| Rsym† (%) | 6.0 (26.2) | 9.5 (33.6) | 13.6 (55.7) | 7.9 (23.1) | 12.5 (34.8) |
| Rmeas† (%) | 8.0 (35.0) | 11.1 (44.4) | 16.1 (74.4) | 9.2 (30.6) | 13.5 (37.5) |
R
sym = R
merge = 
 and R
meas =
 , where
  (Diederichs & Karplus, 1997 ▶).
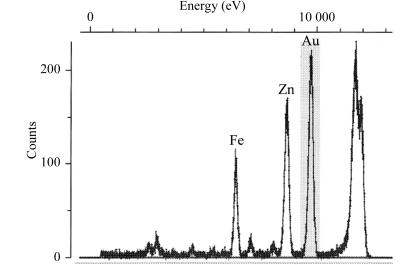
The cryogenic automated transfer system (CATS) that has been installed and developed at the FIP (BM30A) beamline of the ESRF (Ohana et al., 2004 ▶) was used to optimize the choice of crystals for data collection. Thanks to the use of this crystal-mounting robot, the time interval between testing different crystals was minimized while keeping them under cryogenic conditions during transfer from liquid nitrogen to the goniometer head. The presence of anomalous scatterers in the Au derivative was tested with a multi-channel fluorescence detector (Röntec, Germany) while exposing the crystal to an X-ray beam at a wavelength of 1.040 Å (Fig. 2 ▶). Fluorescence peaks were found not only at wavelengths specific for Fe and Au but, unexpectedly, also for Zn.
Figure 2.
X-ray fluorescence spectrum of an IRP1 Au-derivative crystal (obtained from batch 2).
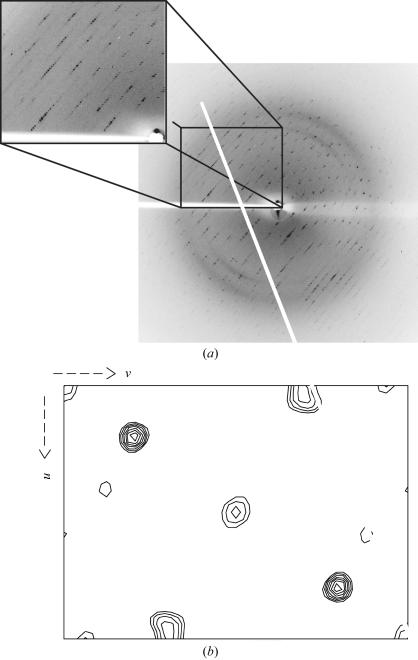
A total of five data sets were collected at different wavelengths (Table 1 ▶). For crystal 1, 400 images of high-resolution data were measured with a 188 mm IDSC Q4 detector positioned at a distance of 170 mm, using 0.5° oscillations and 1 s exposure per image. For the Au derivative, 360° of single-wavelength anomalous dispersion (SAD) data were collected at the Au absorption edge (see also Fig. 3 ▶ a) using a MAR CCD165 X-ray detector (MAR Research, Germany), with a 0.5° oscillation and 20 s exposure time per image and a crystal-to-detector distance of 150 mm. As a Zn fluorescence peak was also observed for the native crystal that was obtained from the second purification batch, three data sets were collected from this crystal: at the high- and low-energy sides of the Fe absorption edge (1.739 and 1.741 Å, respectively) and at the Zn absorption edge (1.283 Å). In each case, 180° of 0.5° oscillation images were collected using 90 s exposure time per image, a crystal-to-detector distance of 120 mm and a MAR CCD165 detector. All data were integrated, indexed and scaled with the program XDS (Kabsch, 1993 ▶).
Figure 3.
(a) Typical diffraction image and (b) Harker section (w = 1/2) of an anomalous difference Patterson map of a KAu(CN)2 derivative of human IRP1 (crystal 3).
Crystal 1 was monoclinic, space group P21, with unit-cell parameters a = 63.9, b = 215.5, c = 64.0 Å, β = 72.0°. With a calculated Matthews coefficient (V M) of 2.14 Å3 Da−1 it was concluded that the asymmetric unit contained two molecules, with a solvent content of 42.5% (Matthews, 1968 ▶). The other two crystals were orthorhombic, space group C2221, with unit-cell parameters a = 75.3, b = 103.3, c = 225.9 Å for the native crystal and a = 75.8, b = 103.2, c = 225.9 Å for the Au derivative. In this case the V M is 2.25 Å3 Da−1, with one molecule per asymmetric unit and a solvent content of 45%. Scaling of data sets and calculations of Patterson maps were performed with the CCP4 program suite (Collaborative Computational Project, Number 4, 1994 ▶). Preliminary results clearly show the presence of at least two heavy-atom sites (Fig. 3 ▶ b) which, according to the X-ray fluorescence measurements (Fig. 2 ▶), may correspond to Au, Zn and the four Fe atoms from the cubane. Phasing of the X-ray data is currently in progress.
Acknowledgments
We thank P. Carpentier (beamline FIP-BM30A) for help with synchrotron data collection at the ESRF (Grenoble).
References
- Brazzolotto, X., Gaillard, J., Pantopoulos, K., Hentze, M. W. & Moulis, J.-M. (1999). J. Biol. Chem.274, 21625–21630. [DOI] [PubMed] [Google Scholar]
- Chayen, N. (1997). J. Appl. Cryst.30, 198–202. [Google Scholar]
- Collaborative Computational Project, Number 4 (1994). Acta Cryst. D50, 760–763. [Google Scholar]
- Diederichs, K. & Karplus, P. A. (1997). Nature Struct. Biol.4, 269–275. [DOI] [PubMed] [Google Scholar]
- Fillebeen, C., Caltagirone, A., Martelli, A., Moulis, J.-M. & Pantopoulos, K. (2005). In the press. [DOI] [PMC free article] [PubMed]
- Haile, D. J., Rouault, T. A., Harford, J. B., Kennedy, M. C., Blondin, G. A., Beinert, H. & Klausner, R. D. (1992). Proc. Natl Acad. Sci. USA, 89, 11735–11739. [DOI] [PMC free article] [PubMed] [Google Scholar]
- Hentze, M. W. & Kühn, L. C. (1996). Proc. Natl Acad. Sci. USA, 93, 8175–8182. [DOI] [PMC free article] [PubMed] [Google Scholar]
- Hirling, H., Henderson, B. R. & Kühn, L. C. (1994). EMBO J.13, 453–461. [DOI] [PMC free article] [PubMed] [Google Scholar]
- Jancarik, J. & Kim, S.-H. (1991). J. Appl. Cryst.24, 409–411. [Google Scholar]
- Jellinger, K. A. (1999). Drugs Aging, 14, 115–140. [DOI] [PubMed] [Google Scholar]
- Kabsch, W. (1993). J. Appl. Cryst.26, 795–800. [Google Scholar]
- Kato, J., Fujikawa, K., Kanda, M., Fukuda, N., Sasaki, K., Takayama, T., Kobune, M., Takada, K., Takimoto, R., Hamada, H., Ikeda, T. & Niitsu, Y. (2001). Am. J. Hum. Genet.69, 191–197. [DOI] [PMC free article] [PubMed] [Google Scholar]
- Ke, Y. & Ming Qian, Z. (2003). Lancet Neurol.2, 246–253. [DOI] [PubMed] [Google Scholar]
- Levi, S., Girelli, D., Perrone, F., Pasti, M., Beaumont, C., Corrocher, R., Albertini, A. & Arosio, P. (1998). Blood, 91, 4180–4187. [PubMed] [Google Scholar]
- Lloyd, S. J., Lauble, H., Prasad, G. S. & Stout, C. D. (1999). Protein Sci.8, 2655–2662. [DOI] [PMC free article] [PubMed] [Google Scholar]
- Matthews, B. W. (1968). J. Mol. Biol.33, 491–497. [DOI] [PubMed] [Google Scholar]
- Meyron-Holtz, E. G., Ghosh, M. C., Iwai, K., LaVaute, T., Brazzolotto, X., Berger, U. V., Land, W., Ollivierre-Wilson, H., Grinberg, A., Love, P. & Rouault, T. A. (2004). EMBO J.23, 386–395. [DOI] [PMC free article] [PubMed] [Google Scholar]
- Neonaki, M., Graham, D. C., White, K. N. & Bomford, A. (2002). Biochem. Soc. Trans.30, 726–728. [DOI] [PubMed] [Google Scholar]
- Ohana, J., Jacquamet, L., Joly, J., Bertoni, A., Taunier, P., Michel, L., Charrault, P., Pirocchi, M., Carpentier, P., Borel, F., Kahn, R. & Ferrer, J.-L. (2004). J. Appl. Cryst.37, 72–77. [Google Scholar]
- Ponka, P. (2004). Ann. NY Acad. Sci.1012, 267–281. [DOI] [PubMed] [Google Scholar]
- Smith, M. A., Nunomura, A., Zhu, X., Takeda, A. & Perry, G. (2000). Antioxid. Redox Signal.2, 413–420. [DOI] [PubMed] [Google Scholar]
- Vernède, X. & Fontecilla-Camps, J. C. (1999). J. Appl. Cryst.32, 505–509. [Google Scholar]
- Zecca, L., Youdim, M. B., Riederer, P., Connor, J. R. & Crichton, R. R. (2004). Nature Rev. Neurosci.5, 863–873. [DOI] [PubMed]


