

Abstract
One hundred years after Willem Einthoven first recorded the electrocardiogram (ECG), physicians and scientists are still debating the cellular basis for the various waves of the ECG. In this review, our focus is on the cellular basis for the J, T, and U waves of the ECG. The J wave and T wave are thought to arise as a consequence of voltage gradients that develop as a result of the electrical heterogeneities that exist within the ventricular myocardium. The presence of a prominent action potential notch in epicardium but not endocardium gives rise to a voltage gradient during ventricular activation that inscribes the J wave. Transmural and apico-basal voltage gradients developing as a result of difference in the time course of repolarization of the epicardial, M, and endocardial cell action potentials, and the more positive plateau potential of the M cell contribute to inscription of the T wave. Amplification of these heterogeneities results in abnormalities of the J wave and T wave, leading to the development of the Brugada, long QT, and short QT syndromes. The basis for the U wave has long been a matter of debate. One theory attributes the U wave to mechanoelectrical feedback. A second theory ascribes it to voltage gradients within ventricular myocardium and a third to voltage gradients between the ventricular myocardium and the His–Purkinje system. Although direct evidence in support of any of these three hypotheses is lacking, recent studies involving the short QT syndrome have generated renewed interest in the mechanoelectrical hypothesis.
Keywords: heterogeneity, arrhythmias, electrophysiology, long QT, short QT, Brugada syndrome
INTRODUCTION TO THE ECG
Despite the span of more than 100 years since Willem Einthoven first recorded the electrocardiogram (ECG),1,2 physicians and scientists are still debating the cellular basis for the various waves of the ECG. Our focus in this review will be on the J, T, and U waves, the cellular basis for repolarization waves of the ECG. The J wave and T wave are thought to arise as a consequence of voltage gradients that develop as a result of the electrical heterogeneities that exist within the ventricular myocardium. The basis for the U wave has long been a matter of debate. We will explore the three prevailing theories that the U wave is (i) caused by mechanoelectrical feedback, (ii) due to voltage gradients within ventricular myocardium, or (iii) due to voltage gradients between the ventricular myocardium and the His–Purkinje system.
Electrical Heterogeneity of Ventricular Myocardium
Studies from our and other laboratories have demonstrated that ventricular myocardium is not homogeneous as previously thought, but is comprised of three electrically and functionally distinct cell types. A number of studies have highlighted regional differences in electrical properties of ventricular cells as well as differences in the response of the different cell types to pharmacological agents and pathophysiological states.3,4 Among the heterogeneities uncovered are electrical and pharmacologic distinctions between endocardium and epicardium of the canine, feline, rabbit, rat. and human heart as well as differences in the electrophysiologic characteristics and pharmacologic responsiveness of M cells located in the deep structures of the ventricles of the heart.
Ventricular epicardial and M, but not endocardial action potentials display a prominent phase 1 due to a large transient outward current (Ito), giving rise to a spike-and-dome or notched configuration. Regional differences in Ito have been demonstrated in canine, feline, rabbit, rat, and human ventricular myocytes.4 Important differences also exist in the magnitude of Ito and action potential notch between right and left ventricular epicardial and M cells with right ventricular cells (RV) displaying a much greater Ito.5,6
The hallmark of the M cell is the ability of its action potential to prolong more than that of epicardial or endocardial cells in response to a slowing of rate and/or in response to drugs with QT-prolonging actions.7 The ionic basis for these features includes the presence of a smaller, slowly activating, delayed rectifier current (IKs), a larger, late sodium current (late INa), and a larger electrogenic sodium–calcium exchange current (INa-Ca). Cells with M cell characteristics have been reported in the canine, guinea pig, rabbit, pig, and human ventricles.8
The Electrocardiographic J Wave
The presence of a prominent action potential notch in epicardium but not endocardium gives rise to a transmural voltage gradient during ventricular activation that manifests as a late delta wave following the QRS or what more commonly is referred to as a J wave9 or Osborn wave. A distinct J wave is often observed under baseline conditions in the ECG of some animal species, including dogs and baboons. Humans more commonly display a J point elevation rather than a distinct J wave. A prominent J wave in the human ECG is considered pathognomonic of hypothermia10–12 or hypercalcemia.13,14
A transmural gradient in the distribution of Ito is responsible for the transmural gradient in the magnitude of phase 1 and action potential notch, which in turn gives rise to a voltage gradient across the ventricular wall responsible for the inscription of the J wave or J point elevation in the ECG.15–17 Direct evidence in support of the hypothesis that the J wave is caused by a transmural gradient in the magnitude of the Ito-mediated action potential notch derives from experiments conducted in the arterially perfused right ventricular wedge preparation showing a correlation between the amplitude of the epicardial action potential notch and that of the J wave recorded during interventions that alter the appearance of the electrocardiographic J wave, including hypothermia, premature stimulation (restitution), and block of Ito by 4-aminopyridine (4-AP)9 (FIG. 1).
FIGURE 1.

Hypothermia-induced J wave. Each panel shows transmembrane action potentials from the epicardial (Epi) and endocardial (Endo) regions of an arterially perfused canine left ventricular wedge and a transmural ECG simultaneously recorded. (A): A small but distinct action potential notch in epicardium but not in endocardium is associated with an elevated J point at the R-ST junction (arrow) at 36°C. (B): A decrease in the temperature of the perfusate to 29°C results in an increase in the amplitude and width of the action potential notch in epicardium but not endocardium, leading to the development of a transmural voltage gradient that manifests as a prominent J wave on the ECG (arrow). (Modified from Ref. 67 with permission.)
The molecular basis for the transmural distribution of Ito has long been a subject of debate. The transmural gradient of Ito in the dog has been ascribed to a transmural distribution of (i) KCND3 gene (Kv4.3), which encodes the α subunit of the Ito channel,18 (ii) KChIP2, a β subunit that coassembles with Kv4.3,19 and (iii) IRX5, a transcriptional factor regulating KCND3.20
Transmural activation within the thin wall of the RV is relatively rapid causing the J wave to be buried inside the QRS. Thus, although the action potential notch is most prominent in right ventricular epicardium, right ventricular myocardium would be expected to contribute relatively little to the manifestation of the J wave under normal conditions. These observations are consistent with the manifestation of the J wave in ECG leads in which the mean vector axis is transmurally oriented across the left ventricle and septum. Accordingly, the J wave in the dog is most prominent in leads II, III, aVR, aVF, and mid to left precordial leads V3 through V6. A similar picture is seen in the human ECG.14,21 In addition, vectorcardiography indicates that the J wave forms an extra loop that occurs at the junction of the QRS and T loops.22 It is directed leftward and anteriorly, which explains its prominence in leads associated with the left ventricle.
The first description of the J wave appeared in the 1920s in animal experiments involving hypercalcemia.13 The first extensive description and characterization appeared 30 years later by Osborn in a study involving experimental hypothermia in dogs.23 The appearance of a prominent J wave in the clinic is typically associated with pathophysiological conditions, including hypothermia10,21 and hypercalcemia.13,14 The prominent J wave induced by hypothermia is the result of a marked accentuation of the spike-and-dome morphology of the action potential of M and epicardial cells (i.e., an increase in both width and magnitude of the notch) (FIG. 1). In addition to inducing a more prominent notch, hypothermia produces a slowing of conduction, which permits the epicardial notch to clear the QRS to manifest a distinct J wave. Hypercalcemia-induced accentuation of the J wave13,14,24 may also be explained on the basis of an accentuation of the epicardial action potential notch, possibly as a result of an augmentation of the calcium-activated chloride current and a decrease in Ica.25
A prominent action potential notch predisposes canine ventricular epicardium to all-or-none repolarization and phase 2 reentry. Under ischemic conditions and in response to sodium channel blockers, parasympathetic agonists, potassium channel blockers, and a variety of other drugs, canine ventricular epicardium exhibits an all-or-none repolarization at the end of phase 1 of the action potential, leading to a marked abbreviation of the action potential. Failure of the action potential dome to develop at some epicardial sites but not others gives rise to a marked dispersion of repolarization. Propagation of the action potential dome from sites at which it is maintained to sites at which it is abolished can cause local reexcitation of the preparation. This mechanism, called phase 2 reentry, produces a very closely coupled extrasystole, which can in turn initiate one or more cycles of circus movement reentry.4,26 The amplitude and width of the J wave provides an index of the prominence of the spike-and-dome morphology of the epicardial response, and thus may be of diagnostic value in identifying subjects predisposed to phase 2 reentry or individuals who may be inclined to develop life-threatening arrhythmias such as the Brugada syndrome or other forms of idiopathic ventricular fibrillation.27,28
Evidence in support of a role for phase 2 reentry in the initiation of polymorphic ventricular tachycardia (VT) in humans has recently been provided by Thomsen and coworkers.29 The accentuation of epicardial action potential and eventual loss of the dome underlies the ST segment elevation and arrhythmogenic substrate associated with the Brugada syndrome.30,31
The Electrocardiographic T Wave
Transmural and apico-basal heterogeneities of final repolarization of the action potential within ventricular myocardium are thought to be responsible for inscription of the T wave.32,33 Studies involving the arterially perfused wedge have shown that currents flowing down voltage gradients on either side of the M region are in large part responsible for the T wave.32
Under baseline conditions (FIG. 2A), the T wave begins when the plateau of epicardial action potential separates from that of the M cell. As epicardium re-polarizes, the voltage gradient between epicardium and the M region continues to grow giving rise to the ascending limb of the T wave. The voltage gradient between the M region and epicardium (ΔVM–Epi) reaches a peak when the epicardium is fully repolarized—this marks the peak of the T wave. On the other end of the ventricular wall, the endocardial plateau deviates from that of the M cell, generating an opposing voltage gradient (ΔVEndo–M) and corresponding current that limits the amplitude of the T wave and contributes to the initial part of the descending limb of the T wave. The voltage gradient between the endocardium and the M region reaches a peak when the endocardium is fully repolarized. The gradient continues to decline as the M cells repolarize. All gradients are extinguished when the longest M cells are fully repolarized. Under hypokalemic conditions ([K+]o = 1.5 mM) combined with an IKr blocker dl-sotalol (100 uM) (FIG. 2 B), the QT interval prolongs and a bifurcation of the T wave is apparent. The rate of repolarization of phase 3 of the action potential is slowed giving rise to smaller opposing transmural currents that cross over producing a low amplitude bifid T wave. Initially, the voltage gradient between the epicardium and M regions (M-Epi) is greater than that between endocardium and M region (Endo-M). When endocardium pulls away from the M cell, the opposing gradient (Endo-M) increases, interrupting the ascending limb of the T wave. Predominance of the M-Epi gradient is restored as the epicardial response continues to repolarize and the Epi-M gradient increases, thus resuming the ascending limb of the T wave. Full repolarization of epicardium marks the peak of the T wave. Repolarization of both endocardium and the M region contribute importantly to the descending limb.
FIGURE 2.
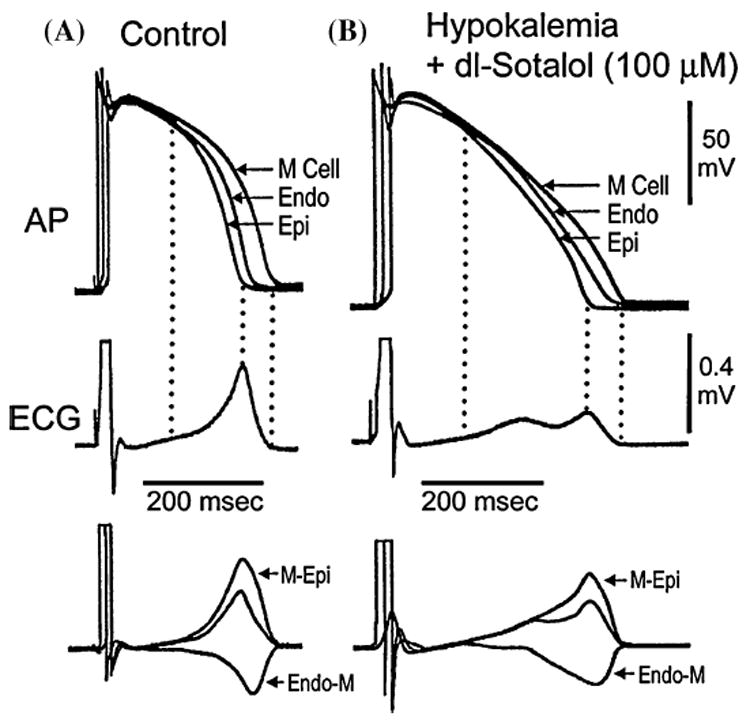
Voltage gradients on either side of the M region and the inscription of the T wave. Top: Action potentials simultaneously recorded from endocardial, epicardial, and M region sites of an arterially perfused canine left ventricular wedge preparation. Middle: ECG recorded across the wedge. Bottom: Computed voltage differences between the M-Epi action potentials (ΔVM–Epi) and between the M region and endocardium responses (ΔVEndo–M). If these traces are representative of the opposing voltage gradients on either side of the M region, responsible for inscription of the T wave, then the weighted sum of the two traces should yield a trace (middle trace in bottom grouping) resembling the ECG, which it does. (A): Control. (B): Hypokalemic conditions ([K+]o = 1.5 mM) + dl-sotalol (100 uM). Basic cycle length (BCL) = 1,000 msec. (Modified from Ref. 32 with permission.)
Thus the interplay between these opposing forces across the ventricular wall establishes the height and width of the T wave as well as the degree to which either the ascending or descending limb of the T wave is interrupted, leading to a bifurcated or notched appearance of the T wave.32 The voltage gradients result from a more positive plateau potential in the M region than in epicardium or endocardium as well as from differences in the time course of phase 3 of the action potential of the three predominant ventricular cell types.
Under normal and most long QT conditions, the epicardial response is the earliest to repolarize and the M cell action potential is often the last. Full repolarization of the epicardial action potential is coincident with peak of the T wave and repolarization of the M cells coincides with the end of the T wave. Under these conditions, the Tpeak–Tend (Tp–Te) interval provides an index of transmural dispersion of repolarization, which may prove to be a valuable prognostic tool.32,34
Recent studies support Tp–Te interval as an index of transmural dispersion and vulnerability, while others do not.35 Lubinski et al.36 demonstrated that this interval is increased in patients with congenital long QT syndrome (LQTS). Other studies suggest that Tp–Te interval may be a useful index of transmural dispersion and thus may be prognostic of arrhythmic risk under a variety of conditions.37–43 Direct evidence in support of Tp–Te as a valuable index to predict Torsade de Pointes (TdP) in patients with LQTS was provided by Yamaguchi and coworkers.44 These authors concluded that Tp–Te is more valuable than QTc and QT dispersion as a predictor of TdP in patients with acquired LQTS. Shimizu et al. demonstrated that Tp–Te, but not QTc, predicts sudden cardiac death in patients with hypertrophic cardiomyopathy.40 Most recently, Watanabe et al. demonstrated that prolonged Tp–Te is associated with inducibility as well as spontaneous development of VT in high-risk patients with organic heart disease42 and Hevia et al. linked augmented Tp–Te intervals to arrhythmogenesis in the Brugada syndrome.43 Although further studies are needed to evaluate the utility of these noninvasive indices of electrical heterogeneity and their prognostic value in the assignment of arrhythmic risk, evidence is accumulating in support of the hypothesis that transmural dispersion repolarization (TDR) rather than QT prolongation underlies the substrate responsible for the development of ventricular tachyarrhythmias.43,45–49 Transmural dispersion of repolarization should not be confused with QT dispersion of repolarization, another proposed risk factor, which remains somewhat controversial.50–52
Apico-basal repolarization gradients measured along the epicardial surface have been suggested to play a role in the registration of the T wave.33,53 In contrast, studies involving the perfused wedge suggest little or no contribution.32
The Electrocardiographic U Wave
Since Einthoven’s initial description of the U wave,2 a number of theories have been advanced to explain its origin, including (i) ventricular septum,54 (ii) papillary muscles,55 (iii) negative afterpotentials,56,57 (iv) Purkinje system,58,59 (v) early or delayed afterdepolarizations,57 or (vi) mechanoelectrical feedback.60,61
Although the most popular hypothesis ascribes the U wave to delayed repolarization of the His–Purkinje system,58,59 the small mass of the specialized conduction system is difficult to reconcile with the sometimes very large U wave deflections reported in the literature. In 1996 we suggested that the M cells, more abundant in mass and possessing delayed repolarization characteristics similar to those of Purkinje fibers, may be responsible for the inscription of the pathophysiologic U wave.62 More recent findings employing the perfused wedge clearly indicate that what many clinicians refer to as an accentuated or inverted U wave is not a U wave, but rather a second component of the T wave whose descending or ascending limb (especially during hypokalemia) is interrupted (FIG. 3).63,64 While delayed repolarization of the M cells contributes to the inscription of the second component of the T2 (pathophysiologic U wave), it is unlikely that it is responsible for the normal U wave.
FIGURE 3.
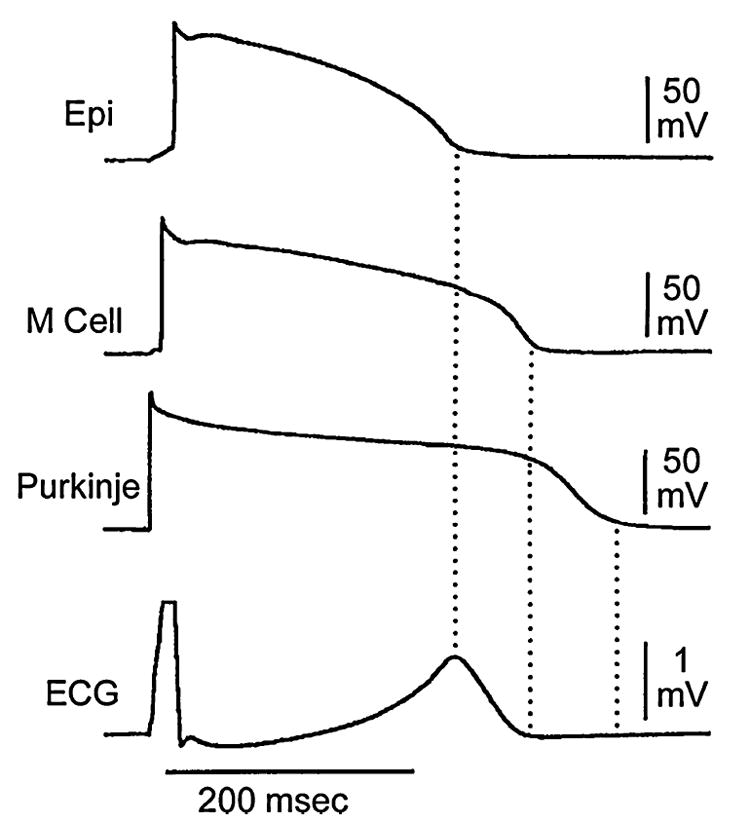
Correlation of transmembrane and electrocardiographic activity. Action potentials from epicardium (Epi), midmyocardium (M), and subendocardial Purkinje were recorded simultaneously with a transmural ECG from a canine arterially perfused left ventricular wedge preparation. Note that although repolarization of the subendocardial Purkinje fiber occurs after that of the M cell, it does not register on the ECG. BCL = 2,000 msec. (Modified from Ref. 32 with permission.)
Repolarization of the His–Purkinje system as the basis for the U wave was suggested by Hoffman, Cranefield, and Lepeshkin58 and by Watanabe and coworkers.59 In support of this hypothesis, repolarization of the Purkinje system is temporally aligned with the expected appearance of the U wave in the perfused wedge preparation (FIG. 3).64 The lack of a U wave in the wedge is likely related to a low density of the Purkinje system in the dog. A test of this hypothesis awaits the availability of an experimental model displaying a prominent U wave (most animal species do not manifest a U wave).
Another hypothesis that endures despite lack of direct experimental and clinical evidence is that the normal U wave is associated with the mechanical activity of the heart (mechanoelectrical feedback). This hypothesis, first proposed by Lepeshkin57 and more recently highlighted by Surawicz,65 emphasizes the coincidence between the start of the U wave and the second heart sound, suggesting that stretch of the myocardium by rapid ventricular filling following opening of the atrioventricular (AV) valves generates delayed afterpotentials that are responsible for the inscription of the normal electrocardiographic U wave.
Indirect evidence in support of this hypothesis derives from the dramatic separation of the T and U waves in the short QT syndrome (FIG. 4).66 The patient whose ECG is pictured in FIGURE 4 was linked to a mutation in hERG, leading to a prominent gain of function in IKr. The increase in IKr is responsible for the abbreviation of the ventricular myocardial action potential and thus the QT interval. Because IKr is also a major repolarizing current in Purkinje fibers, one would expect a comparable abbreviation of the Purkinje action potential. If the Purkinje system is responsible for inscription of the U wave, one would expect the U wave to abbreviate in parallel with the T wave. Its failure to do so suggests an alternative hypothesis, namely the possibility of a mechanoelectrical mechanism. Studies are under way to characterize the mechanical function of the heart in patients with the short QT syndrome. If temporal relationships for the opening of the aortic and atrioventricular valves remain largely unchanged, the U wave would be expected to retain its position and separate from the T wave. Such findings would provide further support for the mechanoelectrical hypothesis, which maintains that the U wave is due to stretch-induced delayed afterdepolarization caused by distension of the ventricular wall during rapid ventricular filling.
FIGURE 4.
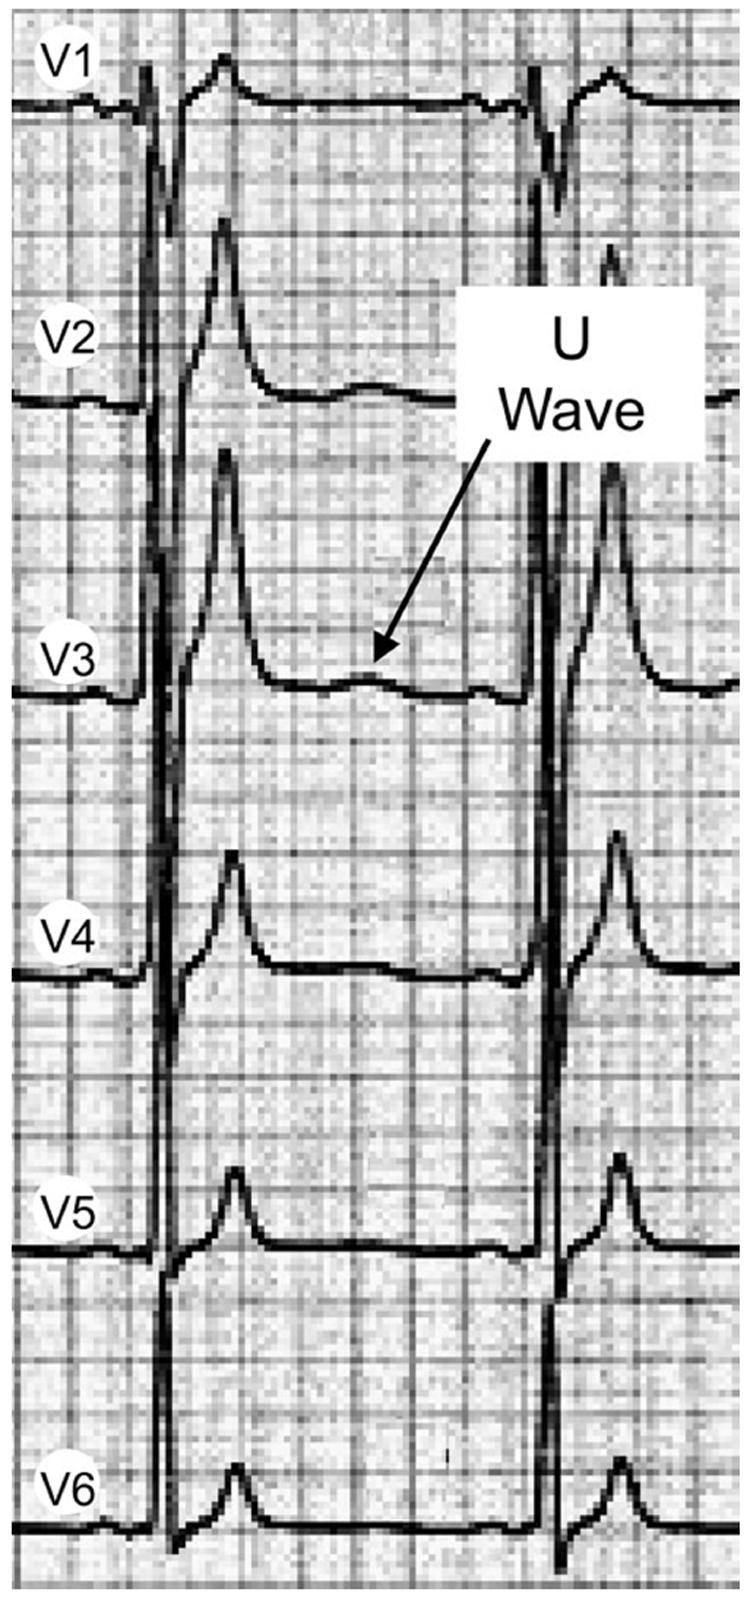
Precordial ECG leads recorded from a patient with the short QT syndrome showing a prominent separation of the T and U waves. (Modified from Ref. 68 with permission.)
SUMMARY
Available data suggest that transmural heterogeneities in the early phases of the action potential inscribe the J wave, and transmural and apico-basal heterogeneities in final repolarization of the action potential inscribe the T wave of the ECG. Amplification of these heterogeneities of repolarization underlies the development of life-threatening cardiac arrhythmias. Although the basis for the U wave is still evolving, recent data have renewed interest in a mechanoelectrical mechanism, which maintains that the U wave is due to stretch-induced delayed afterdepolarizations caused by distension of the ventricular wall during rapid filling.
Acknowledgments
This study was supported by NIH Grant HL 47678 and the Masons of New York State and Florida.
References
- 1.Einthoven W. The galvanometric registration of the human electrocardiogram, likewise a review of the use of the capillary electrometer in physiology. Pflügers Arch. 1903;99:472–480. [Google Scholar]
- 2.Einthoven W. Ueber die Deutung des Electrokardiogramms. Pflügers Arch. 1912;149:65–86. [Google Scholar]
- 3.Antzelevitch C, Shimizu W, Yan GX, et al. The M cell: its contribution to the ECG and to normal and abnormal electrical function of the heart. J Cardiovasc Electrophysiol. 1999;10:1124–1152. doi: 10.1111/j.1540-8167.1999.tb00287.x. [DOI] [PubMed] [Google Scholar]
- 4.Antzelevitch C, Dumaine R. Electrical heterogeneity in the heart: physiological, pharmacological and clinical implications. In: Page E, Fozzard HA, Solaro RJ, editors. Handbook of Physiology. The Heart. Oxford University Press; New York: 2002. pp. 654–692. [Google Scholar]
- 5.Di Diego JM, Sun ZQ, Antzelevitch C. Ito and action potential notch are smaller in left vs. right canine ventricular epicardium. Am J Physiol. 1996;271:H548–H561. doi: 10.1152/ajpheart.1996.271.2.H548. [DOI] [PubMed] [Google Scholar]
- 6.Volders PG, Sipido KR, Carmeliet E, et al. Repolarizing K+ currents ITO1 and IKs are larger in right than left canine ventricular midmyocardium. Circulation. 1999;99:206–210. doi: 10.1161/01.cir.99.2.206. [DOI] [PubMed] [Google Scholar]
- 7.Sicouri S, Antzelevitch C. A subpopulation of cells with unique electrophysiological properties in the deep subepicardium of the canine ventricle: the M cell. Circ Res. 1991;68:1729–1741. doi: 10.1161/01.res.68.6.1729. [DOI] [PubMed] [Google Scholar]
- 8.Antzelevitch C, Shimizu W. Cellular mechanisms underlying the Long QT syndrome. Curr Opin Cardiol. 2002;17:43–51. doi: 10.1097/00001573-200201000-00007. [DOI] [PubMed] [Google Scholar]
- 9.Yan GX, Antzelevitch C. Cellular basis for the electrocardiographic J wave. Circulation. 1996;93:372–379. doi: 10.1161/01.cir.93.2.372. [DOI] [PubMed] [Google Scholar]
- 10.Clements SD, Hurst JW. Diagnostic value of ECG abnormalities observed in subjects accidentally exposed to cold. Am J Cardiol. 1972;29:729–734. doi: 10.1016/0002-9149(72)90178-6. [DOI] [PubMed] [Google Scholar]
- 11.Thompson R, Rich J, Chmelik F, Nelson WL. Evolutionary changes in the electrocardiogram of severe progressive hypothermia. J Electrocardiol. 1977;10:67–70. doi: 10.1016/s0022-0736(77)80034-4. [DOI] [PubMed] [Google Scholar]
- 12.RuDusky BM. The electrocardiogram in hypothermia—the J wave and the Brugada syndrome. Am J Cardiol. 2004;93:671–672. doi: 10.1016/j.amjcard.2003.10.065. [DOI] [PubMed] [Google Scholar]
- 13.Kraus F. Ueber die wirkung des kalziums auf den kreislauf. Dtsch Med Wochenschr. 1920;46:201–203. [Google Scholar]
- 14.Sridharan MR, Horan LG. Electrocardiographic J wave of hypercalcemia. Am J Cardiol. 1984;54:672–673. doi: 10.1016/0002-9149(84)90273-x. [DOI] [PubMed] [Google Scholar]
- 15.Antzelevitch C, Sicouri S, LUKAS A, et al. Regional differences in the electrophysiology of ventricular cells: physiological and clinical implications. In: Zipes DP, Jalife J, editors. Cardiac Electrophysiology: From Cell to Bedside. 2. W.B. Saunders Co; Philadelphia: 1995. pp. 228–245. [Google Scholar]
- 16.Litovsky SH, Antzelevitch C. Transient outward current prominent in canine ventricular epicardium but not endocardium. Circ Res. 1988;62:116–126. doi: 10.1161/01.res.62.1.116. [DOI] [PubMed] [Google Scholar]
- 17.Liu DW, Gintant GA, Antzelevitch C. Ionic bases for electrophysiological distinctions among epicardial, midmyocardial, and endocardial myocytes from the free wall of the canine left ventricle. Circ Res. 1993;72:671–687. doi: 10.1161/01.res.72.3.671. [DOI] [PubMed] [Google Scholar]
- 18.Zicha S, Xiao L, Stafford S, et al. Transmural expression of transient outward potassium current subunits in normal and failing canine and human hearts. J Physiol. 2004;561:735–748. doi: 10.1113/jphysiol.2004.075861. [DOI] [PMC free article] [PubMed] [Google Scholar]
- 19.Rosati B, Pan Z, Lypen S, et al. Regulation of KChIP2 potassium channel beta subunit gene expression underlies the gradient of transient outward current in canine and human ventricle. J Physiol. 2001;533:119–125. doi: 10.1111/j.1469-7793.2001.0119b.x. [DOI] [PMC free article] [PubMed] [Google Scholar]
- 20.Costantini DL, Arruda EP, Agarwal P, et al. The homeodomain transcription factor Irx5 establishes the mouse cardiac ventricular repolarization gradient. Cell. 2005;123:347–358. doi: 10.1016/j.cell.2005.08.004. [DOI] [PMC free article] [PubMed] [Google Scholar]
- 21.Eagle K. Images in clinical medicine. Osborn waves of hypothermia. N Engl J Med. 1994;10:680. doi: 10.1056/NEJM199403103301005. [DOI] [PubMed] [Google Scholar]
- 22.Emslie-Smith D, Sladden GE, Stirling GR. The significance of changes in the electrocardiogram in hypothermia. Br Heart J. 1959;21:343–351. doi: 10.1136/hrt.21.3.343. [DOI] [PMC free article] [PubMed] [Google Scholar]
- 23.Osborn JJ. Experimental hypothermia: respiratory and blood pH changes in relation to cardiac function. Am J Physiol. 1953;175:389–398. doi: 10.1152/ajplegacy.1953.175.3.389. [DOI] [PubMed] [Google Scholar]
- 24.Sridharan MR, Johnson JC, Horan LG, et al. Monophasic action potentials in hypercalcemic and hypothermic “J” waves—a comparative study. Am Fed Clin Res. 1983;31:219. [Google Scholar]
- 25.Di Diego JM, Antzelevitch C. High [Ca2+]-induced electrical heterogeneity and extrasystolic activity in isolated canine ventricular epicardium: phase 2 reentry. Circulation. 1994;89:1839–1850. doi: 10.1161/01.cir.89.4.1839. [DOI] [PubMed] [Google Scholar]
- 26.Antzelevitch C. In vivo human demonstration of phase 2 reentry. Heart Rhythm. 2005;2:804–806. doi: 10.1016/j.hrthm.2005.05.013. [DOI] [PMC free article] [PubMed] [Google Scholar]
- 27.Yan GX, Antzelevitch C. Cellular basis for the Brugada Syndrome and other mechanisms of arrhythmogenesis associated with ST segment elevation. Circulation. 1999;100:1660–1666. doi: 10.1161/01.cir.100.15.1660. [DOI] [PubMed] [Google Scholar]
- 28.Shu J, Zhu T, Yang L, et al. ST-segment elevation in the early repolarization syndrome, idiopathic ventricular fibrillation, and the Brugada syndrome: cellular and clinical linkage. J Electrocardiol. 2005;38(Suppl):26–32. doi: 10.1016/j.jelectrocard.2005.06.006. [DOI] [PubMed] [Google Scholar]
- 29.Thomsen PE, Joergensen RM, Kanters JK, et al. Phase 2 reentry in man. Heart Rhythm. 2005;2:797–803. doi: 10.1016/j.hrthm.2005.04.023. [DOI] [PubMed] [Google Scholar]
- 30.Antzelevitch C, Brugada P, Brugada J, et al. Brugada Syndrome. A decade of progress. Circ Res. 2002;91:1114–1119. doi: 10.1161/01.res.0000046046.53721.90. [DOI] [PubMed] [Google Scholar]
- 31.Antzelevitch C, Brugada P, Brugada J, et al. The Brugada Syndrome: from bench to bedside. Blackwell Futura; Oxford: 2005. [Google Scholar]
- 32.Yan GX, Antzelevitch C. Cellular basis for the normal T wave and the electrocardiographic manifestations of the long QT syndrome. Circulation. 1998;98:1928–1936. doi: 10.1161/01.cir.98.18.1928. [DOI] [PubMed] [Google Scholar]
- 33.Janse MJ, Sosunov EA, Coronel R, et al. Repolarization gradients in the canine left ventricle before and after induction of short-term cardiac memory. Circulation. 2005;112:1711–1718. doi: 10.1161/CIRCULATIONAHA.104.516583. [DOI] [PubMed] [Google Scholar]
- 34.Antzelevitch C. The M cell Invited editorial comment. J Cardiovasc Pharmacol Ther. 1997;2:73–76. doi: 10.1177/107424849700200109. [DOI] [PubMed] [Google Scholar]
- 35.Van Huysduynen BH, Swenne CA, Bax JJ, et al. Dispersion of repolarization in cardiac resynchronization therapy. Heart Rhythm. 2005;2:1286–1293. doi: 10.1016/j.hrthm.2005.08.031. [DOI] [PubMed] [Google Scholar]
- 36.Lubinski A, Lewicka-Nowak E, Kempa M, et al. New insight into repolarization abnormalities in patients with congenital long QT syndrome: the increased transmural dispersion of repolarization. Pacing Clin Electrophysiol. 1998;21:172–175. doi: 10.1111/j.1540-8159.1998.tb01083.x. [DOI] [PubMed] [Google Scholar]
- 37.Wolk R, Stec S, Kulakowski P. Extrasystolic beats affect transmural electrical dispersion during programmed electrical stimulation. Eur J Clin Invest. 2001;31:293–301. doi: 10.1046/j.1365-2362.2001.00817.x. [DOI] [PubMed] [Google Scholar]
- 38.Tanabe Y, Inagaki M, Kurita T, et al. Sympathetic stimulation produces a greater increase in both transmural and spatial dispersion of repolarization in LQT1 than LQT2 forms of congenital long QT syndrome. J Am Coll Cardiol. 2001;37:911–919. doi: 10.1016/s0735-1097(00)01200-6. [DOI] [PubMed] [Google Scholar]
- 39.Frederiks J, Swenne CA, Kors JA, et al. Within-subject electrocardiographic differences at equal heart rates: role of the autonomic nervous system. Pflügers Arch. 2001;441:717–724. doi: 10.1007/s004240000487. [DOI] [PubMed] [Google Scholar]
- 40.Shimizu M, Ino H, Okeie K, et al. T-peak to T-end interval may be a better predictor of high-risk patients with hypertrophic cardiomyopathy associated with a cardiac troponin I mutation than QT dispersion. Clin Cardiol. 2002;25:335–339. doi: 10.1002/clc.4950250706. [DOI] [PMC free article] [PubMed] [Google Scholar]
- 41.Takenaka K, Shimizu TAI, et al. Exercise stress test amplifies genotype-phenotype correlation in the LQT1 and LQT2 forms of the long-QT syndrome. Circulation. 2003;107:838–844. doi: 10.1161/01.cir.0000048142.85076.a2. [DOI] [PubMed] [Google Scholar]
- 42.Watanabe N, Kobayashi Y, Tanno K, et al. Transmural dispersion of repolarization and ventricular tachyarrhythmias. J Electrocardiol. 2004;37:191–200. doi: 10.1016/j.jelectrocard.2004.02.002. [DOI] [PubMed] [Google Scholar]
- 43.Castro HJ, Antzelevitch C, Tornes BF, et al. T peak–T end and T peak–T end dispersion as risk factors for ventricular techycardia/ventricular fibrillation in patients with the Brugada syndrome. J Am Coll Cardiol. 2006;47(9):1828–1834. doi: 10.1016/j.jacc.2005.12.049. [DOI] [PMC free article] [PubMed] [Google Scholar]
- 44.Yamaguchi M, Shimizu M, Ino H, et al. T wave peak-to-end interval and QT dispersion in acquired long QT syndrome: a new index for arrhythmogenicity. Clin Sci (Lond) 2003;105:671–676. doi: 10.1042/CS20030010. [DOI] [PubMed] [Google Scholar]
- 45.Antzelevitch C, Belardinelli L, Zygmunt AC, et al. Electrophysiologic effects of ranolazine: a novel anti-anginal agent with antiarrhythmic properties. Circulation. 2004;110:904–910. doi: 10.1161/01.CIR.0000139333.83620.5D. [DOI] [PMC free article] [PubMed] [Google Scholar]
- 46.Di Diego JM, Belardinelli L, Antzelevitch C. Cisapride-induced transmural dispersion of repolarization and torsade de pointes in the canine left ventricular wedge preparation during epicardial stimulation. Circulation. 2003;108:1027–1033. doi: 10.1161/01.CIR.0000085066.05180.40. [DOI] [PubMed] [Google Scholar]
- 47.Antzelevitch C. Drug-induced Channelopathies. In: Zipes DP, Jalife J, editors. Cardiac Electrophysiology From Cell to Bedside. 4. W.B. Saunders; New York: 2004. pp. 151–157. [Google Scholar]
- 48.Belardinelli L, Antzelevitch C, VOS MA. Assessing predictors of drug-induced Torsade de Pointes. Trends Pharmacol Sci. 2003;24:619–625. doi: 10.1016/j.tips.2003.10.002. [DOI] [PubMed] [Google Scholar]
- 49.Fenichel RR, Malik M, Antzelevitch C, et al. Drug-induced Torsade de Pointes and implications for drug development. J Cardiovasc Electrophysiol. 2004;15:475–495. doi: 10.1046/j.1540-8167.2004.03534.x. [DOI] [PMC free article] [PubMed] [Google Scholar]
- 50.Batchvarov V, Malik M. Measurement and interpretation of QT dispersion. Prog Cardiovasc Dis. 2000;42:325–344. doi: 10.1053/pcad.2000.0420325. [DOI] [PubMed] [Google Scholar]
- 51.Antzelevitch C, Shimizu W, Yan GX, Sicouri S. Cellular basis for QT dispersion. J Electrocardiol. 1998;30(Suppl):168–175. doi: 10.1016/s0022-0736(98)80070-8. [DOI] [PubMed] [Google Scholar]
- 52.Malik M, Acar B, Gang Y, et al. QT dispersion does not represent electrocardiographic interlead heterogeneity of ventricular repolarization. J Cardiovasc Electrophysiol. 2000;11:835–843. doi: 10.1111/j.1540-8167.2000.tb00061.x. [DOI] [PubMed] [Google Scholar]
- 53.Cohen IS, Giles WR, Noble D. Cellular basis for the T wave of the electrocardiogram. Nature. 1976;262:657–661. doi: 10.1038/262657a0. [DOI] [PubMed] [Google Scholar]
- 54.Zuckerman R, Cabrera-Cosio E. La ondu U. Arch Inst Cardiol Mex. 1947;17:521–532. [PubMed] [Google Scholar]
- 55.Furbetta D, Bufalari A, Santucci F, Solinas P. Abnormality of the U wave and the T-U segment of the electrocardiogram: the syndrome of the papillary muscles. Circulation. 1956;14:1129–1137. doi: 10.1161/01.cir.14.6.1129. [DOI] [PubMed] [Google Scholar]
- 56.Nahum LH, Hoff HE. The interpretation of the U wave of the electrocardiogram. Am Heart J. 1939;17:585–598. [Google Scholar]
- 57.Lepeschkin E. Genesis of the U wave. Circulation. 1957;15:77–81. doi: 10.1161/01.cir.15.1.77. [DOI] [PubMed] [Google Scholar]
- 58.Hoffman BF, Cranefield PF. Electrophysiology of the Heart. McGraw-Hill; New York: 1960. [Google Scholar]
- 59.Watanabe Y. Purkinje repolarization as a possible cause of the U wave in the electrocardiogram. Circulation. 1975;51:1030–1037. doi: 10.1161/01.cir.51.6.1030. [DOI] [PubMed] [Google Scholar]
- 60.Lab MJ. Contraction-excitation feedback in myocardium: physiologic basis and clinical revelance. Circ Res. 1982;50:757–766. doi: 10.1161/01.res.50.6.757. [DOI] [PubMed] [Google Scholar]
- 61.Choo MH, Gibson DG. U waves in ventricular hypertrophy: possible demonstration of mechano-electrical feedback. Br Heart J. 1986;55:428–433. doi: 10.1136/hrt.55.5.428. [DOI] [PMC free article] [PubMed] [Google Scholar]
- 62.Antzelevitch C, Nesterenko VV, Yan GX. The role of M cells in acquired long QT syndrome, U waves and torsade de pointes. J Electrocardiol. 1996;28(Suppl):131–138. doi: 10.1016/s0022-0736(95)80038-7. [DOI] [PubMed] [Google Scholar]
- 63.Shimizu W, Antzelevitch C. Sodium channel block with mexiletine is effective in reducing dispersion of repolarization and preventing Torsade de Pointes in LQT2 and LQT3 models of the long-QT syndrome. Circulation. 1997;96:2038–2047. doi: 10.1161/01.cir.96.6.2038. [DOI] [PubMed] [Google Scholar]
- 64.Yan GX, Antzelevitch C. Cellular basis for the normal T wave and the electrocardiographic manifestations of the long QT syndrome. Circulation. 1998;98:1928–1936. doi: 10.1161/01.cir.98.18.1928. [DOI] [PubMed] [Google Scholar]
- 65.Surawicz B. U wave: facts, hypotheses, misconceptions, and misnomers. J Cardiovasc Electrophysiol. 1998;9:1117–1128. doi: 10.1111/j.1540-8167.1998.tb00890.x. [DOI] [PubMed] [Google Scholar]
- 66.Brugada R, Hong K, Dumaine R, et al. Sudden death associated with short-QT syndrome linked to mutations in HERG. Circulation. 2004;109:30–35. doi: 10.1161/01.CIR.0000109482.92774.3A. [DOI] [PubMed] [Google Scholar]
- 67.Yan GX, Antzelevitch C. Cellular basis for the electrocardiographic J wave. Circulation. 1995;92:I–71. doi: 10.1161/01.cir.93.2.372. Abstract. [DOI] [PubMed] [Google Scholar]
- 68.Gaita F, Giustetto C, Bianchi F, et al. Short QT Syndrome: a familial cause of sudden death. Circulation. 2003;108:965–970. doi: 10.1161/01.CIR.0000085071.28695.C4. [DOI] [PubMed] [Google Scholar]