

Abstract
The delayed and selective vulnerability of post-ischemic hippocampal CA1 pyramidal neurons correlates with a lack of recovery of normal protein synthesis. Recent evidence implicates sequestration of translational machinery into protein aggregates and stress granules as factors underlying persistent translation arrest in CA1 neurons. However, the relationship between protein aggregates and stress granules during brain reperfusion is unknown. Here we investigated the colocalization of protein aggregates and stress granules using immunofluorescence microscopy and pair-wise double labeling for ubiquitin/TIA-1, ubiquitin/small ribosomal protein S6, and TIA-1/S6. We evaluated the rat dorsal hippocampus at 1, 2 or 3 days reperfusion following a 10 min global brain ischemic insult. At 1 day reperfusion, ubiquitin-containing aggregates (ubi-protein clusters) occurred in neurons but did not colocalize with stress granules. At 2 days reperfusion, only in CA1, cytoplasmic protein aggregates colocalized with stress granules, and ubiquitin-containing inclusions accumulated in the nuclei of CA1 pyramidal neurons. Functionally, a convergence of stress granules and protein aggregates would be expected to sustain translation arrest and inhibit clearance of ubiquinated proteins, both factors expected to contribute to CA1 pyramidal neuron vulnerability.
Keywords: brain ischemia and reperfusion, protein aggregates, stress granules, TIA-1, translation arrest, ubiquitin
Introduction
A lack of recovery of normal protein synthesis correlates with the selective death of hippocampal CA1 neurons following global brain ischemia and reperfusion (I/R) (Hossmann, 1993). Recent evidence points to the partitioning of ribosomes into translationally nonfunctional subcellular structures, including protein aggregates (PAs) and stress granules (SGs), as potential causes for the lack of recovery of normal protein synthesis in reperfused CA1 (reviewed in DeGracia and Hu, 2006).
PAs form as a result of I/R damage to intracellular proteins. Initially in reperfusion, ubiquitin-containing clusters of misfolded/damaged proteins (ubi-protein clusters) occur in all post-ischemic neurons. Ubi-protein clusters transform, by as yet undetermined mechanisms, into PAs, the latter of which persist exclusively in CA1 until the point of CA1 pyramidal cell death (Hu et al., 2000; Hu et al., 2001; Liu et al., 2005A; Liu et al., 2005B). The process of cotranslational aggregation links PAs to CA1 translation arrest. Here, dysfunction of cotranslational chaperone activity following I/R is postulated to result in misfolding of nascent peptides, leading to their aggregation and to the subsequent trapping of ribosomes and other translation factors in insoluble complexes (Liu et al., 2005B).
SGs are punctate cytoplasmic structures that form in response to a variety of cellular stresses following the phosphorylation of the alpha subunit of eukaryotic initiation factor 2 [eIF2α; phospho-form, eIF2α (P)] (Kedersha et al., 1999; reviewed in Kedersha and Anderson, 2002). SGs contain the small ribosomal subunit (40S), several initiation factors, poly-adenylated mRNAs, and several mRNA binding proteins including TIA-1 and HuR (reviewed in Anderson and Kedersha 2006). SGs are thought to sequester and protect mRNAs during periods of stress-induced translation arrest (Nover et al., 1989), and to perform functions related to cytoplasmic mRNA metabolism (Anderson and Kedersha 2006). Following global I/R, ribosomal protein S6, as a marker of the small ribosomal subunit (40S), was observed to be exclusively sequestered in SGs only in CA1 at 4 hr reperfusion following resuscitation from a 10 min cardiac arrest (Kayali et al., 2005).
Hence, both PAs and SGs can plausibly contribute to the prolongation of translation arrest in CA1 pyramidal neurons. However, the question remains if there is a relationship between SGs and PAs. Each may contribute to translation arrest in parallel, but an interaction between PAs and SGs has not been ruled out (DeGracia and Hu, 2006). Thus, we report here studies of pair-wise colocalization of ubiquitin, a marker of PAs, and TIA-1 and the 40S protein S6, as markers of SGs. Our main finding was that, at 2 days reperfusion, exclusively in CA1 pyramidal neurons, PAs colocalized with SGs. Functionally, a convergence of SGs and PAs would be expected to sustain translation arrest and prevent clearance of PAs, and both of these factors may contribute to the selective vulnerability of CA1 pyramidal neurons.
Materials and Methods
Materials
TIA-1 goat IgG primary antiserum (sc-1751) was purchased from Santa Cruz Biotechnology, Inc. (Santa Cruz, CA). Mouse monoclonal S6 ribosomal protein antiserum (#2317) was purchased from Cell Signaling Technology, Inc. (Beverly, MA, U.S.A.). Rabbit polyclonal antibody to ubiquitin (RPCA-Ubi) was purchased from Proteome Resources, L.L.C. (Englewood, CO). Alexa FluorR 488 donkey anti-goat IgG, Alexa FluorR 555 donkey anti-rabbit IgG and Alexa FluorR 555 anti-mouse IgG were purchased from Molecular Probes (Eugene, OR, U.S.A.). Fluoro-Jade was purchased from Histochem, Inc., Jefferson, AR. All other chemicals were reagent grade.
Animal groups
All animal experiments were approved by the Wayne State University Animal Investigation Committee and were conducted following the Guide for the Care and Use of Laboratory Animals (National Research Council, revised 1996). All efforts were made to reduce animal suffering and minimize the total number of animals used. Global forebrain ischemia was induced using the bilateral carotid artery (two-vessel) occlusion and hypovolemic hypotension (2VO/HT) model of Smith et al., (1984). Male Long Evan rats (275–300g) were initially anesthetized with 5% halothane, and anesthesia was maintained at 2% halothane in 100% O2 using a face mask through the duration of the experiment. Rectal temperature was maintained at 37 ± 0.5°C by a homeostatic blanket system (Harvard Apparatus) during ischemia and for the first 1 hr of reperfusion. Mean arterial pressure (MAP) was monitored in real time via tail artery access. The common carotids were isolated and lassoed bilaterally. Blood gas measurements ensured pH = 7.4 ± 0.1, pO2 > 80 mmHg and pCO2 = 35 ± 5 mmHg immediately prior to the initiation of ischemia. Blood was withdrawn, via femoral arterial access, into a 10cc syringe to MAP = 50 mmHg and carotids clamped using microaneurism clips. Blood was further withdrawn to maintain MAP at 40 mmHg for the 10 min duration of ischemia. Following ischemia, blood was reinfused at a rate of 5 ml/min. All cut-down wounds were sutured, and anesthesia and temperature control were maintained for 1 hr following surgery. Post-surgical animals were housed in a 12 hr light/dark cycle and provided food and water access during the reperfusion period. Animals displaying frank necrosis, weight loss > 15% initial body weight/day, or sustained seizure activity were excluded from the study. Our overall survival rate for the reperfused groups was 75%. Experimental groups (n=3 per group) were: nonischemic controls (NIC), 10 min ischemia and 24 hr reperfusion (1DR), 10 min ischemia and 48 hr reperfusion (2DR), and 10 min ischemia and 72 hr reperfusion (3DR).
At appropriate times, animals were transcardially perfused, and fifty micron slices through the dorsal hippocampus were obtained via vibratome and stored at –20°C in cryostat solution until used, as previously described (DeGracia et al., 2006).
General Cell Staining
For toluidine blue staining, slide-mounted slices were washed x3 in 1X PBS and air dried overnight. Sections were dehydrated in a graded ethanol series and then incubated in a 10% toluidine blue in 100% ethanol solution for 1 hr at room temperature. Slides were washed in a graded ethanol series followed by 100% xylene. Slides were then cover slipped with Permount for viewing. Fluoro-Jade staining was performed exactly as described in Schmued et al., (1997). Fluoro-Jade slides were examined using FITC excitation and emission wavelengths.
Immunohistochemistry
Double-labeling immunohistochemistry was performed as previously described (Kayali et al., 2005; DeGracia et al., 2006). Pair-wise double staining of ubiquitin and TIA-1, ubiquitin and S6, and TIA-1 and S6 were performed on adjacent, 50 micron tissue sections. Primary antisera dilutions were: anti-TIA-1, 1:100; anti-S6, 1:50; anti-ubiquitin, 1:200. Secondary antisera dilutions were 1:300 in 1 % normal donkey serum in PBS containing 0.3% Triton X-100. Slides were examined on an Axioplan 2 Imaging System (Carl Zeiss, Oberkochen, Germany) equipped with an ApoTome, and optical sectioning was performed using the X63 oil immersion objective to generate z-stacks as previously described (Kayali et al., 2005, DeGracia et al., 2006). Fluorescent micrographs shown in the figures are orthographic projections of 3.75 micron z-stacks (15 x 0.25 micron optical sections) unless otherwise stated.
Quantitative analysis of colocalization
“Yellow channels” were constructed from orthographic projections of acquired z-stacks of CA1, and colocalization, in discreet spots, of paired antigens was quantified in BioImage Intelligent Quantifier, as previously described (Kayali et al., 2005; DeGracia et al., 2006).. Variables measured in yellow channels included spot coordinates, spot area and spot density, which were used to calculate total number of spots and total spot density. These were further normalized per the number of cells in each image for the experimental groups to give values for the “number of spots per cell” and the average “density per spot”, as shown in the graphs.
Discreet spots were generally not observed in CA3, so a semi-quantitative measure of the colocalization of ubiquitin with either S6 or TIA-1 was achieved by taking the integrated density of the entire yellow channel, normalized to the number of cells in each image to produce a value of “density per cell”. These measurements were made using NIH ImageJ (Abramoff et al., 2004).
All quantitative data from the experimental groups was compared by ANOVA followed by LSD post hoc with statistical significance set at p < 0.05.
Microdissection of CA1 and CA3
The above experimental groups were repeated (n=4 per group). Following the respective durations of reperfusion, animals were euthanized in 5% halothane, decapitated, and brains dissected and snap frozen in dry ice and ethanol. Hippocampal CA1 and CA3 were dissected, under a dissecting microscope, from semi-frozen slices obtained from a coronal section of the brain cut approximately −2.30 mm to −3.80 mm posterior to Bregma (Paxinos and Watson, 1998). The CA3 region was separated by a vertical cut slightly medial to the curve of the CA3 followed by a second vertical cut at the lateral edge of the dorsal hippocampus. Surrounding cortex was removed to provide isolated CA3. The CA1 region was separated from the DG by a roughly horizontal cut passing through the obliterated hippocampal fissure which is delineated by a continuous line of large, cross-sectioned blood vessels. The corpus callosum on the superior surface was removed to complete the isolation of CA1. The resulting tissue dissections were weighed and then hand-homogenized on ice and further processed as described below. For a single rat, bilateral dissections of CA1 and CA3 gave 3–7 mg wet weight per each region.
Subcellular Fractionation of microdissected CA1 and CA3
The PER-NEN Nuclear Isolation Kit (Pierce Biotechnology, Rockford, IL) was used immediately on microdissected CA1 and CA3 as per manufacturer instructions, modified to include a 1:50 dilution of protease inhibitor cocktail (P8340, Sigma Chemical Co, St. Louis, MO), and 8U/ml RNAsein (Ambion Inc., Austin, TX) to the kit reagent solutions. The resulting fractions included the cytosolic fraction (CF), the nucleoplasmic fraction (NF), and an insoluble pellet. To detect PAs via Western blot, as has been previously reported (Hu et al., 2000), the insoluble pellet was resuspended by sonicating in 0.5 ml of 20 mM Tris, pH 7.6, 0.2 M Sucrose, 2% Triton X-100, 1 mM DTT, 5 mM MgCl2, 400 mM KCl, 1 mM EDTA, 2 mM EGTA, 100 mM NaF, 0.5 mM Na orthovanadate, 20 mM β-glycerophosphate, 10 mM tetrasodium pyrophosphate, 1:50 Sigma Prot inhibitor cocktail, and 2 mM benzamidine. The resulting suspension was rocked at 4°C for 1 hour, followed by centrifugation at 10,000xg, 4°C for 10 min. The resulting pellets (insoluble fraction, IF) were resuspended in 25 microliters of phosphate buffered saline and 1:50 Sigma protease inhibitor cocktail. Fractions IF were then pooled for all animals in each experimental group for each of CA1 and CA3 (n = 4 per region per group). Protein concentrations from fraction were determined by the Folin phenol reagent method.
Western Blotting
Fractions CF, NF and IF were run on 10% SDS-PAGE gels, at 50 μg per lane, electroblot transferred to nitrocellulose (Schleicher and Schuell, BA85, 0.45 micron) and Western blotted for TIA-1, S6 and ubiquitin as previously described (DeGracia et al, 2006). Primary antisera dilutions were: TIA-1, 1:250; S6, 1:200; ubiquitin, 1:1500. For loading controls, gels were subjected to silver staining after electroblot transfer (Plus-One Silver Stain Kit, GE Healthcare). Immunoblots and silver stains were analyzed by scanning densitometry (Intelligent Quantifier, v 4.0, BioImage, Jackson, MI).
Results
Cell Death in CA1
Validation of CA1 pyramidal cell death was performed by Toluidine Blue and Fluoro-Jade staining. At 3DR, CA1 pyramidal neurons were dead (Figure 1B), and there was no detectable loss of neurons in CA3 (Figure 1D). We did not observe loss of neurons in hippocampal dentate gyrus or cortical layers II/III, V, or VI (data not shown). Fluoro-Jade produced no staining in control hippocampus (Figure 1E), but did stain the CA1 region at 3DR (Figure 1F, between arrowheads and Figure 1G). We also observed cell death in the hilar region (arrow, Figure 1F), as had been previously reported (Hsu and Buzsaki, 1993). Thus, as is well established (e.g. Smith et al., 1984; Hu et al., 2000, 2001), the 2VO/HT model produced the expected CA1 cell death.
Figure 1.
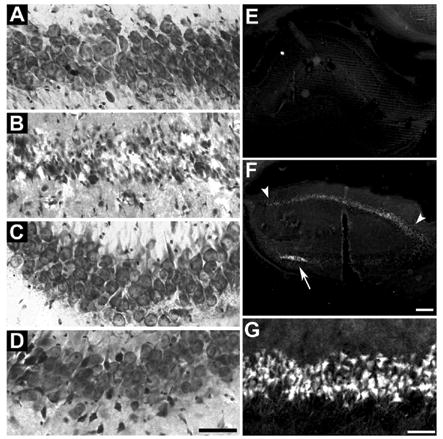
Validation of cell death in hippocampal CA1. Toluidine blue staining of 50 micron sections through dorsal hippocampus of: (A) nonischemic control (NIC) CA1, (B) 10 min ischemia plus 72 hr reperfusion (3DR) in CA1, (C) NIC CA3 and (D) 3DR CA3. Fluoro-Jade staining of: (E) low power (2.5X objective) of entire right hippocampus of NIC, (F) entire right hippocampus at 3DR, and (G) high power of CA1 pyramidal cell layer at 3DR. In panel F, arrowheads mark the extent of the stained CA1 pyramidal layer, and arrow points to dead neurons of the hilus of the dentate gyrus. Scale bar in D is 50 microns and applies to panels AD. Scale bar in F is 200 microns and applies to panels E and F. Scale bar in G is 50 microns.
Immunofluorescence results
Systematic analyses were performed for the following regions: hippocampal CA1, CA3 and dentate gyrus, and layers II/III, V, and VI of sensorimotor cerebral cortex at the level of the dorsal hippocampus. Most of the results shown here are for CA1 and CA3, since cerebral cortex and dentate gyrus, both areas resistant to the duration of ischemia used here, behaved like CA3.
Stress Granule Staining
We previously described S6 and TIA-1 staining in neurons (Kayali et al., 2005). SGs have now been independently described in rat brain (Kim et al., 2006). The present study reproduced our previously observed staining patterns and extended our previous observations of S6/TIA-1-containing SGs by assessing these to the point of cell death in reperfused CA1 (Figure 2).
Figure 2.
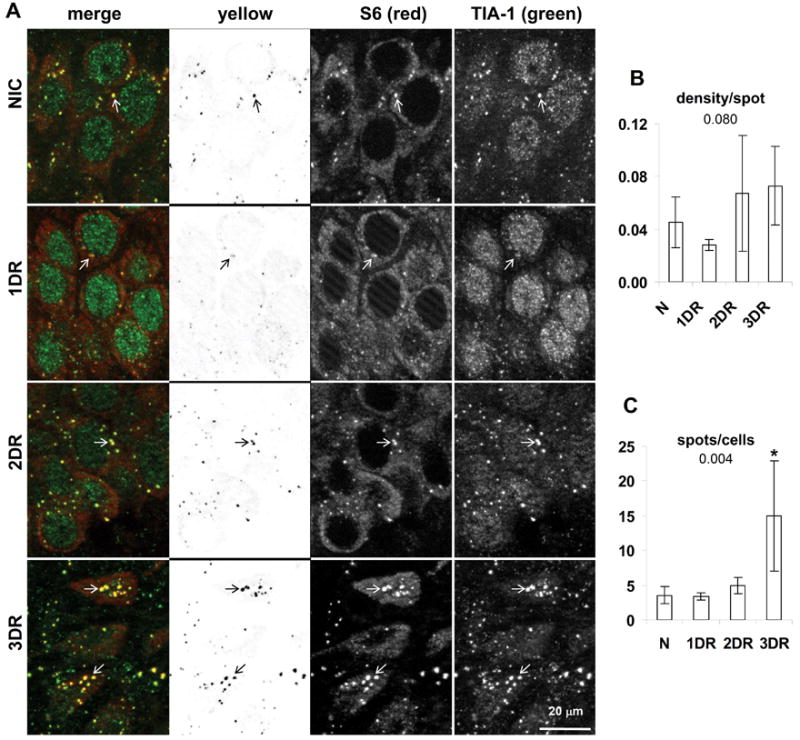
Colocalization of S6 and TIA-1 in hippocampal CA1. (A) Fluorescent photomicrographs of CA1 pyramidal layer of representative samples from experimental groups as indicated. Images are derived from orthographic projections of fifteen 0.25 micron thick optical sections of 3.75 micron z-stacks taken under 63X oil immersion. Columns are: First, merged (red) and (green) channels as labeled; second, yellow channel; third, red channel; fourth, green channel. Scale bar in bottom right panel of A is 20 microns and applies to all panels in A. Marking conventions: open arrows point to SGs. (B) “Density per spot” detected in yellow channels is the sum of the density of all detected spots divided by the total number of detected spots in the yellow channel and hence is a measure of the average density per particle. (C) “Spots per cell” is the total number of detected spots in the yellow channel divided by the total number of cells in the image, and hence represents the average number of spots per cell. Graphs show the mean ± standard deviation for these values from micrographs derived from at least 3 separate animals, and typically containing 30–35 cells per image. Numbers under graph title are the ANOVA p value. Asterisks represent LSD post hoc p < 0.05 as compared to the NIC group. Abbreviations used are: nonischemic control (NIC); 10 min ischemia plus 24 hr reperfusion (1DR); 10 min ischemia plus 48 hr reperfusion (2DR); 10 min ischemia plus 72 hr reperfusion (3DR).
Here we report two findings. First, there was a trend (ANOVA p = 0.08) towards decreased intensity of the S6/TIA-1 colocalization at 1DR in CA1 (Figure 2B), but not in CA3 (Figure 5B, third graph), or any other brain region (data not shown). Granules of both S6 and TIA-1 decreased in intensity at this time point (Figure 2A, 1DR, compare green and red channels to other groups). Second, the remnants of the CA1 neurons at 3DR, which were clearly dead cells, contained about 4 times more SGs per cell than the other groups (Figure 2C). These data suggest some type of change is initiated by 1 day reperfusion leading ultimately to an increase in the number of SGs by the time CA1 cells died. Alone these observations are not wholly informative, but in combination with the ubiquitin colocalization (see below), it is clear that SGs in CA1 neurons undergo radical modification as these cells approach their demise.
Figure 5.
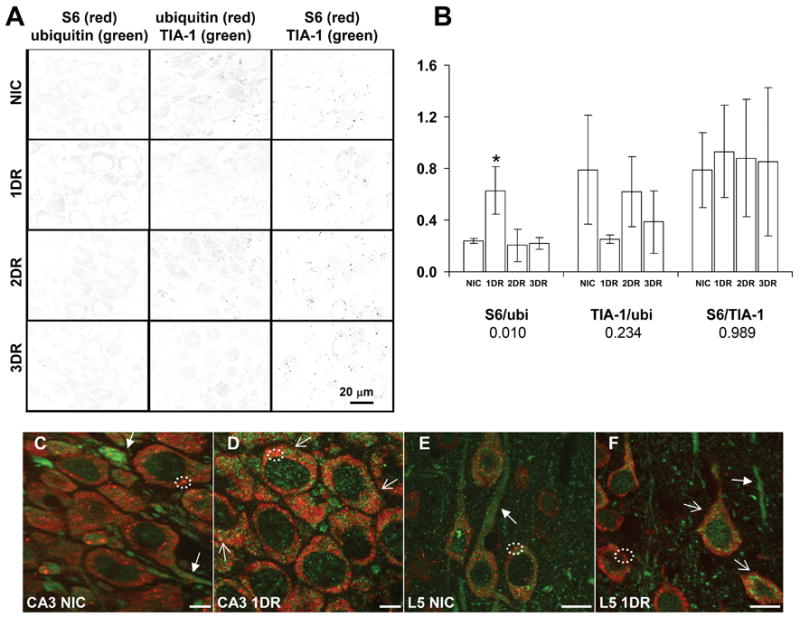
Colocalization of S6/ubiquitin, TIA-1/ubiquitin and S6/TIA-1 in hippocampal CA3 and cerebral cortex. (A) Each column of panels shows representative samples of yellow channels derived from merged images of pair-wise double staining as indicated in image labels. Scale bar in lower right panel is 20 microns and applies to all panels in A. (B) Total image density minus background, divided by the number of cells in each image. Bars are mean ± standard deviation for at least 3 images derived from separate animals of each experimental group. As in Figures 2–4, numbers under title are ANOVA p values and asterisks (*) denote samples with LSD post hoc p < 0.05 as compared to NIC group. (C) Merged image of S6 and ubiquitin staining of NIC CA3. (D) Merged image of S6 and ubiquitin staining of 1DR CA3. (E) Merged image of S6 and ubiquitin staining of NIC layer V of cerebral cortex. (F) Merged image of S6 and ubiquitin staining of 1DR layer V of cerebral cortex. In panels C-F, closed arrows point to ubiquitin immunoreactivity in dendrites. Open arrows point to cytoplasmic ubiquitin-containing aggregates observed in most neurons at 1DR. Circles denote S6 granules in the cytoplasm which colocalize with TIA-1 (e.g. as in Figure 2) and hence are stress granules. Scale bars for CA3 images in C and D are 10 microns, and for layer V in E and F are 20 microns. Abbreviations for experimental groups are as in the legend to Figure 2.
S6 and ubiquitin colocalization
Figure 3 shows representative micrographs of S6 and ubiquitin double staining in CA1, and Figure 5C-F shows this in CA3 and layer V of cerebral cortex. In controls, ubiquitin showed a fine granular staining throughout the cytoplasm, and was very prominent in larger dendrites (Figure 3A, NIC, star; Figures 5C and E, closed arrows). A scattered particulate staining of ubiquitin in the nucleus was consistent with the known nuclear ubiquitin-proteasome system (von Mikecz, 2006). Very rarely, larger particles of ubiquitin were observed in a neuron cytoplasm (Figure 3A, NIC, closed arrow). Because both S6 and ubiquitin gave relatively strong and homogeneous signals in the cytoplasm, when the yellow channel was calculated, it generated an image that defined the cytoplasm, speckled throughout with faint particles (Figure 3A, NIC and Figure 5A, NIC S6/ubiquitin). This colocalization did not represent ubiquitination of S6 as we were unable to visualize any but the 32 kDa form of S6 by Western blot (Figure 6). The cytoplasmic particles of S6, presumably SGs, did not show significantly greater colocalization with ubiquitin than the general background (Figure 3A, NIC, open arrows).
Figure 3.
Colocalization of S6 and ubiquitin in hippocampal CA1. (A) Fluorescent photomicrographs of CA1 pyramidal layer of representative samples from experimental groups as indicated. Columns are as indicated and as described in the legend of Figure 2. Marking conventions: open arrows point to SGs; closed arrows point to ubiquitin particles; asterisk mark nuclear ubiquitin inclusions; star marks ubiquitin staining in large dendrites. (B) and (C) Quantitative analysis of particles in yellow channel. Variables measured, abbreviations and scale bars are as indicated in Figure 2 legend.
Figure 6.
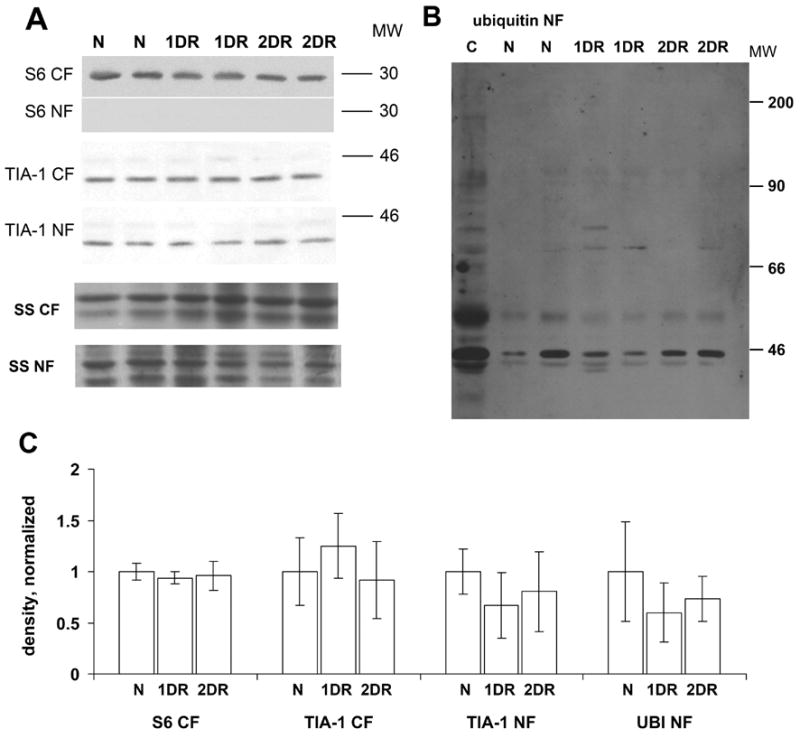
Westerns blots of cytoplasmic and nuclear fractions from microdissected CA1. (A) Western blots of TIA-1 and S6 in the cytoplasmic fraction (CF) and nucleoplasmic fraction (NF), as indicated in the figure. Shown are representative samples from 2 animals in each experimental group. Bottom two gels are silver stain (SS) loading controls of the respective fractions. (B) Ubiquitin Western blot of CA1 NF from of experimental groups. Lane marked “C” is unfractionated whole hippocampus from a nonischemic control (N) animal, run as an input control. Molecular weight (MW) markers are indicated at the right of the images in both panels. Abbreviations for experimental groups are as listed in Figure 2. (C) Densitometry for gels shown in A and B, normalized to loading controls. All bars are mean ± standard deviation as labeled. For all four graphs, ANOVA p > 0.05.
At one day reperfusion (1DR), large concentrations of ubiquitin staining were prominent in the cytoplasm, the so-called “ubi-protein clusters” (Hu et al., 2000; reviewed in DeGracia and Hu, 2006) (Figure 3A, 1DR, closed arrows). These were roughly spherical particles of 0.5–2 microns that further clustered into shapes such as ridges around the nuclear periphery, or venous structures extending into the larger dendrites, and they were present against the fine particulate ubiquitin background (also seen in Figure 5D and 5F). Most notably, these did not substantially colocalize with the cytoplasmic particles of S6 (marked by open arrows, Figure 3A, 1DR). When the density per spot per cell was calculated, this was no different between NICs and 1DR CA1 samples (Figure 2B). Thus, two prominent and distinctly different particles were detected in the reperfused neurons at 1DR: SGs and ubi-protein clusters. These were also present in CA3 pyramidal neurons and in cortical neurons, as illustrated by the layer V neurons of the cerebral cortex (Figure 5D and 5F, respectively). As in CA1, the ubi-protein clusters did not substantially colocalize with cytoplasmic S6 particles in CA3 or cortical neurons.
Although the SGs and ubi-protein clusters did not increase their degree of colocalization at 1DR, for both CA1 and CA3, there was generally an increase in the background colocalization of S6 and ubiquitin. This is seen in the yellow channel of CA1 at 1DR (Figure 2A, 1DR, yellow channel), and seen quantitatively in Figure 5B (first graph) for CA3. The increase in colocalization of S6 and ubiquitin at 1DR in CA3 was the only statistically significant change identified in CA3 in the present study. This change, however, was transient, in CA3, and by 2DR, the colocalization intensity of S6 and ubiquitin in CA3 returned to control levels (Figure 5B).
At 2DR, the pattern of S6 and ubiquitin co-staining in CA1 strongly diverged from other brain regions. First, we note that, whereas there was no loss of cell number, the 2DR cells were shrunken ~ 40% compared to NIC and 1DR CA1 neurons (compare 2DR to NIC, Figure 3A). The colocalization of S6 and ubiquitin at 2DR and 3DR reverted back to control patterns in CA3 (Figure 5A), dentate gyrus and cerebral cortex (data not shown). In CA1, however, there was a significant increase in S6 and ubiquitin colocalization that occurred almost exclusively in the form of cytoplasmic particles that were clearly visible as dark spots in the yellow channel of the 2DR sample (Figure 3, 2DR). This resulted in an increase in both the “density/spot” and the number of “spots per cell” in CA1 (Figure 3B and C, respectively). Additionally at 2DR, larger circular inclusions of ubiquitin were visible in the nuclei of CA1 pyramidal neurons (Figure 3, 2DR, asterisks).
At 3DR, the intensity of colocalized particles of S6 and ubiquitin decreased compared to 2DR, but was still higher than controls. Similar to the case with S6 and TIA-1 colocalization, the number of “spots per cell” was highest at 3DR.
TIA-1 and ubiquitin colocalization
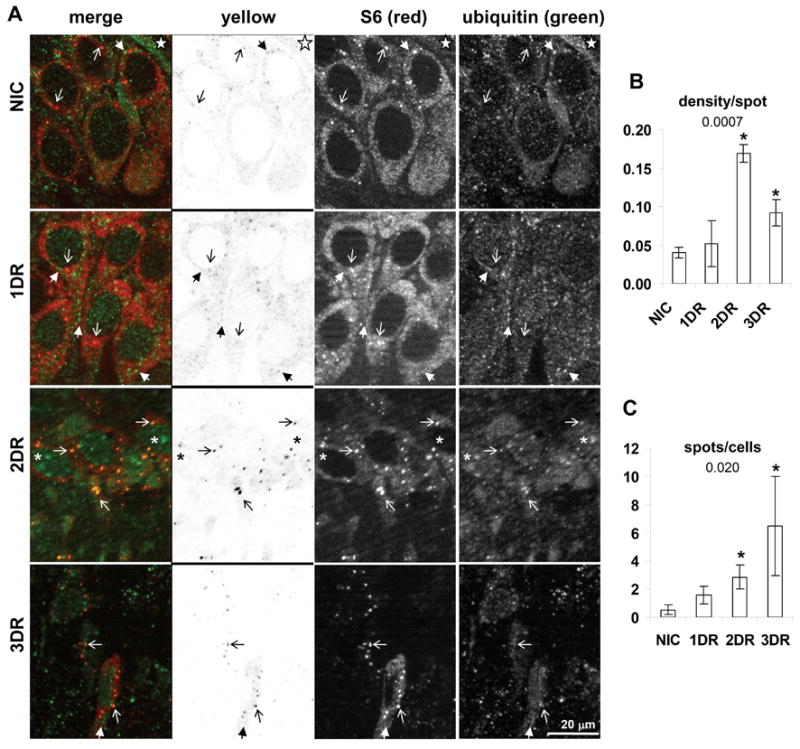
With TIA-1 and ubiquitin co-staining, the overall pattern of changes in ubiquitin staining described above was retained. Along with nuclear and punctate cytoplasmic staining, we had previously reported a fine, but low intensity cytoplasmic staining of TIA-1 (Kayali et al., 2005), which was also observed in the present study. This fine cytoplasmic TIA-1 staining, when combined with ubiquitin double labeling, produced a rust color throughout the cytoplasm (Figure 3A, merges). This general colocalization of TIA-1 and ubiquitin may reflect the presence of ubiquinated TIA-1, which was putatively identified by Western blot (see below).
In NICs, in addition to the homogeneous cytoplasmic colocalization of TIA-1 and ubiquitin, cytoplasmic TIA-1 particles also evidenced colocalization with ubiquitin (Figure 3A, NIC). At 1DR, the prominent ubi-protein clusters in the 1DR CA1 neurons showed overlap with TIA-1 (Figure 3A, 1DR, closed arrows). Additionally at 1DR, a diffuse nuclear colocalization was observed (Figure 3A, 1DR). These colocalizations caused a mean increase in “density/spot” at 1DR, but this was not statistically significant compared to controls (Figure 3B). At 2DR, there was a statistically significant increase in colocalization of TIA-1 and ubiquitin (Figure 3B), and this again involved overlap in the form of cytoplasmic particles (Figure 3A, 2DR, open arrows). There was also a small degree of colocalization of TIA-1 with the circular ubiquitin inclusions that formed in the nuclei of CA1 pyramidal neurons (Figure 3A, 2DR, asterisks). At 3DR, the colocalization of TIA-1 and ubiquitin in the form of particles was retained, but the change in intensity did not clear statistically compared to controls.
Western blot of subcellular fractions
We found no change in the levels of TIA-1 in cytoplasmic and nucleoplasmic fractions obtained from microdissected CA1 out to 2 days reperfusion (Figure 7A). S6 was not detectable in the nucleoplasmic fraction, and its level did not change in the cytoplasmic fraction (Figure 7A). Consistent with the microscope data, we observed bands of ubiquinated proteins in the nucleoplasmic fraction, although these did not change (Figure 7B).
Figure 7.
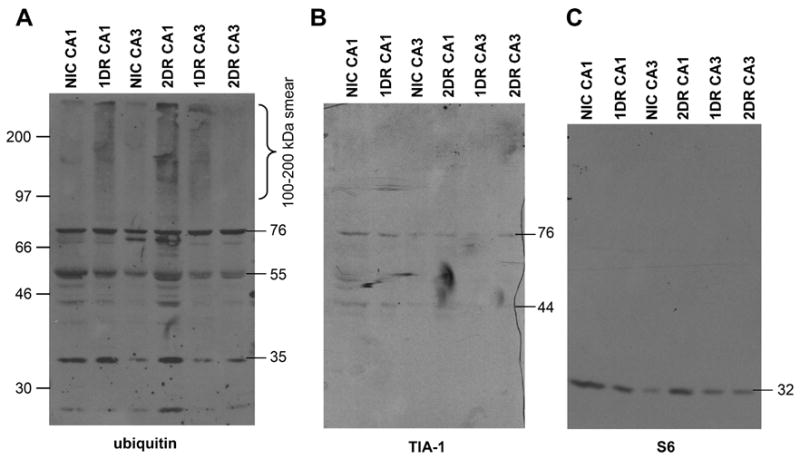
Western blots of insoluble fraction (IF) from microdissected CA1 and CA3. (A) Western blot of ubiquitin in IF (derived as described in Materials and Methods). (B) TIA-1 Western blot of the same membrane in A. (C) S6 Western blot of the same membrane in A. The material in each lane derived from the pooling of four separate animals in each experimental group. Molecular weight markers are indicated at the left of the images, molecular weights of specific bands are indicated on the right of each blot, both in kDa.
Since we were forced to pool our samples in the IF fraction, this limits the verification of the reproducibility of this data, so we therefore interpret it only in a qualitative fashion. In the IF fraction, we observed in reperfused samples a ubiquinated smear in the 100–200 kDa range, that has been associated with the presence of PAs in post-ischemic neurons (Hu et al., 200; Hu et a;., 2002, Zang et al., 2006). This ubiquinated smear appeared in 1DR CA1 and persisted in the 2DR CA1 samples. Such a smear also appeared in the 1DR CA3 samples, but was not observed in the 2DR CA3 samples. When this same membrane was stripped and reprobed for TIA-1, we detected two TIA-1 reactive bands at 42 and 76 kDa. The 76 kDa TIA-1 band is consistent in weight with the addition of four ubiquitins to the 42 kDa band, and this band co-migrated with a strongly ubiquitin-reactive band in the IF fraction (Figure 7). When the membrane was again stripped and reprobed for S6, only a single band at 32 kDa was observed. Thus, we observed evidence of persistent PAs in CA1, which co purified with S6, TIA-1 and a putative ubiquinated form of TIA-1.
Discussion
We have here documented the convergence of PAs and SGs at later reperfusion following global forebrain ischemia, close to the time when CA1 neurons will die. Our data indicate that SGs and ubi-protein clusters were separate entities before 2 days of reperfusion, but merged to become the same complex by 2DR. The present study was designed to document this colocalization, and so does not directly address the causes or consequences of this convergence. Because this convergence occurred only in CA1 pyramidal neurons, it is reasonable to presume it reflects a step in the process of delayed neuronal death.
We note that it is possible that ischemia induced changes in the target antigens such that immuno-reactivity changed across experimental groups, which may in part account for our results. However, until evidence to support this can be developed, we work under the assumption that the antigen/antisera reactivity remained constant between our experimental groups.
TIA-1 and S6 staining in the 2VO/HT Model
In the present study, we observed no loss of either S6 or TIA-1 in the CF and NF (Figure 6). Previously, using a cardiac arrest model of ischemia, we observed loss of both proteins at 4 hr reperfusion (Kayali et al., 2005). A recent study of focal ischemia also showed, by immunohistochemistry, a decrease in S6 at later reperfusion (Zang et al., 2006). These findings suggest an additional mechanism occurs in the focal and cardiac arrest models affecting S6 behavior. As the present model resulted in CA1 cell death (Figure 1) without the loss of S6, this indicates that irreversible translation arrest occurred independent of the loss of S6 described in the cardiac arrest (Kayali et al., 2005) and stroke models (Zang et al., 2006).
Cytoplasmic accumulations in dying CA1 neurons
Kirino and Sano (1984) and Desphande et al. (1992), using electron microscopy (EM), identified in dying CA1 neurons the accumulation of cytoplasmic aggregates of unknown composition that they termed “dark, fluffy substance” or “electron dense dark fluffy material”, respectively. These accumulations have been shown to contain ubiquitin and bind EPTA, indicating that they are proteinaceous in nature (Hu et al., 2000). We noted (Kayali et al., 2005) the similarity in morphology between the material identified by Kirino and Sano (1984) and Desphande et al., (1992) and the EM appearance of SGs (Gilks et al., 2004). This led us to suggest that the EM-identified particles were SGs, or some modified form of them (Kayali et al., 2005), leading directly to the issue of the relationship between SGs and PAs in post-ischemic CA1 neurons.
Our present observations begin to suggest a resolution to this issue. At 1DR, the ubi-protein clusters were distinct from SGs. However, the ubi-protein clusters also showed some colocalization with TIA-1 at 1DR. This may reflect accumulation of ubiquinated TIA-1 (Figure 7) in the ubi-protein clusters. At 2DR in CA1 pyramidal neurons, the larger ubi-protein clusters were no longer present, SGs colocalized with smaller ubiquinated particles (e.g. PAs), and larger inclusions of ubiquitin (containing some TIA-1) were present in the nuclei.
The known functional properties of TIA-1, first, that it self-associates (Gilks et al., 2004), and second, that it is actively transported between the nucleus and cytoplasm (Zhang et al., 2005), can be used to derive a model to explain this sequence of events we observed here. Accumulation of TIA-1 in ubi-protein clusters at 1DR (possibly due to its ubiquitination and turn-over) may, in part, explain the propensity of ubi-protein clusters to form perinuclear structures. The ubi-protein clusters may interact with the TIA-1 nuclear transport apparatus. Additionally, the nuclear inclusions of ubiquitin observed at 2DR may represent nuclear import of the ubi-protein clusters via TIA-1 nuclear import. Those parts of the ubi-protein clusters to remain in the cytoplasm may thus be the genesis of the smaller PAs, which also contain TIA-1. Because of the dynamic nature of SGs (Kedersha et al., 2000), it is possible that the TIA-1 in the cytoplasmic PA elicits the entry of the PA into an SG, accounting for the overlap we observed of both S6 and TIA-1 with the smaller PAs at 2DR in CA1.
The alternative model of cotranslational aggregation, suggests that any protein that is in the process of being translated will be taken up into PAs, along with components of the translational and chaperone systems. Because we did not evaluate proteins unrelated to SGs in the present study, we can neither confirm nor refute this prediction, It is therefore possible that the colocalization of S6 and TIA-1 with PAs occurred by cotranslational aggregation. This could be confirmed by determining de novo synthesis of the relevant proteins in the IF fraction.
It is also possible that both processes occur in parallel and that the hybrid PA/SGs we observed at 2DR in CA1 will contain both established SG components and proteins not related to SG composition. Further studies, at both the light and ultrastructural level, will be necessary to determine more fully the composition of the particles we identified at 2DR.
Contribution to cell death
We observed the sequestration of PAs inside of SGs only in vulnerable but not resistant neurons, suggesting that the formation of these hybrid particles is one of the steps involved in the progression of CA1 cell death. There is no evidence that ubiquitination of SG components contributes to SG function, leading to the inference that the accumulation of PAs in SGs observed here will disrupt SG function. A second consequence of this convergence is that sequestration of PAs inside of SGs would be expected to sterically hinder access of the proteosome to the sequestered PAs, thereby preventing PA dissolution, which would also be expected to be detrimental to the cell’s physiology.
Thus, it is not unreasonable to suggest that the series of events we have documented here represent stages in CA1 pyramidal neuron demise. However, the causality is expected to be upstream of the events described here. In CA3, ubi-protein clusters were also present at 1DR, showed a similar overlap with TIA-1, but were then gone from the CA3 neurons at 2DR. What is different between the two regions is the expression of heat shock proteins (reviewed in Planas et al., 1997). Both CA1 and CA3 neurons show rapid and large increases in transcription of the mRNA coding for the 70 kDa heat shock protein (HSP70) (Vass et al., 1988). However, using the present model in the rat, we observed translation of HSP70 in CA3 at 8 hrs reperfusion, whereas translation of HSP70 in CA1 did not occur until 30 hr reperfusion (Roberts et al., 2007). Hence, the possible sequence of events described above for CA1 may come about indirectly because of the delayed synthesis of HSP70, which would be expected to play a critical role in solublizing and dissociating the ubi-protein clusters. In turn, prolongation of the ubi-protein clusters may be the trigger to allow the eventual coalescence of PAs with SGs.
Conclusion
We have here documented a convergence of PAs and SGs late in reperfusion in CA1 neurons, within 24 hrs of their demise. While the present study further discerns the nature of the cytoplasmic accumulations associated with CA1 cell death, many questions are raised by the present results. These include the relative roles of cotranslational aggregation and processes mediated by TIA-1, as outlined above, in this convergence. The present results also bring into sharp relief the need to determine why there is a delayed translation of heat shock proteins in CA1 compared to other post-ischemic brain regions.
Figure 4.
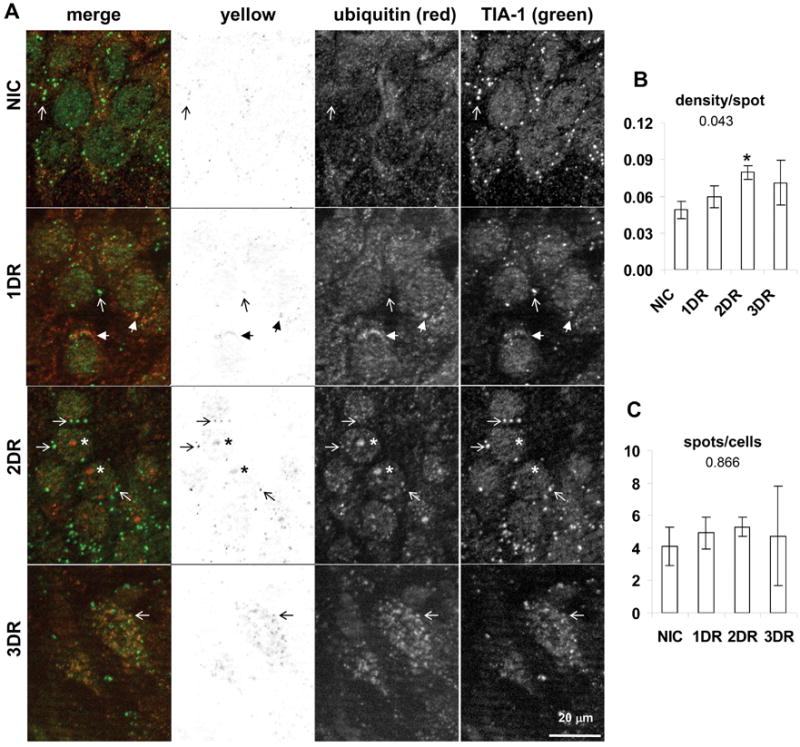
Colocalization of TIA-1 and ubiquitin in hippocampal CA1. (A) Fluorescent photomicrographs of CA1 pyramidal layer of representative samples from experimental groups as indicated. Columns are as indicated and as described in the legend of Figure 2. Marking conventions are the same as in Figure 3. (B) and (C) Quantitative analysis of particles in yellow channel. Variables measured and marking conventions are as described in the legend to Figure 2. Abbreviations and scale bars are as indicated in Figure 2 legend.
Acknowledgments
We offer our deep and sincere gratitude to Dr. Bingren Hu for his critical instruction in performing the 2VO/HT model, and for his ongoing stimulating discussions. We would like to thank Monique Marshall for her technical assistance with this work. This work was sponsored by NIH Grant No. NS044100 (D.J.D.) and NIH IMSD Grant No. GM58905-8 (J.R.).
Abbreviations
- 40S
small ribosomal subunit
- CA
cornu Ammonis (Ammon’s horn)
- eIF2α
alpha subunit of eukaryotic initiation factor 2
- I/R
ischemia and reperfusion
- PA
protein aggregate
- S6
small ribosomal subunit protein 6
- SG
stress granule
- TIA-1
T cell internal antigen
Footnotes
Section Editor: C.Sotello
Publisher's Disclaimer: This is a PDF file of an unedited manuscript that has been accepted for publication. As a service to our customers we are providing this early version of the manuscript. The manuscript will undergo copyediting, typesetting, and review of the resulting proof before it is published in its final citable form. Please note that during the production process errors may be discovered which could affect the content, and all legal disclaimers that apply to the journal pertain.
References
- Abramoff MD, Magelhaes PJ, Ram SJ. Image Processing with ImageJ. Biophotonics International. 2004;11:36–42. [Google Scholar]
- Anderson P, Kedersha N. RNA granules. J Cell Biol. 2006;13172:803–808. doi: 10.1083/jcb.200512082. [DOI] [PMC free article] [PubMed] [Google Scholar]
- Anderson P, Kedersha N. Visibly stressed: the role of eIF2, TIA-1, and stress granules in protein translation. Cell Stress Chaperones. 2002;7:213–221. doi: 10.1379/1466-1268(2002)007<0213:vstroe>2.0.co;2. [DOI] [PMC free article] [PubMed] [Google Scholar]
- Beck AR, Medley QG, O'Brien S, Anderson P, Streuli M. Structure, tissue distribution and genomic organization of the murine RRM-type RNA binding proteins TIA-1 and TIAR. Nucleic Acids Res. 1996;24:3829–3835. doi: 10.1093/nar/24.19.3829. [DOI] [PMC free article] [PubMed] [Google Scholar]
- Clendenon JL, Phillips CL, Sandoval RM, Fang S, Dunn KW. Voxx: a PC-based, near real-time volume rendering system for biological microscopy. American Journal of Physiology - Cell Physiology. 2002;282:C213–C218. doi: 10.1152/ajpcell.2002.282.1.C213. [DOI] [PubMed] [Google Scholar]
- DeGracia DJ, Hu BR. Irreversible translation arrest is the reperfused brain. J Cereb Blood Flow Metab. 2006:1–19. doi: 10.1038/sj.jcbfm.9600388. [Epub ahead of print] [DOI] [PMC free article] [PubMed] [Google Scholar]
- DeGracia DJ, Rafols JA, Morley SJ, Kayali F. Immunohistochemical mapping of total and phosphorylated eukaryotic initiation factor 4G in rat hippocampus following global brain ischemia and reperfusion. Neuroscience. 2006;139:1235–48. doi: 10.1016/j.neuroscience.2006.01.038. [DOI] [PubMed] [Google Scholar]
- Deshpande J, Bergstedt K, Linden T, Kalimo H, Wieloch T. Ultrastructural changes in the hippocampal CA1 region following transient cerebral ischemia: evidence against programmed cell death. Exp Brain Res. 1992;88:91–105. doi: 10.1007/BF02259131. [DOI] [PubMed] [Google Scholar]
- Gilks N, Kedersha N, Ayodele M, Shen L, Stoecklin G, Dember LM, Anderson P. Stress granule assembly is mediated by prion-like aggregation of TIA-1. Mol Biol Cell. 2004;15:5383–5398. doi: 10.1091/mbc.E04-08-0715. [DOI] [PMC free article] [PubMed] [Google Scholar]
- Hsu M, Buzsaki Vulnerability of mossy fiber targets in the rat hippocampus to forebrain ischemia. J Neurosci. 1993;13:3964–3979. doi: 10.1523/JNEUROSCI.13-09-03964.1993. [DOI] [PMC free article] [PubMed] [Google Scholar]
- Hossmann KA. Disturbances of cerebral protein synthesis and ischemic cell death. Prog Brain Res. 1993;96:167–177. doi: 10.1016/s0079-6123(08)63265-3. [DOI] [PubMed] [Google Scholar]
- Hu BR, Martone ME, Jones YZ, Liu CL. Protein aggregation after transient cerebral ischemia. J Neurosci. 2000;20(9):3191–3199. doi: 10.1523/JNEUROSCI.20-09-03191.2000. [DOI] [PMC free article] [PubMed] [Google Scholar]
- Hu BR, Janelidze S, Ginsberg MD, Busto R, Perez-Pinzon M, Sick TJ, Siesjo BK, Liu CL. Protein aggregation after focal brain ischemia and reperfusion. J Cereb Blood Flow Metab. 2001;21:865–875. doi: 10.1097/00004647-200107000-00012. [DOI] [PubMed] [Google Scholar]
- Kayali F, Montie HL, Rafols JA, DeGracia DJ. Prolonged translation arrest in reperfused hippocampal cornu Ammonis 1 is mediated by stress granules. Neuroscience. 2005;134:1223–1245. doi: 10.1016/j.neuroscience.2005.05.047. [DOI] [PubMed] [Google Scholar]
- Kedersha N, Anderson P. Stress granules: sites of mRNA triage that regulate mRNA stability and translatability. Biochem Soc Trans. 2002;30:963–969. doi: 10.1042/bst0300963. [DOI] [PubMed] [Google Scholar]
- Kedersha N, Cho MR, Li W, Yacono PW, Chen S, Gilks N, Golan DE, Anderson P. Dynamic shuttling of TIA-1 accompanies the recruitment of mRNA to mammalian stress granules. J Cell Biol. 2000;151:1257–1268. doi: 10.1083/jcb.151.6.1257. [DOI] [PMC free article] [PubMed] [Google Scholar]
- Kedersha NL, Gupta M, Li W, Miller I, Anderson P. RNA-binding proteins TIA-1 and TIAR link the phosphorylation of eIF-2 alpha to the assembly of mammalian stress granules. J Cell Biol. 1999;27147:1431–1442. doi: 10.1083/jcb.147.7.1431. [DOI] [PMC free article] [PubMed] [Google Scholar]
- Kim SH, Dong WK, Weiler IJ, Greenough WT. Fragile X mental retardation protein shifts between polyribosomes and stress granules after neuronal injury by arsenite stress or in vivo hippocampal electrode insertion. J Neurosci. 2006;26:2413–2418. doi: 10.1523/JNEUROSCI.3680-05.2006. [DOI] [PMC free article] [PubMed] [Google Scholar]
- Kirino T, Sano K. Fine structural nature of delayed neuronal death following ischemia in the gerbil hippocampus. Acta Neuropathol (Berl) 1984;62:209–218. doi: 10.1007/BF00691854. [DOI] [PubMed] [Google Scholar]
- Liu CL, Chen S, Kamme F, Hu BR. A) Ischemic preconditioning prevents protein aggregation after transient cerebral ischemia. Neuroscience. 2005;134:69–80. doi: 10.1016/j.neuroscience.2005.03.036. [DOI] [PMC free article] [PubMed] [Google Scholar]
- Liu CL, Ge P, Zhang F, Hu BR. B) Co-translational protein aggregation after transient cerebral ischemia. Neuroscience. 2005;134:1273–1284. doi: 10.1016/j.neuroscience.2005.05.015. [DOI] [PMC free article] [PubMed] [Google Scholar]
- Magnusson K, Wieloch T. Impairment of protein ubiquitination cause delayed neuronal death. Neurosci Lett. 1989;96:264–270. doi: 10.1016/0304-3940(89)90389-3. [DOI] [PubMed] [Google Scholar]
- Nover L, Scharf KD, Neumann D. Cytoplasmic heat shock granules are formed from precursor particles and are associated with a specific set of mRNAs. Mol Cell Biol. 1989;9:1298–1308. doi: 10.1128/mcb.9.3.1298. [DOI] [PMC free article] [PubMed] [Google Scholar]
- Paxinos G, Watson C. The Rat Brain in Stereotaxic Coordinates. New York, NY: Academic Press; 1998. [Google Scholar]
- Planas AM, Soriano MA, Estrada A, Sanz O, Martin F, Ferrer I. The heat shock stress response after brain lesions: induction of 72 kDa heat shock protein (cell types involved, axonal transport, transcriptional regulation) and protein synthesis inhibition. Prog Neurobiol. 1997;51:607–636. doi: 10.1016/s0301-0082(97)00004-x. [DOI] [PubMed] [Google Scholar]
- Roberts GG, Di Loreto MJ, Wang J, DeGracia DJ. Hippocampal cellular stress responses following global brain ischemia and reperfusion. Antioxidants and Redox Signaling. 2007 doi: 10.1089/ars.2007.1786. In Press. [DOI] [PubMed] [Google Scholar]
- Schmued LC, Albertson C, Slikker W., Jr Fluoro-Jade: a novel fluorochrome for the sensitive and reliable histochemical localization of neuronal degeneration. Brain Res. 1997;751:37–46. doi: 10.1016/s0006-8993(96)01387-x. [DOI] [PubMed] [Google Scholar]
- Smith ML, Bendek G, Dahlgren N, Rosen I, Wieloch T, Siesjo BK. Models for studying long-term recovery following forebrain ischemia in the rat 2 A 2-vessel occlusion model. Acta Neurol Scand. 1984;69:385–401. doi: 10.1111/j.1600-0404.1984.tb07822.x. [DOI] [PubMed] [Google Scholar]
- Vass K, Welch WJ, Nowak TS., Jr Localization of 70-kDa stress protein induction in gerbil brain after ischemia. Acta Neuropathol (Berl) 1988;77:128–135. doi: 10.1007/BF00687422. [DOI] [PubMed] [Google Scholar]
- von Mikecz A. The nuclear ubiquitin-proteasome system. J Cell Sci. 2006;15:1977–1984. doi: 10.1242/jcs.03008. [DOI] [PubMed] [Google Scholar]
- Zhang T, Delestienne N, Huez G, Kruys V, Gueydan C. Identification of the sequence determinants mediating the nucleo-cytoplasmic shuttling of TIAR and TIA-1 RNA-binding proteins. J Cell Sci. 2005;118:5453–5463. doi: 10.1242/jcs.02669. [DOI] [PubMed] [Google Scholar]
- Zhang F, Liu CL, Hu BR. Irreversible aggregation of protein synthesis machinery after focal brain ischemia. J Neurochem. 2006;98:102–112. doi: 10.1111/j.1471-4159.2006.03838.x. [DOI] [PMC free article] [PubMed] [Google Scholar]