Abstract
Background
Immunoregulatory invariant natural killer (iNK) T cells rapidly produce interleukin (IL)‐4 and other cytokines that suppress a Th1 response and are deficient in some autoimmune diseases.
Aim
The aim of this study was to investigate any deficiency of iNK T cells in coeliac disease.
Methods
Blood was collected from 86 subjects with coeliac disease and from 152 healthy control subjects for investigation of Vα24+ T cells by flow cytometry. iNK T cells were assessed by Vα24 and α‐galactosylceramide/CD1d tetramer markers in 23 normal controls and 13 subjects with coeliac disease. Intracellular IL‐4 was measured after anti‐CD3 antibody stimulation. Duodenal biopsies were obtained in a subgroup of subjects with coeliac disease and control subjects for Vα24 mRNA expression using relative PCR and for Vα24+ T cells by immunofluorescence.
Results
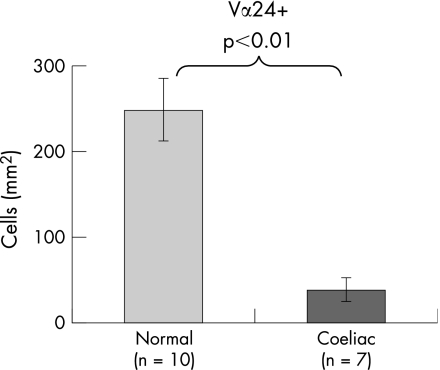
The mean numbers of circulating Vα24+ T cells and iNK T cells in coeliac disease were 27% (p<0.001) and 16% (p<0.001), respectively, of levels in control subjects. After in vitro anti‐CD3 stimulation, numbers of IL‐4+ producing iNK T cells from subjects with coeliac disease were unchanged but increased by 21% in control subjects. In subjects with coeliac disease, Vα24 mRNA intestinal expression was reduced to 17% (p<0.001) by relative PCR and numbers of intestinal Vα24+ T cells were 16% (p<0.01) of levels in control subjects.
Conclusions
We conclude that Vα24+ T cells and iNK T cells are deficient in coeliac disease. We speculate that this deficiency could contribute to the failure of immunological oral tolerance that seems to underlie this disease.
Keywords: coeliac disease, NK T cells
Coeliac disease is an immunological reaction to dietary gluten that results in intestinal damage. Inflammation within the intestine is mediated by inappropriate activation of CD4+ T cells by gluten presented by HLA DQ2 and to a lesser extent DQ8 antigen presenting cells.1,2,3,4,5,6,7,8 The discovery of tissue transglutaminase as the autoantigen of coeliac disease9 further refined the pathogenesis to that of the true antigen being deamidated gluten.10,11 T cells are activated and produce mainly Th1 (eg, interferon‐γ) and to a lesser extent Th0 cyokines.12 Intraepithelial lymphocytes become activated and damage adjacent enterocytes in the epithelium,13,14 while lamina propria T cells activate fibroblasts to secrete matrix metalloproteinases that destroy the connective tissue structure of the lamina propria.15 Although the mechanism of tissue destruction in coeliac disease is possibly explained, the reason for the initiation of inappropriate activation of mucosal T cells remains uncertain, although it is usually attributed to a failure of immunological oral tolerance.16 There is limited evidence for a loss of immunological suppression in coeliac disease.17,18
Natural killer (NK) T cells are increasingly recognised as important immunoregulatory cells. They are defined as expressing both natural killer 1 (a member of the natural killer cell receptor family, NKR‐P1, CD161) and CD3 surface markers. NK T cells have been implicated in the pathogenesis of several autoimmune diseases including autoimmune models of diabetes mellitus and lupus erythematosus in mice, and in type 1 diabetes mellitus, systemic sclerosis and multiple sclerosis in humans.19,20,21,22,23 Transfer of NK T cells into susceptible mice prevents autoimmune disease,20,24 and conversely depletion of NK T cells accelerates experimental autoimmune disease.25 Adoptive transfer of NK T cells mediates oral tolerance induction in experimental colitis in mice.26,27 NK T cells possess an invariant T cell receptor consisting of Vα24Jα18 and Vβ11 chains in humans. These invariant NK (iNK) T cells recognise α‐galactosylceramide (αGalCer) glycolipid and are CD1d restricted.28 The gold standard for identifying iNK T cells are αGalCer loaded CD1d tetramers.28 iNK T cells promptly produce interleukin (IL)‐4 and interferon‐γ (IFN‐γ) within 1–4 h after anti‐CD3 stimulation compared to days for conventional T cells in both mice and humans.29,30 Production of IFN‐γ is not sustained, unlike that of IL‐4, which therefore directs a Th2 bias in immune reactivity.31
A previous study found a relative NK cell deficiency in coeliac disease both mucosally and in blood,32,33 although these studies did not investigate any deficiency of NK T cells. A study of a range of autoimmune conditions found that Vα24+ Vβ11+ NK T cells were not deficient in coeliac disease, although the data from subjects with coeliac disease were distributed in the lower normal range.34 αGalCer CD1d tetramers were not used to identify iNK T cells in that study.
The purpose of this study was to investigate any possible deficiency of Vα24+ T cells and iNK T cells as identified by αGalCer CD1d tetramers in coeliac disease, as this could help to explain any deficiency of immunoregulation. The function of these iNK T cells in producing cytokines was examined after mitogenic stimulation.
Methods
Subjects
Subjects with coeliac disease were recruited from those attending the Department of Gastroenterology and Hepatology, The Queen Elizabeth Hospital, Woodville South, South Australia. All had been diagnosed by intestinal biopsy. Subjects with coeliac disease were reviewed at 1 yearly intervals and their compliance with a gluten‐free diet assessed. Subjects were strongly encouraged to maintain total gluten exclusion. Control subjects were recruited from those attending for endoscopy for non‐ulcer dyspepsia or iron deficiency in the Department of Gastroenterology and Hepatology, The Queen Elizabeth Hospital and in whom no major pathology was identified. Members of the control group were also used in other studies.
Flow cytometry
Blood in lithium heparin was placed on a density gradient and mononuclear cells isolated and washed in phosphate buffered saline. Aliquots of approximately 106 cells were incubated with saturating concentrations of either FITC, PE or Cy5‐labelled antibodies against CD56, CD57, CD94 or CD161 NK markers and CD3, CD4, Vα24, Vβ11 or Vβ13 T cell determinants or isotype control antibodies. Labelled cells were analysed on a flow cytometer (BD Biosciences, San Jose, CA, USA) after selecting a lymphocyte gate based on forward and side‐scatter characteristics. The number of CD56, CD57, CD94 and CD161 NK cells, and the proportion of CD3+ or CD3− cells were examined. The percentage ratio of Vα24+, Vβ11+ and Vβ13+ CD3+ cells and the absolute numbers of Vα24+, Vβ11+ and Vβ13 cells were calculated from the complete blood examination. iNK T cells were defined as Vα24+ α‐GalCer/CD1d tetramer+ T cells. α‐GalCer/CD1d tetramers were supplied by Dr DG Pellicini (University of Melbourne) using CD1d transfectants originally supplied by Dr Mitchell Kronkenberg (La Jolla Institute of Allergy and Immunology, San Diego, CA, USA).
Intestinal Vα24+ T cells
As Vα24+ T cells were likely to be at low levels mucosally, we used mRNA expression of the Vα24 gene to detect these cells in intestinal biopsies. Intestinal biopsies were collected from control subjects and subjects with coeliac disease. Duodenal biopsies were stored in RNAlater (Ambion, Austin, TX, USA) to prevent RNA degradation. Total RNA was isolated using the TRIzol reagent method (Life Technologies, Gaithersburg, MD, USA). A 2 μg sample of RNA was converted to cDNA by using the first strand M‐MLV cDNA synthesis kit (Gibco BRL, Melbourne, Australia). RNA was combined with 200 ng PD(N)6 primers (Amersham, Uppsala, Sweden), heated to 90°C for 5 min and placed on ice for 3 min. The RNA and primer mixture was combined with 5× first strand buffer, 4 mM dNTPs (Bioline, Canton, MA, USA), 10 mM DTT and 400 U M‐MLV reverse transcriptase. The mixture was incubated for 90 min at 37°C. PCR was performed in a 25 μl reaction volume containing 2 μl of cDNA template, 1 μl of 50 ng Vα24 specific sense (ACACAAAGTCGAACGGAAG) and constant region α anti‐sense (GATTTAGAGTCTCTCAGCTG) primers,22 2.5 μl 10× Mg free buffer, 1.5 μl 2.5 mM MgCl2, 0.5 μl 40 mM dNTPs (Bioline) and 1 U Taq DNA polymerase (Promega, Sydney, Australia). Samples were amplified using an Eppendorf Mastercycler 5330 thermal cycler for 38 cycles (1 min at 94°C, 1 min at 60°C and 1 min at 72°C). A QuantumRNA 18S internal standard (Ambion) was incorporated as a control housekeeping gene. A 2 μl sample of 18S paired primers and competimer was added to each PCR sample at a ratio of 1:10, respectively. PCR samples were run on a 1.5% agarose gel at 100 V in 0.5× Tris borate EDTA buffer, and analysed using the Kodak electrophoresis analysis system (Kodak, Rochester, NY, USA). Data were expressed as a ratio between the net intensity of the Vα24 TCR band and the 18S internal RNA control band.
In vitro anti‐CD3 stimulation of peripheral blood T cells
Blood in lithium heparin tubes was placed on a density gradient and mononuclear blood cells isolated. Cells were washed and resuspended in RPMI 1640 (Gibco, Life Technologies, Melbourne, Australia) supplemented with 10% fetal calf serum (CSL, Melbourne, Australia), 0.3 mg/ml l‐glutamine, 0.12 mg/ml benzylpenicillin and 10 µg/ml gentamicin. Cells were stimulated in a 12‐well plate with 5 μg/ml anti‐CD3 antibody (OKT3, Ortho Pharmaceutical, Raritan, NJ, USA). Cells were stimulated in the presence of 2 μg/ml costimulatory anti‐CD28 antibody (BD Biosciences) for 4 or 24 h (37°C, 5% CO2). Then 10 μg/ml brefeldin A (Sigma, St. Louis, MO, USA) was added to the cultures 4 h prior to cell harvest. Three‐colour flow cytometry was used to determine intracellular cytokine production by Vα24+ αGalCer/CD1d tetramer+ T cells. Cells were incubated for 10 min at room temperature with permeabilising solution (BD Biosciences). Aliquots of approximately 1×10⁶ cells were incubated with saturating concentrations of anti‐IL‐4, anti‐IFN‐γ, anti‐IL‐10, anti‐IL‐13 or isotype control PE‐labelled antibodies. αGalCer/CD1d tetramer was first incubated, the cells were washed and then anti‐Vα24‐FITC antibody was added. The samples were incubated at 4°C for 30 min then washed twice. Labelled cells were analysed on a flow cytometer (BD Biosciences) after selecting a lymphocyte gate based on forward and side‐scatter characteristics.
Immunofluorescent counts of intestinal Vα24+ T cells
Cryostat 6 μm sections were fixed briefly in ice cold 95% ethanol, air dried and immersed in PBS‐azide. Tissue sections were incubated with either anti‐Vα24‐FITC (diluted 1:10; Immunotech, Marseille, France) or isotype matched control antibody (diluted 1:10; Immunotech) for 1 h at room temperature, and washed twice in PBS‐azide for 10 min. Slides were mounted using Dako fluorescent mounting medium (Dako, Carpinteria, CA, USA). Slides were viewed and cells/mm2 counted using a Nikon Eclipse 800 microscope (Nikon, Kanagawa, Japan), SPOT RT Digital camera and SPOT V3.5 software (Diagnostic Instruments, Sterling Heights, MI, USA).
Statistics
Data were summarised as the mean±SEM. Means of groups were compared for significance by Student's t test. Slopes of linear regression lines were compared for Vα24+ T cells versus age using GraphPad InStat version 3.00 for Windows 95 (GraphPad Software, San Diego CA, USA).
Results
NK cells and NK T cells in coeliac disease
The mean numbers of T cells were similar in control subjects and in subjects with coeliac disease (table 1). Bone fide NK cells (ie, CD3−, non‐T cells) were also similar in control subjects and subjects with coeliac disease (table 1). The mean±SE numbers of CD94+ NK cells in untreated and treated subjects with coeliac disease were 220±40×103 cells/ml and 330±50×103 cells/ml, respectively. CD3− CD161+ NK cells and CD3+ CD161+ NK T cells were significantly reduced to 79% and 68%, respectively, of numbers in control subjects (table 1).
Table 1 Comparison of T, NK and NK T cells in normal subjects and in subjects with coeliac disease.
| Control (n) | Coeliac (n) | |
|---|---|---|
| CD3+ T cells | 1540±50 (152) | 1450±50 (86) |
| CD4+ T cells | 900±60 (86) | 860±60 (50) |
| CD56+ CD3− NK cells | 360±80 (24) | 340±50 (22) |
| CD57+ CD3− NK cells | 180±40 (29) | 170±30 (24) |
| CD94+ CD3− NK cells | 340±70 (29) | 270±30 (28) |
| CD161+ CD3+ NK T cells | 250±20* (67) | 170±20* (51) |
| CD161+ CD3− NK cells | 340±30† (67) | 270±20† (51) |
| Vα24+ T cells | 8.8±0.4‡ (152) | 2.4±0.1‡ (86) |
| Vα24+ Vβ11+ T cells | 3.8±0.4‡ (88) | 0.6±0.1‡ (63) |
| Vβ11+ T cells | 21.2±1.9* (70) | 12.3±1.1* (38) |
| Vβ13+ T cells | 48.9±3.4 (44) | 47.4±4.4 (20) |
*Student's t test, *p<0.01, †p<0.05, ‡p<0.001.
Data are given as mean±SE×103 cells/ml.
Vα24+, Vβ11+ and Vβ13+ T cells in coeliac disease
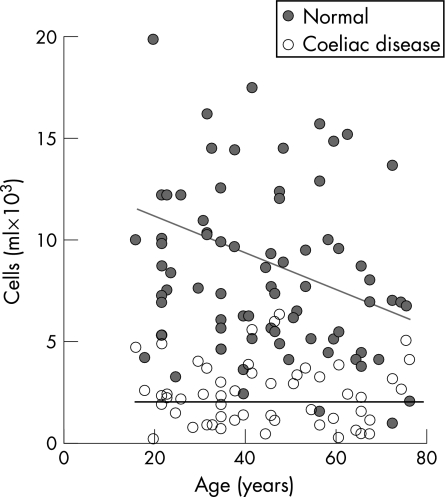
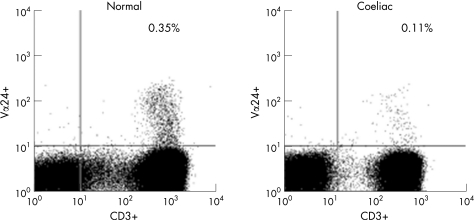
Circulating Vα24+ T cells in subjects with coeliac disease were significantly reduced to 27% of the numbers present in control subjects (table 1, fig 1). Representative flow cytometric plots of Vα24+ versus CD3+ T cells from a control subject and a subject with coeliac disease are given in fig 2. Vα24+ CD3+ T cells were deficient in the subject with coeliac disease as compared to the control subject. The mean±SE percentage of Vα24+ T cells of total lymphocytes in coeliac and control subjects was 0.11±0.01% versus 0.35±0.01%, respectively, and 0.18±0.01% and 0.48±0.02%, respectively, of circulating CD3+ T cells. The mean±SE number of circulating Vα24+ T cells in untreated subjects (n = 28) and treated subjects with coeliac disease (n = 58) was 2.6±0.4×10³/ml versus 2.3±0.1×10³/ml (p = NS), and thus was independent of diet. It was also independent of duration of gluten‐free diet (data not shown). Circulating Vα24+ T cells in control subjects declined with age but were low irrespective of age in subjects with coeliac disease (fig 1). The CD4+ subset of Vα24+ T cells was 65% of Vα24+ T cells in both control subjects and subjects with coeliac disease (data not shown). Circulating Vβ11+ T cells were reduced significantly in coeliac disease to 58% of levels in control subjects, but Vβ13+ T cell levels were similar to those in control subjects (table 1). Thus, there were selective deficiencies of Vα24+ and Vβ11+ T cells in coeliac disease.
Figure 1 Change in circulating numbers of Vα24+ T cells with age in normal subjects and subjects with coeliac disease. Data are represented by number of positive cells×103/ml for each individual subject.
Figure 2 Flow cytometric plots of Vα24+ versus CD3+ T cells in a control subject and a subject with coeliac disease are displayed. The right upper quadrant indicates the double positive Vα24+ CD3+ T cells which were deficient in the subject with coeliac disease.
Comparison of Vα24+ Vβ11+ T cells
Vα24+ Vβ11+ T cells from subjects with coeliac disease were reduced to 16% of the numbers present in normal subjects (table 1).
iNK T cells
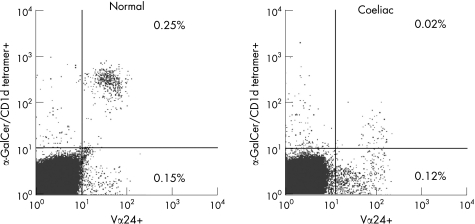
Representative flow cytometric plots of Vα24+ T cells versus α‐GalCer/CD1d tetramer+ cells in a control subject and a subject with coeliac disease are given in fig 3. The iNK T cells are Vα24+ α‐GalCer/CD1d tetramer+ cells and were deficient in the subject with coeliac disease compared to the control subject. α‐GalCer/CD1d tetramer+ cells and Vα24+ α‐GalCer/CD1d tetramer+ T cells were significantly reduced in coeliac disease to 30% and 16%, respectively, of the levels in control subjects (table 2).
Figure 3 Flow cytometric plots of Vα24+ versus α‐GalCer/CD1d tetramer+ T cells in a control subject and a subject with coeliac disease are displayed. The right upper quadrant indicates the iNK T cells which were deficient in the subject with coeliac disease.
Table 2 iNK T cells in control subjects and subjects with coeliac disease.
| Normal (n) | Coeliac (n) | |
|---|---|---|
| α‐GalCer/CD1d tetramer+ | 4.3 ± 0.4* (23) | 1.3 ± 0.5* (13) |
| α‐GalCer/CD1d tetramer+ Vα24+ | 3.8 ± 0.4† (23) | 0.6 ± 0.2† (13) |
*p<0.01; †p<0.001.
Data are given as mean ± SE×103 cells/ml.
Intestinal Vα24+ T cell mRNA expression
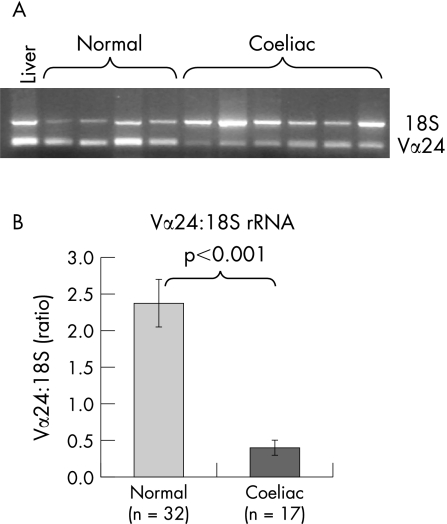
Vα24 mRNA was assessed by relative PCR and gel electrophoresis (fig 4A). Vα24 mRNA from subjects with coeliac disease was decreased to 17% of the levels present in the intestine of control subjects by relative PCR (fig 4B).
Figure 4 Comparison of Vα24+ T cell intestinal mRNA expression in normal subjects and subjects with coeliac disease. (A) A representative gel comparing Vα24 expression in normal subjects (lanes 1–5) and subjects with coeliac disease (lanes 6–11). Lane 1 contains liver control while lanes 2–11 are duodenal intestinal samples. (B) Comparison of Vα24 and 18S PCR band net intensity for normal subjects and subjects with coeliac disease.
Intestinal Vα24+ T cells by immunofluorescence
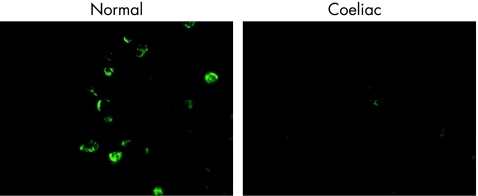
Representative photomicrographs of intestinal Vα24+ T cells from a control subject and a subject with coeliac disease are given in fig 5. There were fewer intestinal Vα24+ T cells in the subject with coeliac disease. Most Vα24+ T cells were in the lamina propria. Intestinal Vα24+ T cells in coeliac disease were reduced to 16% of the levels in control subjects (fig 6).
Figure 5 Comparison of intestinal Vα24+ T cells using immunofluorescence in a control subject and a subject with coeliac disease. Original magnification ×600.
Figure 6 Counts of Vα24+ T cells using immunofluorescence in duodenal biopsies from normal subjects and subjects with coeliac disease.
iNK T cells have impaired IL‐4 production in coeliac disease
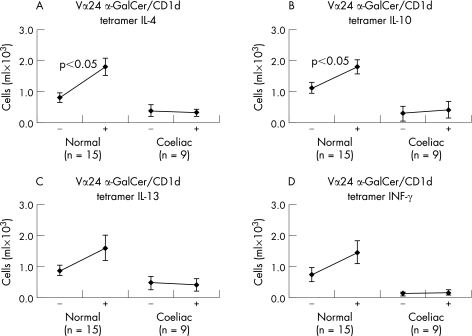
IL‐4 and IL‐10 increased in healthy subjects in stimulated iNK T cells, but there was no response from subjects with coeliac disease (fig 7). IL‐13 and IFN‐γ had no detectable increase.
Figure 7 IL‐4, IL‐10, IL‐13 and IFN‐γ intracellular production by blood iNK T cells after anti‐CD3 stimulation in normal subjects and in subjects with coeliac disease. Data are given as the change in cells×103/ml before and after anti‐CD3 stimulation in vitro for 4 h (n = number of subjects).
Discussion
Our study has found that Vα24+ T cells and iNK T cells were systemically deficient in coeliac disease and that Vα24+ T cells were deficient in the intestine. Residual circulating iNK T cells were also functionally deficient in producing IL‐4. Thus, there was a numerical and functional deficiency of iNK T cells in coeliac disease. Our study contrasts that of Van der Vliet and colleagues34 who investigated Vα24+ Vβ11+ T cells in blood from 10 subjects with coeliac disease and concluded these cells were not deficient. However, their data were distributed in the lower end of their range for normal subjects. They did not have α‐GalCer/CD1d tetramers available, which are regarded as the gold standard for identifying iNK T cells.28 We found that iNK T cells constitute 43% of circulating Vα24+ T cells in control subjects. We also investigated mucosal deficiency of Vα24+ T cells by Vα24 mRNA and by Vα24+ T cell counts in intestinal biopsies. Furthermore, we investigated functional deficiency of mitogen stimulated cytokine production.
We found that Vα24+ T cells, Vα24+ Vβ11+ T cells and iNK T cells were reduced in coeliac disease to 27%, 16% and 16%, respectively, of levels in control subjects. These various markers are used to estimate the immunoregulatory NK T cell population with the most stringent measure being Vα24+ α‐GalCer/CD1d tetramer+ T cells. Although Vα24+ T cells are obviously a superset of iNK T cells with other non‐invariant T cells, the fact that Vα24+ T cells were severely deficient anyway meant that the invariant subset was also likely to be deficient as shown systemically. We were thus able to use measures of Vα24+ T cells mucosally to infer deficiency of iNK T cells. Vα24+ mRNA was reduced to 17% of normal levels and Vα24+ T cell counts were reduced to 16% of normal levels in the duodenal mucosa of subjects with coeliac disease.
The deficiency of Vα24+ T cells in coeliac disease was independent of age, gluten status of diet or duration of gluten‐free diet. We acknowledge that it is difficult to assess compliance with a gluten‐free diet and to ensure full exclusion of gluten. In contrast, Vα24+ T cells declined with age in control subjects. The deficiency of iNK T cells could be explained by the difference in thymic development of classical T cells and iNK T cells.35,36 It is known that the intrathymic development of the NK T cell lineage branches from that of conventional T cells. iNK T cells are selected by glycolipids on CD1d expressing CD4+ CD8+ thymocytes rather than by peptides bound to MHC molecules on thymic epithelial cells.35,36 This would mean that it is possible to have a defect in iNK T cell development without affecting development of classical T cells. It would be interesting to study levels of iNK T cells in infants and children and in family members of those with coeliac disease.
NK T cells have been shown to be deficient in animal models and in human autoimmune diseases. It has been shown that autoimmune diseases increase with the duration of coeliac disease from 5.1% at diagnosis of less than 2 years to 34% at diagnosis of greater than 20 years.37 The authors found that the prevalence of autoimmune disease in all subjects with coeliac disease was 14% compared to 3% in control subjects. This raises the possibility that both coeliac and autoimmune disease share a common disease pathway (ie, genetic predisposition, NK T cell deficiency) or that gluten exposure in coeliac disease predisposes to autoimmune disease. In relation to the present study, a possibility might be that gluten exposure caused progressive NK T cell deficiency, but this was not evident. Vα24+ T cells did not decline with age in subjects with coeliac disease. However, numbers of circulating Vα24+ cells decreased with age in normal subjects. Thus, NK T cell deficiency was present at the time of diagnosis and thus possibly contributed to the pathogenesis rather than being caused by coeliac disease.
As well as being deficient, iNK T cells were functionally defective in producing IL‐4 after in vitro anti‐CD3 stimulation, unlike equivalent cells from normal subjects. A negligible cytokine response was observed using iNK T cells from subjects with coeliac disease. Multiple differences in gene expression of a IL‐4‐null Vα24+ T cell clone from a human monozygotic twin affected with type I diabetes have been identified compared with an IL‐4 intact Vα24+ T cell clone from the other unaffected twin.38 Presumably, the same multiple gene expression deficiency is present in iNK T cells in coeliac disease.
iNK T cells are believed to be immunoregulatory because they direct a Th2 immune response rather than a Th1 outcome which is associated with coeliac disease. The IL‐4 produced by iNK T cells could suppress activation of gluten‐stimulated T cells. Thus, Vα24+ T cells may be important in preventing development of coeliac disease in those who are genetically predisposed. It remains unexplained how natural glycolipid antigenic stimulation of Vα24+ T cells occurs, but possibly it could come from intestinal damage such as that induced by viral infection.23 Thus, the function of iNK T cells could be to regulate excessive immune reactivity. The functional significance of iNK T cell deficiency in coeliac disease still needs to be investigated, but this could be done using a suppressor cell assay in the presence and absence of DQ2 matched antigen presenting cells and coeliac or control Vα24+ T cells.
In summary, this study has shown that Vα24+ T cells and iNK T cells in coeliac disease are numerically deficient and functionally defective. The loss of these immunoregulatory cells could contribute to the inappropriate activation of gluten sensitised T cells which results in intestinal damage in coeliac disease.
Abbreviations
αGalCer - α‐galactosylceramide
IFN - interferon
IL - interleukin
iNK T cell - invariant natural killer T cell
Footnotes
Competing interests: None.
Ethics: This study was approved by the Human Ethics Committee of The Queen Elizabeth Hospital. The study was conducted according to the guidelines of the National Statement on Ethical Conduct in Research Involving Humans (1999) of the National Health and Medical Research Council of Australia.
References
- 1.Housely J, Asquith P, Cooke W. Immune response to gluten in adult coeliac disease. Br Med J 19692159–161. [DOI] [PMC free article] [PubMed] [Google Scholar]
- 2.Ferguson A, MacDonald T T, McClure J P.et al Cell‐mediated immunity to gliadin within the small‐intestinal mucosa in coeliac disease. Lancet 1975i895–897. [DOI] [PubMed] [Google Scholar]
- 3.Sigora K, Anand B S, Truelove S C.et al Stimulation of lymphocytes from patients with coeliac disease by a sub‐fraction of gluten. Lancet 1976ii389–391. [DOI] [PubMed] [Google Scholar]
- 4.Penttila I A, Gibson C E, Forrest B D.et al Lymphocyte activation as measured by interleukin‐2 receptor expression to gluten antigen in coeliac disease. Immunol Cell Biol 199068155–160. [DOI] [PubMed] [Google Scholar]
- 5.Marsh M N, Cummins A G. The interactive role of mucosal T lymphocytes in intestinal growth, development and enteropathy. J Gastroenterol Hepatol 19938270–278. [DOI] [PubMed] [Google Scholar]
- 6.Lundin K E, Scott H, Hansen T.et al Gliadin‐specific, HLA‐DQ(alpha*0501, beta*0201) restricted T cells isolated from the small intestinal mucosa of celiac disease patients. J Exp Med 1993178187–196. [DOI] [PMC free article] [PubMed] [Google Scholar]
- 7.Schuppan D. Current concepts of celiac disease pathogenesis. Gastroenterology 2000119234–242. [DOI] [PubMed] [Google Scholar]
- 8.Anderson R P, Degano P, Godkin A J.et al In vivo antigen challenge in celiac disease identifies a single transglutaminase‐modified peptide as the dominant A‐gliadin T cell epitope. Nat Med 20006337–342. [DOI] [PubMed] [Google Scholar]
- 9.Dieterich W, Ehnis T, Bauer M.et al Identification of tissue transglutaminase as the autoantigen of celiac disease. Nat Med 19973776–778. [DOI] [PubMed] [Google Scholar]
- 10.Molberg Ø, MacAdam S N, Korner R.et al Tissue transglutaminase selectively modifies gliadin peptides that are recognized by gut‐derived T cells in celiac disease. Nat Med 19984713–717. [DOI] [PubMed] [Google Scholar]
- 11.Van de Wal Y, Kooy Y, van Veelen P.et al Selective deamidation by tissue transglutaminase strongly enhances gliadin‐specific T cell reactivity. J Immunol 19981611585–1588. [PubMed] [Google Scholar]
- 12.Nilsen E M, Gjertsen H A, Jensen K.et al Gluten activation of peripheral blood T cells induces a Th0‐like cytokine pattern in both coeliac patients and controls. Clin Exp Immunol 1995103295–303. [DOI] [PMC free article] [PubMed] [Google Scholar]
- 13.Meresse B, Chen Z, Ciszewski C.et al Coordinated induction by IL‐15 of a TCR‐independent NKG2D signaling pathway converts CTL into lymphokine‐activated killer cells in celiac disease. Immunity 200421357–366. [DOI] [PubMed] [Google Scholar]
- 14.Hüe S, Mention J ‐ J, Monteiro R C.et al A direct role for NKG2D/MICA interaction in villous atrophy during celiac disease. Immunity 200421367–367. [DOI] [PubMed] [Google Scholar]
- 15.Pender S L F, Tickle S P, Docherty A J P.et al A major role for matrix metalloproteinases in T cell injury in the gut. J Immunol 19971581582–1590. [PubMed] [Google Scholar]
- 16.Mowat A M, Lamont A G, Strobel S.et al The role of antigen processing and suppressor T cells in immune responses to dietary proteins in mice. Adv Exp Med Biol 1987216A709–720. [DOI] [PubMed] [Google Scholar]
- 17.Pignata C, Troncone R, Monaco G.et al Impaired suppressor activity in children affected by coeliac disease. Gut 198526285–290. [DOI] [PMC free article] [PubMed] [Google Scholar]
- 18.Corazza G R, Sarchielli P, Londei M.et al Gluten specific suppressor T cell dysfunction in coeliac disease. Gut 198627392–398. [DOI] [PMC free article] [PubMed] [Google Scholar]
- 19.Sumida T, Sakamoto A, Murata H.et al Selective reduction of T cells bearing invariant V‐alpha‐24J alpha‐Q antigen receptor in patients with systemic sclerosis. J Exp Med 19951821163–1168. [DOI] [PMC free article] [PubMed] [Google Scholar]
- 20.Baxter A G, Kinder S J, Hammond K J.et al Association between alpha beta TCR+ CD4‐ CD8‐ T cell deficiency and IDDM in NOD/Lt mice. Diabetes 199746572–582. [DOI] [PubMed] [Google Scholar]
- 21.Wilson S B, Kemi S C, Patton K T.et al Extreme Th1 bias of invariant Vα24JαQ T cells in type 1 diabetes. Nature 1998391177–181. [DOI] [PubMed] [Google Scholar]
- 22.Illes Z, Kondo T, Newcombe J.et al Differential expression of NK T cell V alpha 24J alpha Q invariant TCR chain in the lesions of multiple sclerosis and chronic inflammatory demyelinating polyneuropathy. J Immunol 20001644375–4381. [DOI] [PubMed] [Google Scholar]
- 23.Godfrey D I, Hammond K J L, Poulton L D.et al NKT cells: facts, functions and fallacies. Immunol Today 200021573–583. [DOI] [PubMed] [Google Scholar]
- 24.Zhang B, Yamamura T, Kondo T.et al Regulation of experimental autoimmune encephalomyelitis by natural killer (NK) cells. J Exp Med 19971861677–1687. [DOI] [PMC free article] [PubMed] [Google Scholar]
- 25.Frey A B, Rao T D. NK T cell cytokine imbalance in murine diabetes mellitus. Autoimmunity 199929201–214. [DOI] [PubMed] [Google Scholar]
- 26.Trop S, Samsonov D, Gotsman I.et al Liver‐associated lymphocytes expressing NK1.1 are essential for oral immune tolerance induction in a murine model. Hepatology 199929746–755. [DOI] [PubMed] [Google Scholar]
- 27.Saubermann L J, Beck P, De Jong Y.et al Activation of natural killer T cells by α‐galactosylceramide in the presence of CD1d provides protection against colitis in mice. Gastroenterology 2000119119–128. [DOI] [PubMed] [Google Scholar]
- 28.Matsuda J L, Naidenko O V, Gapin L.et al Tracking the response of natural killer T cells to a glycolipid antigen using CD1d tetramers. J Exp Med 2000192741–754. [DOI] [PMC free article] [PubMed] [Google Scholar]
- 29.Mendiratta S K, Martin W D, Hong S.et al CD1d1 mutant mice are deficient in natural T cells that promptly produce IL‐4. Immunity 19976469–477. [DOI] [PubMed] [Google Scholar]
- 30.Singh N, Hong S, Scherer D C.et al Activation of NK T cells by CD1d and α‐galactosylceramide directs conventional T cells to the acquisition of a Th2 phenotype. J Immunol 19991632373–2377. [PubMed] [Google Scholar]
- 31.Takahashi T, Nieda M, Koezuka Y.et al Analysis of human V alpha 24+ CD4+ NKT cells activated by alpha‐glycosylceramide‐pulsed monocyte‐derived dendritic cells. J Immunol 20001644458–4464. [DOI] [PubMed] [Google Scholar]
- 32.Hadziselimovic F, Emmons L R, Schaub U.et al Occurrence of large granular lymphocytes and natural killer cells in the epithelium of the gut distinguishes two different coeliac diseases. Gut 199233767–772. [DOI] [PMC free article] [PubMed] [Google Scholar]
- 33.Di Sabatino A, Bertrandi E, Casadei Maldini M.et al Phenotyping of peripheral blood lymphocytes in adult coeliac disease. Immunology 199895572–576. [DOI] [PMC free article] [PubMed] [Google Scholar]
- 34.Van der Vliet H J, von Blomberg B M, Nishi N.et al Circulating V(alpha24+) Vbeta11+ NKT cell numbers are decreased in a wide variety of diseases that are characterized by autoreactive tissue damage. Clin Immunol 2001100144–148. [DOI] [PubMed] [Google Scholar]
- 35.Jordan M A, Fletcher J, Baxter A G. Genetic control of NKT cell numbers. Immunol Cell Biol 200482276–284. [DOI] [PubMed] [Google Scholar]
- 36.Berzin S P, Uldrich A P, Pellicci D G.et al Parallels and distinctions between T and NKT cell development in the thymus. Immunol Cell Biol 200482269–275. [DOI] [PubMed] [Google Scholar]
- 37.Ventura A, Magazzu G, Greco L. Duration of exposure to gluten and risk for autoimmune disorders in patients with celiac disease. Gastroenterology 1999117297–303. [DOI] [PubMed] [Google Scholar]
- 38.Wilson S B, Kent S C, Horton H F.et al Multiple differences in gene expression in regulatory Vα24JαQ T cells from identical twins discordant for type 1 diabetes. Proc Natl Acad Sci U S A 2000977411–7416. [DOI] [PMC free article] [PubMed] [Google Scholar]


