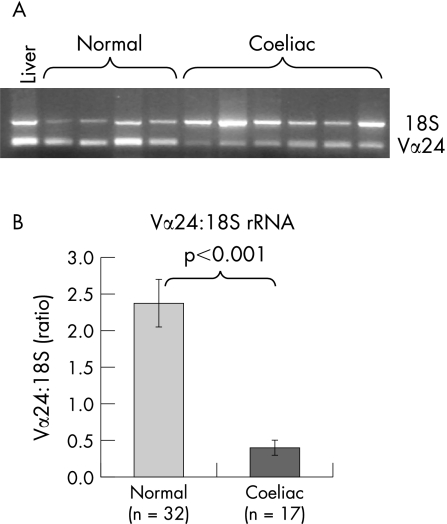
Figure 4 Comparison of Vα24+ T cell intestinal mRNA expression in normal subjects and subjects with coeliac disease. (A) A representative gel comparing Vα24 expression in normal subjects (lanes 1–5) and subjects with coeliac disease (lanes 6–11). Lane 1 contains liver control while lanes 2–11 are duodenal intestinal samples. (B) Comparison of Vα24 and 18S PCR band net intensity for normal subjects and subjects with coeliac disease.

An official website of the United States government
Here's how you know
Official websites use .gov
A
.gov website belongs to an official
government organization in the United States.
Secure .gov websites use HTTPS
A lock (
) or https:// means you've safely
connected to the .gov website. Share sensitive
information only on official, secure websites.
