Abstract
Aims
To show optical coherence tomography (OCT) artefacts in images from patients with retinal pigment epithelium detachment and retinal laser scars when OCT protocol analyses were applied.
Methods
All OCT retinal scans using OCT‐3000 (software 4.02) were reviewed over a three‐month period. 13 eyes of 11 patients were selected for this study. 10 eyes had retinal pigment epithelial detachments and 3 had retinal laser scars. All patients had ophthalmic examination, fluorescein angiography (one had indocyanine green angiography) and OCT. All OCT processing and analysis protocols were applied in each case.
Results
10 eyes of 8 patients with retinal pigment epithelial detachments showed flattening of the retinal pigment epithelium and apparent inversion of the dome of the detachment when scan protocol analyses were applied. 3 eyes with retinal laser scars displayed thinning of the retinal pigment epithelium without changes behind the scar. The retinal tissues around the lesions did not show any alteration.
Conclusions
OCT scan analysis is an excellent method to obtain specific information about the retina. However, some lesions that cause disruption of external reflectivity (retinal pigment epithelium) can cause software‐related artefacts when analysis protocols are applied. To prevent diagnostic error, re‐evaluation of the clinical fundus examination should be considered in any patient in whom OCT findings do not appear consistent with the initial clinical findings.
Optical coherence tomography (OCT) has been employed in the study of retinal disease. Two OCT scan modes are available for the macula: the macular thickness map (MTM) and fast macular thickness map (FMTM). After the scans are obtained, image processing or quantitative analysis protocols are employed in relation to the specific scan mode. These protocols are divided into two types: the quantitative analysis protocol and the image processing protocol. Additionally, there are normative data in the FMTM that can compare individual patients with the normal population. The image processing protocols employ mathematical algorithms that help in the visual analysis of the scan image. They can change the image appearance, but they do not change the raw scan data. (This information is documented in the OCT users' manual.)
We report a software‐related artefact caused by some retinal pigment epithelial pathologies in order to prevent misdiagnosis during the analysis of the images.
Patients and methods
We reviewed all records and retinal OCT scans from the database of the Centro Médico Docente La Trinidad (CMDLT) and Unidad Oftalmológica de Caracas (UOC) collected between March and June 2005. All OCTs were obtained with Stratus OCT Model 3000 machines using version 4.02 software (Humphrey‐Zeiss Systems, Dublin, CA).
Two hundred and eight patients had macular OCT scans from both eyes (78 patients from CMDLT and 130 from UOC). Thirteen eyes of 11 patients qualified for this study. Ten eyes of eight patients had retinal pigment epithelium detachments and three eyes of three patients had perimacular laser scars.
All patients underwent complete ophthalmic examination. All patients had fluorescein angiography and one of the patients with retinal pigment epithelium detachment had indocyanine green angiography. OCT images were obtained by two of the authors or a trained technician. The computer corrected any refractive error automatically after introduction of the spherical equivalent. The pupils were dilated with 1% tropicamide and 2.5% phenylephrine. Each patient was instructed to fixate on an internal or an external target light; when an internal fixation was employed the fellow eye was patched. After the patient was positioned in the module, the scans were centred in the fovea. The study was continued until images were obtained with a signal strength of 5 or higher. The analysis protocols applied for the MTM and FMTM scan protocol were normalised, normalised + aligned, with Gaussian smoothing, median smoothing, proportional, scan profiling, retinal map, retinal map thickness/volume, and retinal map thickness volume/tabular and, for the FMTM retinal thickness map, normalised and normalised + aligned. Normative data were applied only to the FMTM studies.
Results
Thirteen eyes of eleven patients qualified for the study.
Retinal pigment epithelium detachments
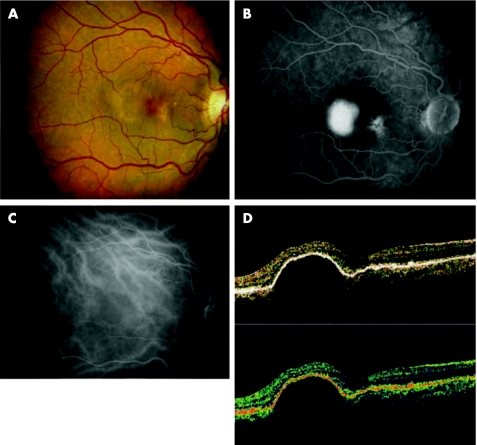
Retinal pigment epithelium detachments were found in 10 eyes of eight patients (two of them were bilateral and two of them had double retinal pigment epithelium detachments in one eye). Subretinal fluid was present at the neurosensory retina next to the pigment epithelium detachments in eight of the 10 eyes. Fluorescein angiography showed hyperfluorescent staining in the perimacular area and loss of background choroidal detail through the subretinal pigment epithelial fluid. The early phase of the indocyanine green (ICG) angiogram demonstrated a well‐circumscribed margin of the dome‐shaped RPE detachment and the sub‐RPE fluid relatively blocking background choroidal fluorescence. The late phase of the ICG angiogram demonstrated hypofluorescence of the RPE detachment (fig 1 A,B,C).
Figure 1 (A) Color fundus photograph showing orange‐brown area of retinal pigment epithelium detachment with small yellowish drusen, associated with a small serous retinal elevation. (B) Fluorescein angiography demonstrates a relatively well‐demarcated patch of hyperfluorescence that represents a retinal pigment epithelium detachment and hyperfluorecence staining drusen in it. The margins of the retinal pigment epithelium are slightly fuzzy, indicating subretinal fluid. (C) Indocyanine green angiogram demonstrates the hypofluorecence area of the retinal pigment epithelium detachment. (D) Normalised processing protocol OCT shows a dome‐shaped elevation of the retinal pigment epithelium.
In the scan selection of the OCT, the retinal pigment epithelium detachments showed dome‐shaped elevations of the highly reflective external bands, which corresponded to retinal pigment epithelium with low reflectivity underlying it. In normalised, Gaussian smoothing, median smoothing, proportional and scan profile protocols, the image was preserved in a correct direction (fig 1D) but when normalised + aligned, with the retinal thickness map, retinal thickness volume, retinal thickness/volume tabular, macular retinal thickness map and fast macular retinal thickness applied, the retinal pigment epithelium was modified whereby the retinal pigment lesion was flattened and the dome was reversed and projected into the choroidal layer. When the normative data were applied using FMTM, the data are also affected (fig 2A,B,C). The neurosensory retinal architecture and the position of the subretinal fluid around the retinal pigment epithelium detachment was preserved in all cases.
Figure 2 OCT analysed protocols. (A) Retinal thickness volumes scan shows flattening of the retinal pigment epithelium with dome inversion. The graphic demonstrated inversion of the dome. (B) Retinal thickness map tomogram demonstrates flattening of the retinal pigment epithelium and dome inversion with misidentification of the inner and outer boundary of the retinal pigment epithelium detachment. The map retinal thickness average (left map circle) and the colour scale (right map circle) show incorrect values. (C) FMTM scan with the normative data code is erroneous because it is an inverse dome of the retinal pigment epithelium.
Retinal laser photocoagulation scars
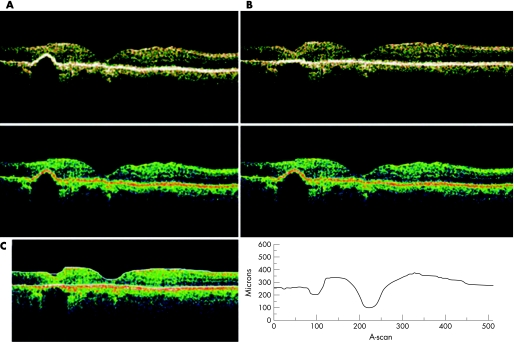
In three eyes of three patients with bilateral panretinal laser photocoagulation for diabetic retinopathy, the retinal pigment epithelium showed irregularity over and around the laser scar, with elevation of the scar tissue and signal attenuation behind it. When normalised, and Gaussian smoothing, median smoothing, proportional and scan profile protocols were employed, the images did not show any modification (fig 3A). After being normalised + aligned, and the retinal thickness map, retinal thickness volume, retinal thickness/volume tabular, and radial linear scan over the lesion were processed, the retinal pigment epithelium became flat, the retinal tissue above the lesion was pressed down in the apex of the scar and the empty space behind the laser scar showed preservation of the same characteristics as the previous scan (fig 3B,C).
Figure 3 Scar laser. (A) Normalised scan shows elevation of the retinal pigment epithelium with signal attenuation behind it. (B) Normalised and aligned tomograms show flattening of the retinal pigment epithelium without modification behind it. (C) The retinal thickness also demonstrated flattening of the retinal pigment epithelium.
Discussion
MTM and FMTM acquisition protocols can be employed in order to obtain more precise information about retinal pathologies. However artefacts can occur. They can be caused by the operator, by the ocular media, by the patient and by the software.1 Most of them have been previously described by Ray et al.2 and Pons et al.3 We have found a new image artefact when one of the processing protocols and all analysed protocols were applied in cases of retinal pigment epithelium detachment and laser photocoagulation scars.
The original ocular map algorithms were designed to identify the inner and outer retinal boundaries in macular oedema when the internal limiting membrane and retinal pigment epithelium are intact, but when the boundaries are altered, the software algorithms can cause artefacts.2,4,5 This has been observed with macular holes.2
In the present study, we found two situations where the OCT software scan analysis caused modification of the images. In our cases, when the retinal pigment epithelium was outside the normal position, as we observed in retinal pigment epithelium detachments and laser scars, the scan analysis mode moved the retinal pigment epithelium to or close to the normal position. It is possible that the OCT software algorithm tried to correct the defect because it was misinterpreted as noise, but, instead, created an artefact that could cause diagnostic error.
In the cases of retinal pigment epithelium detachment, the dome was reversed, showing a mirror image in the choroid without distortion of the neurosensorial retinal detachment; but we have not identified the reason for the dome inversion. Perhaps it is related to the height of the retina or the optical properties of the retinal pigment epithelium detachment, but future studies are needed to further elucidate this.
In patients with diabetes the OCT was performed in the macular area, and, when the tomogram incidentally passed through the paramacular photocoagulation scar and the scan analyses were applied, the images showed flattening of the retinal pigment epithelium with depression of the retinal tissue above the scar without modification of the tissue behind it.
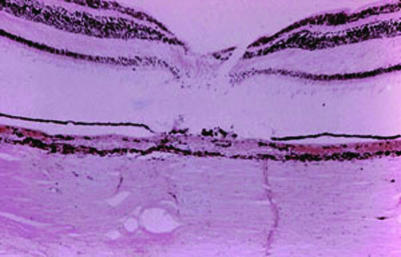
It is known that the effect of the laser treatment is in the RPE, and the heat absorbed by the pigment cells is radiated to the adjacent structures. This results in destruction of the RPE, choriocapillaris and photoreceptors and a resulting scar in the chorioretinal layer (fig 4).
Figure 4 Histopathology photograph of chorioretinal laser scar shows disarrangement and destruction of the retinal pigment epithelium, photoreceptors, outer portion of the retina and choriocapillaris. (Photograph courtesy of Dario Savino MD, Instituto de Otorrinolaringologia y Oftalmología, Caracas, Venezuela.)
When the OCT scan analyses where applied, the retinal tissue in the apex of the laser scar was depressed, possibly due to thinning of the tissue.
As Hee mentioned,1 FMTM is more likely to reproduce artefacts than MTM because FMTM employs one scan that is the result of the six radial scans in combination. However, we did not find a difference between the two scan analyses, possibly because the algorithm alterations in these cases were not in scan acquisitions. Instead it could have been in the analysis and processing protocols.
The processing protocols showed fewer artefacts than analysis protocols. Only one of the image processing protocols showed artefacts. The processing protocols use mathematical algorithms that decrease the signal noise, but the alignment function is supposed to correct the data for axial direction of patient motion. However, it cannot distinguish changes of patient motion from the height of the retina. Also, it can introduce artefacts in the scanned image. All the quantitative analysis protocols showed artefacts, probably because the algorithm in these protocols was not created to decrease the noise or because it cannot identify changes in the retinal height as occurred in the alignment‐processing image.
In summary, OCT is an excellent method for high‐resolution retinal imaging and recently, it has become the most popular imaging method employed for macular diseases. Since OCT became commercially available, the software has been modified in order to improve study results. We report our observations in order to alert clinicians about misinterpreting retinal pigment epithelium pathologies from the software artefacts and also to encourage the software developers to improve it.
Acknowledgements
The authors thank Thomas Hedges III, MD for his help in reviewing this paper.
Abbreviations
FMTM - fast macular thickness map
ICG - indocyanine green
MTM - macular thickness map
OCT - optical coherence tomography
Footnotes
Competing interests: The authors have no financial interest in any device or technique described in this article.
References
- 1.Hee M R. Artifacts in optical coherence tomography topographic maps. Am J Ophthalmol 2005139154–155. [DOI] [PubMed] [Google Scholar]
- 2.Ray R, Stinnett S S, Jaffe G J. Evaluation of image artifact produced by optical coherence tomography of retinal pathology. Am J Ophthalmol 200513918–29. [DOI] [PubMed] [Google Scholar]
- 3.Pons M E, Garcia‐Valenzuela E. Redefining the limit of the outer retina in optical coherence tomography scans. Ophthalmology 20051121079–1085. [DOI] [PubMed] [Google Scholar]
- 4.Hee M R, Puliafito C A, Wong C.et al Quantitative assessment of macular edema with optical coherence tomography. Arch Ophthalmol 19951131019–1029. [DOI] [PubMed] [Google Scholar]
- 5.Hee M R, Puliafito C A, Duker J S.et al Topography of diabetic macular edema with optical coherence tomography. Ophthalmology 1998105360–370. [DOI] [PMC free article] [PubMed] [Google Scholar]
- 6.Schuele G, Rumohr M, Huettmann G.et al RPE damage thresholds and mechanisms for laser exposure in the microsecond‐to‐millisecond time regimen. Invest Ophthalmol Vis Sci 200546714–719. [DOI] [PubMed] [Google Scholar]
- 7.Vassiliadis A. Laser sources and ocular effects. In: Klein EA, ed. Opthalmic lasers photocoagulation, photoradiation and surgery. St Louis: Mosby, 19838–27.


