Abstract
Aims
To examine the relative roles of genetic and environmental factors in central retinal thickness, by performing a classical twin study.
Methods
310 subjects were recruited from the TwinsUK adult registry at St Thomas' Hospital. Optical coherence tomography (Zeiss, stratus OCT3) was used to measure the average retinal thickness in the central 1 mm diameter area. The covariance of central retinal thickness (CRT), within MZ and DZ twin pairs, was compared and genetic modelling techniques were used to determine the relative contributions of genes and environment to the variation in CRT observed in this population.
Main outcome measure
CRT (average retinal thickness in the central 1 mm diameter area, centred on the fovea).
Results
The mean CRT of all subjects was 212.1 μm (range 165–277). CRT was statistically related to refractive error, with increasing myopia associated with a thinner CRT. CRT was more highly correlated within MZ twin pairs (r = 0.88) than with DZ twin pairs (r = 0.58), suggesting a genetic role. A model combining additive genetic and unique environmental factors provided the best fitting model and gave a heritability estimate of 0.90.
Conclusion
Genetic factors appear to play an important role in CRT, with a heritability estimate of 0.90.
Retinal thickness varies widely between individuals, but little is known about the clinical significance of this finding, with no epidemiological studies reported to our knowledge. It is possible that a thin retina, either primary or secondary, may be associated with retinal pathology.
Pathological myopia, in which the retina is significantly thinned, is associated with macular degeneration (RPE change and choroidal neovascular membranes).1,2,3 The aetiology of macular holes is largely unknown, but macular holes occur more frequently in women, who have been found to have significantly thinner macular retinas than men.4,5 Macular retinal thickness may therefore influence this condition, particularly as patients with macular holes have thinner papillomacular bundles than age‐matched controls.6
Lutein and zeaxanthin are hydroxy‐carotenoids that accumulate in the macular region of the retina where they are collectively known as macular pigment (MP).7,8 We have recently reported a significant, positive relationship of MP optical density and central retinal thickness (CRT) using two different techniques of MP measurement (a psychophysical method and an imaging autofluorescence method) and optical coherence tomography (OCT) to measure retinal thickness.9 The function of MP remains uncertain but studies have suggested a protective role in the eye, leading to increasing interest in the possible relationship between MP and age‐related macular degeneration (AMD).10,11 Although not yet fully established, several studies have suggested that low levels of MP are associated with an increased risk of AMD.12,13,14
It may be speculated that a thinner retina may allow for less MP storage or response to dietary lutein/zexanthin supplementation (Arvo Meeting Abstract: Aleman et al, IOVS 2006; 47: E‐Abstract 5810) and may, therefore, be an independent risk factor for AMD. Macular retinal thickness has recently been recognised as a parameter in glaucoma evaluation and management, but the question of whether reduced retinal thickness is a risk factor or a consequence of glaucoma still remains to be answered.15,16,17,18
CRT can be measured in the clinic using OCT. OCT is a non‐invasive, non‐contact technique that allows high‐resolution, cross‐sectional imaging of the human retina.19,20 OCT is able to objectively detect normal variations in retinal thickness, with a 10 μm depth resolution, and has been shown to be reproducible in the measurement of macular thickness in normal eyes.21,22,23,24
As reduced macular retinal thickness may be associated with retinal pathologies, we carried out a classical twin study to investigate the relative contributions of genes and environment to CRT in the healthy eye.
Materials and methods
Subjects
One hundred and fifty‐five healthy, female, twin pairs (81 monozygotic [MZ], 74 dizygotic [DZ]) were recruited from the TwinsUK adult registry, at St Thomas' Hospital. The TwinsUK adult registry recruits volunteers from the general population through local and national media campaigns and twins are not aware of proposals for specific eye studies at the time of registration, hopefully reducing ascertainment bias. Subjects who met the correct age criteria were later invited to participate in this study. The age criteria was set at 17–50 years to increase the likelihood of recruiting subjects with healthy eyes.
All participants gave their informed consent. The study protocol was approved by the local ethics committee and carried out in accordance with the Declaration of Helsinki. A detailed history and standardised, dilated slit‐lamp examination was performed on all subjects. This included logMAR visual acuity, intraocular pressure, assessment of cup:disc ratio and refractive error using a Humphrey‐670 automatic refractor. Spherical equivalent was recorded, in diopters (D), for each eye. Both eyes of each subject were assessed. Exclusion criteria included a history of eye disease, retinal laser treatment, glaucoma or retinal disease. The presence of any of these exclusion criteria led to the exclusion of both members of the twin pair. One twin pair was excluded due to the presence of drusen in one member of the pair.
Optical coherence tomography
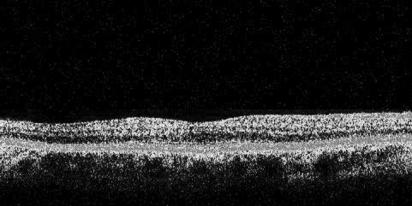
OCT is an optical technique that allows acquisition of high‐resolution, cross‐sectional images of the retina. The principles of OCT and its interpretation have been previously described.19,20 In summary, OCT uses the principles of low‐coherence interferometry to obtain a cross‐section of the retina, based on reflected signals from the different retinal layers. A mathematical algorithm is used to determine the anterior and posterior boundaries of the neural retina. Interference patterns produced by low‐coherence light interacting with retinal tissues and a reference mirror are detected and processed into an A‐scan signal. Multiple A‐scan signals are aligned to produce a two‐dimensional cross‐sectional map of the retina. Retinal thickness was measured using the commercially available OCT‐3 machine (Stratus Model 3000, Carl Zeiss Meditec, Humphrey Division). Eyes were dilated with 1% tropicamide prior to recording the images. All ocular examinations, including OCT procedures, were performed by one trained operator (SHML) who could observe the twin pairs but was not aware of the confirmed zygosity (see methods of zygosity determination below). The retinal thickness map and measurements of all subjects were printed out directly from the OCT machine. These figures were entered into the database, at a later stage, by another member of staff who was blinded to the twin zygosity.
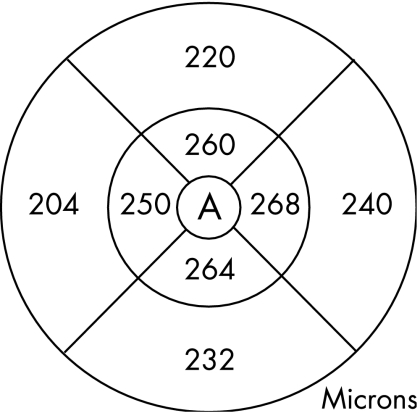
The macula scan protocol was used. This consists of six (6 mm long and 2 mm deep) radial single line scans, centred on the patient's fixation point, each containing 128 A‐scans and spaced 30 degrees apart. Using OCT, the retinal thickness is calculated automatically, as the distance between the vitreoretinal interface and the retinal pigment epithelium (RPE), as defined by reflectivity characteristics (fig 1). The machine standard, “single retinal map” analysis protocol was used to quantify the average retinal thickness. This protocol displays the average retinal thickness in the nine ETDRS macula areas, using data from all six scans.23,25 As the radial scans are obtained in a spoke pattern, centred on the foveal centre, this concentrates the retinal thickness measurements in the most central area, and the peripheral regions of the scan are likely to have more inaccuracies. Therefore in this study, we have used the average retinal thickness in the central 1 mm diameter zone (CRT), as shown by area A in fig 2. The OCT scans of two eyes of two subjects were excluded because of poor scan quality due to high refractive error.
Figure 1 Retinal image generated by OCT.
Figure 2 Retinal macular thickness map generated by OCT software, showing the average retinal thickness in nine areas. Area A represents the central 1 mm diameter area.
Zygosity
A standardised questionnaire for determining zygosity was completed by all subjects.26 This has been shown to be over 95% accurate in determining zygosity. If there was any doubt, for example due to borderline zygosity score, zygosity was confirmed by DNA analysis of short tandem‐repeat polymorphisms (AmpF1 STR Profiler kit [PE Applied Biosystems, Foster City CA]). DNA analysis was performed on 68 twin pairs in total (44%).
Analytical approach
Twin studies use concordances or correlations between MZ and DZ twins, to attempt to separate the contribution of genes and environment on a phenotype. Twin models assume that MZ twins share all their genes while DZ twins share on average half their genes; therefore any greater concordance in MZ twins is attributed to a genetic influence on the trait.27
The statistics package STATA (Version 8 SE Stata Corporation) was used for preliminary data analysis. The Mx program was used to perform maximum likelihood modelling.28 This program compares the covariances of a measured trait between MZ and DZ twins.29 The observed phenotypic variance is divided into four components: (A) additive genetic, (D) dominant genetic, (C) common environmental and (E) unique environmental components. C represents the contribution of shared family environment in twin pairs,27 while E represents unique environmental factors that are individual to each member of the twin pair. By sequentially dropping the variance components from the full model, the significance of each component can be assessed by observing the deterioration in the model fit. The Akaike information criterion (AIC) was used to determine the best fitting mode by describing the best goodness‐of‐fit combined with the fewest latent variables. The model with the lowest AIC suggests the best fit.
Heritability (h2) is the extent to which the tendency to develop a trait can be attributed to genetic factors and can be defined as the ratio of genetic variance to the total phenotypic variance (h2 = A+D/A+D+E+C).
Results
Three hundred and ten healthy, female twins were examined in this study. The mean age of all subjects was 39.9 years (SD 8.8; range17–50) and there was no significant difference in mean age between the MZ group and DZ group of subjects (p = 0.30, unpaired t test). The majority of subjects were white from the UK (150 pairs, 97%), 3 pairs were African‐Caribbean and 2 pairs were of mixed race. Fifty subjects were in the 17–30 years age range (MZ: 28; DZ 22), 106 subjects were in the 31–40 years range (MZ: 60; DZ: 46) and 154 pairs were in the 41–50 years range (MZ: 72; DZ: 82).
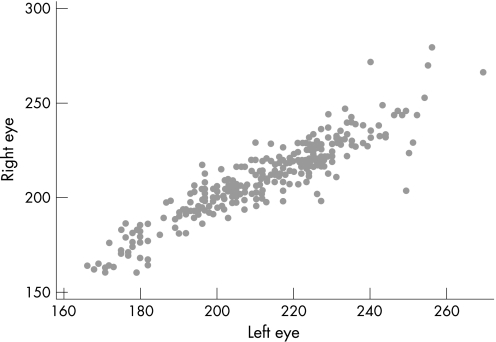
There was a high correlation between the CRT of the right and left eyes of each subject, with a correlation coefficient (r) of 0.91 (fig 3). Therefore the mean CRT of the two eyes of each subject was used for the maximum likelihood modelling.
Figure 3 Scatter plot showing inter‐ocular correlation of central retinal thickness (r = 0.91).
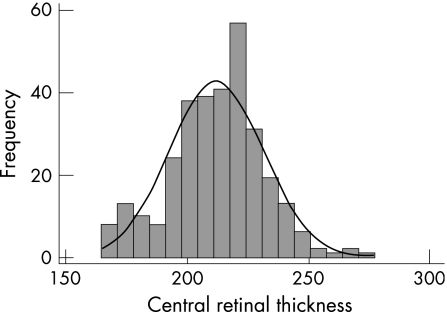
The mean CRT of the entire study population was 212.1 μm (SD 19.2, range 165–277) and there was no significant difference in the CRT of the MZ group (mean 211.8 μm) and the DZ group (mean 212.4 μm) (p = 0.88, unpaired t test) (table 1). The frequency distribution of CRT in this population is shown in fig 4 and shows a normal distribution, confirmed statistically (skew test p = 0.19).
Table 1 Summary of central retinal thickness results and characteristics of monozygotic and dizygotic twins.
| Monozygotic twins | Dizygotic twins | |
|---|---|---|
| Number | 162 | 148 |
| Age (years) | 39.6 (SD 8.8) | 40.6 (SD 8.5) |
| Central retinal thickness (μm) | 211.8 (SD 1.4) | 212.4 (SD 1.7) |
| Refraction (spherical equivalent; D) | −1.5 (SD 2.8) | −1.2 (SD 2.6) |
| Intraocular pressure (mm Hg) | 15 (SD 3) | 15 (SD 3) |
Figure 4 Frequency distribution of central retinal thickness values measured by OCT.
The mean intraocular pressure was 15 mm Hg (SD 3, range 8–24). The mean spherical equivalent was –1.3 D (SD 2.7) and the mean cylinder was –0.9 D (SD 0.7). Mean refractive error did not vary significantly between the MZ group and DZ group (p = 0.4, t test).
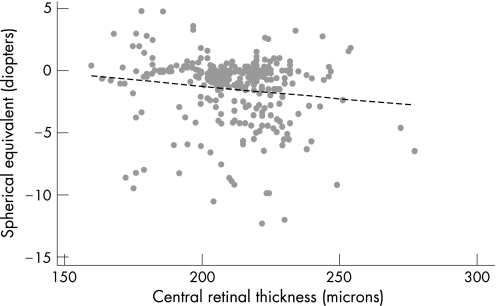
To account for the sibling relationship of the twins, one member of each twin pair was chosen at random to investigate the relationship of CRT with age, refractive error and intraocular pressure. In this population of healthy subjects aged 17–50 years, there was no significant relationship between CRT and age of subject (p = 0.3) and intraocular pressure (p = 0.52). CRT was statistically related to refractive error (r = −0.14, p = 0.02) (fig 5), with increasing myopia associated with a reduced retinal thickness.
Figure 5 Relationship of refractive error (spherical equivalent) and central retinal thickness measured by OCT (r = 0.14, p = 0.02).
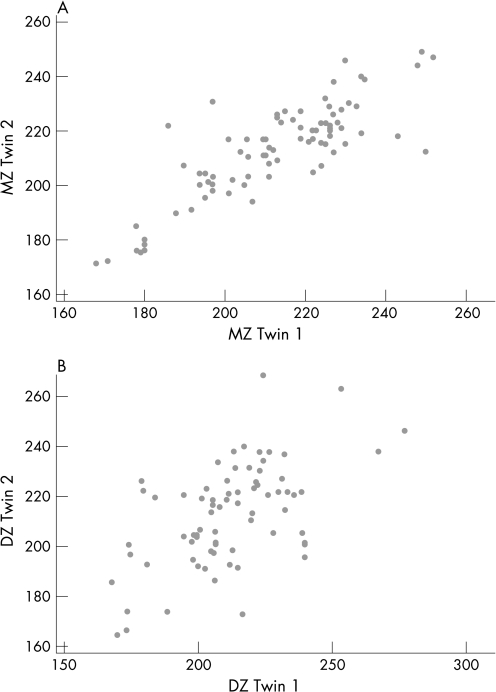
CRT was highly correlated within MZ twin pairs, with an intraclass correlation of 0.88. The DZ pairs were also correlated, but less strongly, with a correlation coefficient of 0.58, as illustrated by the scatter plots in fig 6. The significantly higher correlation within MZ twin pairs suggests that genetic factors play a role in CRT.
Figure 6 Scatter plots showing the intraclass correlation of central retinal thickness in (A) monozygotic twin pairs, r = 0.88 and (B) dizygotic twin pairs, r = 0.58.
Table 2 summarises the results of the univariate modelling. The best fitting model was the AE model, which combines additive genetic and unique environmental effects. The heritability of CRT in this study population was estimated to be 0.90 (95% CI 0.85–0.93), with the remaining variance in CRT attributable to environmental effects (0.10, 95% CI 0.07–0.15).
Table 2 Results of genetic modelling for central retinal thickness.
| Model | Χ2 | df | p | AIC |
|---|---|---|---|---|
| ACE | 4.066 | 3 | 0.254 | −1.934 |
| ADE | 5.609 | 3 | 0.132 | −0.391 |
| AE | 5.609 | 4 | 0.230 | −2.391 |
| CE | 43.963 | 4 | 0 | 35.963 |
| E | 153.731 | 5 | 0 | 143.731 |
Abbreviations: A, additive genetic; D, dominant genetic; C, common environment; E, unique environment; df, change in degrees of freedom between submodel and full model; p, probability that change in Χ2 is zero; AIC, Aikake information criterion.
Discussion
We have demonstrated that CRT is a highly heritable trait, with genetic factors accounting for 0.90 of the variance seen in this healthy, adult population. Hougaard et al investigated the heritability of retinal nerve fibre layer thickness (RNFLT), measured by OCT, by performing a cross‐sectional study on 50 twin pairs.30 They found a similar heritability estimate for RNFLT, of 0.78, when corrected for the effects of age. It will be interesting to investigate the amount of shared genetic factors responsible for RNFLT and total retinal thickness.
The mean CRT of this study group was 212 μm (SD 19) and is comparable to previous studies.24,31,32,33 Using the same OCT3 machine, the 93 healthy eyes in the control group of Degenring et al's study had comparable results to our subjects, with a mean retinal thickness (central 1 mm zone) of 218 μm (SD 21).31
Previous studies have confirmed that results from twin studies can be generalised to the population, as twins are comparable to singletons in many complex traits and mortality.34,35 Classical twin studies and twin modelling are based on the important assumption that the contribution of environmental factors (family environment that both twins shared while growing up, and unique environmental factors that only apply to each individual which also includes measurement error) to the observed phenotypic variance in both DZ and MZ twin pairs is the same. Hence, any greater concordance of a phenotype in MZ twins than in DZ twins is attributed to greater sharing of genetic factors. Twin studies therefore rely on a reliable and reproducible measurement technique used in all subjects.27
The participants of this study were all women, due to the difficulty in recruiting sufficient numbers of male subjects, which means we could not investigate gender differences. There is an over‐representation of women in most twin registries and the TwinsUK adult registry was also initially set up to examine osteoporosis in women.36 Interestingly, some studies have found that men have thicker retinas than women,23,33,37,38 leading to the hypothesis that the increased frequency of macular holes in women may be attributable to a thinner macular retinal thickness in women. Kurimoto et al have found that subjects with idiopathic macular holes have significantly thinner RNFLT of the papillomacular area than age‐matched controls.6 A thinner central retina may be more susceptible to tractional forces, which may induce retinal cell loss and macular holes. Although other studies have found no significant gender differences in retinal thickness,31,39 our results may have to be interpreted with care in men.
The relationship of age with retinal thickness is still controversial. Our study found no significant relationship with age, which is in agreement with several,16,33,38 but not all, previous studies.19 However, different studies have measured different retinal areas at the posterior pole suggesting that the measurement site may influence the results. Although we attempted to recruit an even age distribution, 50% of our subjects were aged 41–50 years and subjects over the age of 50 years were excluded, therefore our finding of no relationship of CRT with age should be interpreted with caution. Intraocular pressure was not significantly correlated with retinal thickness, which is in agreement with most studies that have examined this relationship.31,33
Black people and Asians have been found to have thinner CRT and RNFLT than white people.16,40 As the overwhelming majority of subjects in this study were white, these results will have to be interpreted with care in non‐white races, until normative gender‐specific data have been fully developed.
Increased axial length in high myopia is known to be associated with central and peripheral chorioretinal atrophy and it seems logical that myopes have thinner retinas than hyperopes, due to greater axial length of the eyes. Tseng et al have reported a case of high myopia with markedly reduced retinal and scleral thickness41 and Lim et al found that the retinal thickness in the parafoveal region was negatively correlated with axial length, however, the retinal thickness at the foveola increased with myopia.32 Surprisingly, evidence of the relationship between retinal thickness and axial length and spherical equivalent has not been strong, with several studies failing to show a statistically significant relationship between axial length and macular retinal thickness or RNFLT.31,38,42 As changes in axial length or refraction do not affect OCT measurements in the axial direction,43 we were able to investigate this relationship. In our study, myopia was associated with a decreased CRT.
The development of OCT technology has resulted in an objective, easy and reliable method of quantitatively assessing macular retinal thickness, which shows good reproducibility. Repeated retinal measurements on a patient by one trained operator, as well as those obtained on the same patient by different operators, are very similar.21,22,23,37 Histological studies have shown that retinal morphology and OCT imaging correlate well.44 OCT is quick to perform and well tolerated. A disadvantage of OCT is that the scan quality is partly dependent on the operator's skill. For an optimal macular scan, the scan should be centred over the fovea and this is made more difficult if subjects cannot see the fixation target due to macular disease. The operator needs to pay careful attention to scanning artefacts, which can lead the computer to misidentify retinal boundaries from which retinal thickness is calculated. The OCT image quality and therefore the accuracy of measurements are degraded in the presence of significant media opacity. By using a trained operator, and using young subjects under the age of 51 years with healthy eyes, we hoped to increase the likelihood of obtaining high‐quality scans and accurate retinal thickness measurements.
Low levels of macular pigment have been found to be associated with an increased risk of AMD.12,13,14 Given the positive relationship between macular retinal thickness and macular pigment optical density, the influence of retinal thickness on the prevalence and incidence of AMD will be an interesting subject for further studies. This classical twin study, using quantitative genetic modelling, has shown that genes are highly important in determining central macular retinal thickness, with a heritability estimate of 0.90. This supports future genetic epidemiological studies investigating conditions that may be influenced by macular retinal thickness.
Acknowledgements
The authors thank all the twin volunteers and Professor Miles Stanford for his support of this research, which enabled the use of the OCT machine for this study.
Abbreviations
AIC - Akaike information criterion
AMD - age‐related macular degeneration
CRT - central retinal thickness
MP - macular pigment
OCT - optical coherence tomography
RNFLT - retinal nerve fibre layer thickness
RPE - retinal pigment epithelium
Footnotes
Funding: Wellcome Trust. The St Thomas' United Kingdom Adult Twin Registry also receives support from the Arthritis Research Campaign and Chronic Disease Research Foundation.
Competing interests: None.
References
- 1.Bell G R. Biomechanical considerations of high myopia: Part I—Physiological characteristics. J Am Optom Assoc 199364332–338. [PubMed] [Google Scholar]
- 2.Miller D G, Singerman L J. Natural history of choroidal neovascularization in high myopia. Curr Opin Ophthalmol 200112222–224. [DOI] [PubMed] [Google Scholar]
- 3.Ohno‐Matsui K, Yoshida T. Myopic choroidal neovascularization: natural course and treatment. Curr Opin Ophthalmol 200415197–202. [DOI] [PubMed] [Google Scholar]
- 4.Kelly N E, Wendel R T. Vitreous surgery for idiopathic macular holes. Results of a pilot study. Arch Ophthalmol 1991109654–659. [DOI] [PubMed] [Google Scholar]
- 5.Sasoh M, Yoshida S, Ito Y.et al Macular buckling for retinal detachment due to macular hole in highly myopic eyes with posterior staphyloma. Retina 200020445–449. [DOI] [PubMed] [Google Scholar]
- 6.Kurimoto Y, Kaneko Y, Matsuno K.et al Evaluation of the retinal nerve fiber layer thickness in eyes with idiopathic macular holes. Am J Ophthalmol 2001131756–760. [DOI] [PubMed] [Google Scholar]
- 7.Bone R A, Landrum J T, Tarsis S L. Preliminary identification of the human macular pigment. Vision Res 1985251531–1535. [DOI] [PubMed] [Google Scholar]
- 8.Handelman G J, Dratz E A, Reay C C.et al Carotenoids in the human macula and whole retina. Invest Ophthalmol Vis Sci 198829850–855. [PubMed] [Google Scholar]
- 9.Liew S H, Gilbert C E, Spector T D.et al Central retinal thickness is positively correlated with macular pigment optical density. Exp Eye Res 200682915–920. [DOI] [PubMed] [Google Scholar]
- 10.Khachik F, Bernstein P S, Garland D L. Identification of lutein and zeaxanthin oxidation products in human and monkey retinas. Invest Ophthalmol Vis Sci 1997381802–1811. [PubMed] [Google Scholar]
- 11.Krinsky N I, Landrum J T, Bone R A. Biologic mechanisms of the protective role of lutein and zeaxanthin in the eye. Annu Rev Nutr 200323171–201. [DOI] [PubMed] [Google Scholar]
- 12.Beatty S, Murray I J, Henson D B.et al Macular pigment and risk for age‐related macular degeneration in subjects from a Northern European population. Invest Ophthalmol Vis Sci 200142439–446. [PubMed] [Google Scholar]
- 13.Gale C R, Hall N F, Phillips D I.et al Lutein and zeaxanthin status and risk of age‐related macular degeneration. Invest Ophthalmol Vis Sci 2003442461–2465. [DOI] [PubMed] [Google Scholar]
- 14.Seddon J M, Ajani U A, Sperduto R D.et al Dietary carotenoids, vitamins A, C, and E, and advanced age‐related macular degeneration. Eye Disease Case‐Control Study Group. JAMA 19942721413–1420. [PubMed] [Google Scholar]
- 15.Greenfield D S, Bagga H, Knighton R W. Macular thickness changes in glaucomatous optic neuropathy detected using optical coherence tomography. Arch Ophthalmol 200312141–46. [DOI] [PubMed] [Google Scholar]
- 16.Guedes V, Schuman J S, Hertzmark E.et al Optical coherence tomography measurement of macular and nerve fiber layer thickness in normal and glaucomatous human eyes. Ophthalmology 2003110177–189. [DOI] [PMC free article] [PubMed] [Google Scholar]
- 17.Tanito M, Itai N, Ohira A.et al Reduction of posterior pole retinal thickness in glaucoma detected using the Retinal Thickness Analyzer. Ophthalmology 2004111265–275. [DOI] [PubMed] [Google Scholar]
- 18.Zeimer R, Asrani S, Zou S.et al Quantitative detection of glaucomatous damage at the posterior pole by retinal thickness mapping. A pilot study. Ophthalmology 1998105224–231. [DOI] [PubMed] [Google Scholar]
- 19.Hee M R, Izatt J A, Swanson E A.et al Optical coherence tomography of the human retina. Arch Ophthalmol 1995113325–332. [DOI] [PubMed] [Google Scholar]
- 20.Huang D, Swanson E A, Lin C P.et al Optical coherence tomography. Science 19912541178–1181. [DOI] [PMC free article] [PubMed] [Google Scholar]
- 21.Baumann M, Gentile R C, Liebmann J M.et al Reproducibility of retinal thickness measurements in normal eyes using optical coherence tomography. Ophthalmic Surg Lasers 199829280–285. [PubMed] [Google Scholar]
- 22.Gurses‐Ozden R, Teng C, Vessani R.et al Macular and retinal nerve fiber layer thickness measurement reproducibility using optical coherence tomography (OCT‐3). J Glaucoma 200413238–244. [DOI] [PubMed] [Google Scholar]
- 23.Massin P, Vicaut E, Haouchine B.et al Reproducibility of retinal mapping using optical coherence tomography. Arch Ophthalmol 20011191135–1142. [DOI] [PubMed] [Google Scholar]
- 24.Paunescu L A, Schuman J S, Price L L.et al Reproducibility of nerve fiber thickness, macular thickness, and optic nerve head measurements using StratusOCT. Invest Ophthalmol Vis Sci 2004451716–1724. [DOI] [PMC free article] [PubMed] [Google Scholar]
- 25.Photocoagulation for diabetic macular edema Early Treatment Diabetic Retinopathy Study report number 1. Early Treatment Diabetic Retinopathy Study research group. Arch Ophthalmol 19851031796–1806. [PubMed] [Google Scholar]
- 26.Martin N G, Martin P G. The inheritance of scholastric abilities in a sample of twins. I. Ascertainments of the sample and diagnosis of zygosity. Ann Hum Genet 197539213–218. [DOI] [PubMed] [Google Scholar]
- 27.Kyvic K O. In: Spector TD, Snieder H, MacGregor AJ, eds. Advances in Twin and Sib‐pair Analysis. Greenwich Medical Media 2000
- 28.Neale M C.Mx: Statistical modeling. Department of Psychiatry, Medical College of Virginia; 1997 edn 2004
- 29.Neale M C, Cardon L R.Methodology for genetic studies of twins and families. Dordrecht: Kluwer Academic Publishers, 1992
- 30.Hougaard J L, Kessel L, Sander B.et al Evaluation of heredity as a determinant of retinal nerve fiber layer thickness as measured by optical coherence tomography. Invest Ophthalmol Vis Sci 2003443011–3016. [DOI] [PubMed] [Google Scholar]
- 31.Degenring R F, Aschmoneit I, Kamppeter B.et al Optical coherence tomography and confocal scanning laser tomography for assessment of macular edema. Am J Ophthalmol 2004138354–361. [DOI] [PubMed] [Google Scholar]
- 32.Lim M C, Hoh S T, Foster P J.et al Use of optical coherence tomography to assess variations in macular retinal thickness in myopia. Invest Ophthalmol Vis Sci 200546974–978. [DOI] [PubMed] [Google Scholar]
- 33.Wong A C, Chan C W, Hui S P. Relationship of gender, body mass index, and axial length with central retinal thickness using optical coherence tomography. Eye 200519292–297. [DOI] [PubMed] [Google Scholar]
- 34.Andrew T, Hart D J, Snieder H.et al Are twins and singletons comparable? A study of disease‐related and lifestyle characteristics in adult women. Twin Res 20014464–477. [DOI] [PubMed] [Google Scholar]
- 35.Christensen K, Vaupel J W, Holm N V.et al Mortality among twins after age 6: fetal origins hypothesis versus twin method. BMJ 1995310432–436. [DOI] [PMC free article] [PubMed] [Google Scholar]
- 36.Boomsma D I. Twin registers in Europe: an overview. Twin Res 1998134–51. [DOI] [PubMed] [Google Scholar]
- 37.Muscat S, Parks S, Kemp E.et al Repeatability and reproducibility of macular thickness measurements with the Humphrey OCT system. Invest Ophthalmol Vis Sci 200243490–495. [PubMed] [Google Scholar]
- 38.Wakitani Y, Sasoh M, Sugimoto M.et al Macular thickness measurements in healthy subjects with different axial lengths using optical coherence tomography. Retina 200323177–182. [DOI] [PubMed] [Google Scholar]
- 39.Alamouti B, Funk J. Retinal thickness decreases with age: an OCT study. Br J Ophthalmol 200387899–901. [DOI] [PMC free article] [PubMed] [Google Scholar]
- 40.Poinoosawmy D, Fontana L, Wu J X.et al Variation of nerve fibre layer thickness measurements with age and ethnicity by scanning laser polarimetry. Br J Ophthalmol 199781350–354. [DOI] [PMC free article] [PubMed] [Google Scholar]
- 41.Tseng J J, Turano M R, Jr, Langton K.et al Measurement of retinal thickness by ocular coherence tomography in a case of scleral transparency in high myopia. Am J Ophthalmol 2004138169–170. [DOI] [PubMed] [Google Scholar]
- 42.Garcia‐Valenzuela E, Mori M, Edward D P.et al Thickness of the peripapillary retina in healthy subjects with different degrees of ametropia. Ophthalmology 20001071321–1327. [DOI] [PubMed] [Google Scholar]
- 43.Koozekanani D, Roberts C, Katz S E.et al Intersession repeatability of macular thickness measurements with the Humphrey 2000 OCT. Invest Ophthalmol Vis Sci 2000411486–1491. [PubMed] [Google Scholar]
- 44.Toth C A, Narayan D G, Boppart S A.et al A comparison of retinal morphology viewed by optical coherence tomography and by light microscopy. Arch Ophthalmol 19971151425–1428. [DOI] [PubMed] [Google Scholar]


