Non‐alcoholic fatty liver disease (NAFLD) is one of the most common causes of chronic liver injury in many countries around the world.1 NAFLD covers a wide spectrum, ranging from simple steatosis—which is generally non‐progressive—to non‐alcoholic steatohepatitis (NASH). There are no established non‐invasive methods of evaluation for patients with NASH, and until recently liver biopsy was the only method for evaluating liver fibrosis. Transient elastography is a new technique that allows rapid, non‐invasive measurement of mean tissue stiffness, which has been shown to be useful for accurate estimation of hepatic fibrosis in patients with chronic hepatitis C.2
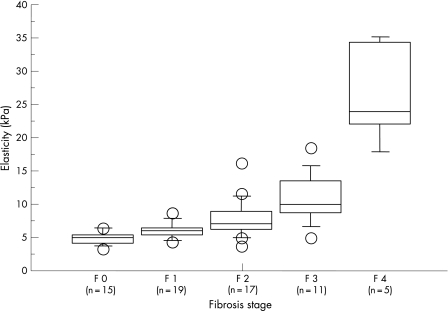
We carried out a study to determine the value of liver stiffness measurement with the new medical device called the Fibroscan (EchoSens, Paris, France), based on ultrasound transient elastography, in patients with NAFLD. We carried out liver stiffness measurements in 67 NAFLD patients (mean (SD) age, 50.4 (3.3) years) in whom the diagnosis had been confirmed by liver biopsy and the severity of fibrosis had been scored according to Brunt.3 Box plots were prepared to show the elasticity measurements according to the stage of histological fibrosis (fig 1). The median liver stiffness values (with 95% confidence intervals) were F 0, 4.907 (4.417 to 5.396) kPa; F 1, 6.142 (5.582 to 6.702) kPa; F2, 7.894 (6.384 to 9.404) kPa; F3, 11.027 (8.555 to 13.500) kPa; F4, 26.960 (17.705 to 36.215) kPa. The results of the analysis revealed stepwise increases in liver stiffness with increasing histological severity of hepatic fibrosis (p<0.0001 by Kruskal–Wallis test). The areas under the receiver operating characteristic curves (AUROC)—which estimate the diagnostic performance of the elasticity measurements for hepatic fibrosis stage equal to or greater than F 1, F 2, F 3, and F 4—were 0.881, 0.876, 0.914, and 0.997, respectively. Table 1 shows the optimal liver stiffness cut off values for NAFLD patients. The sensitivity, specificity, positive predictive value (PPV), and negative predictive value (NPV) were calculated.
Figure 1 Box plots showing the interquartile range (box), median (thick line), range (thin lines), and outliers (circles) of liver stiffness measurements. A steady stepwise increase in elasticity was observed as the severity of hepatic fibrosis.
Table 1 Value of liver stiffness measurements in non‐alcoholic fatty liver disease for estimating the stage of liver fibrosis.
| Cut off value | Se (%) | Sp (%) | PPV (%) | NPV (%) | |
|---|---|---|---|---|---|
| F>1 (F 0 vs F 1–4) | 5.60 (kPa) | 82.7 | 81.3 | 93.5 | 59.1 |
| F>2 (F 0, 1 vs F 2–4) | 6.65 (kPa) | 81.8 | 91.2 | 90.0 | 83.8 |
| F>3 (F 0–2 vs F 3, 4) | 8.00 (kPa) | 87.5 | 84.3 | 63.6 | 95.6 |
| F>4 (F 0–3 vs F 4) | 17.0 (kPa) | 100 | 98.4 | 83.3 | 100 |
NPV, negative predictive value; PPV, positive predictive value; Se, sensitivity; Sp, specificity.
The results of our study showed a significant positive correlation between liver stiffness and the severity of liver fibrosis in patients with NAFLD. Rapid, non‐invasive estimation of the stage of fibrosis in NAFLD patients, especially NASH patients, is of major clinical interest because such patients have been shown to be at a high risk of developing complications such as portal hypertension or hepatocellular carcinoma, and therefore require close follow up. On the other hand, liver tissue containing fat deposition is presumably softer than healthy liver parenchyma, and sound velocity has been reported to decrease as fatty liver progressed in an animal experiment. However, the results of the present study also confirmed that the correlation between liver stiffness and the severity of fibrosis is unaffected by the grade of activity or degree of steatosis.4
The results show that liver stiffness measurements are a useful means of estimating the severity of hepatic fibrosis in NAFLD patients. This is the first study to demonstrate a consistent and major increase in liver stiffness in NASH patients, as confirmed by the results of liver biopsy, which remains the gold standard for evaluation of the severity of liver fibrosis in such patients. Liver stiffness measurement is a non‐invasive, clinically useful method for estimating the severity of liver fibrosis in NASH.
Supplementary Material
Footnotes
Conflict of interest: None declared.
References
- 1.Angulo P. Nonalcoholic fatty liver disease. N Engl J Med 2002181221–1231. [DOI] [PubMed] [Google Scholar]
- 2.Moreno‐Otero R, Trapero‐Marugan M, Mendoza J. Liver fibrosis assessment by transient elastography in hepatitis C patients with normal alanine aminotransferase. Gut 2006551055–1056. [PMC free article] [PubMed] [Google Scholar]
- 3.Brunt E M. Nonalcoholic steatohepatitis: definition and pathology. Semin Liver Dis 2001213–16. [DOI] [PubMed] [Google Scholar]
- 4.Sandrin L, Fourquet B, Hasquenoph J M.et al Transient elastography: a new noninvasive method for assessment of hepatic fibrosis. Ultrasound Med Biol 2003291705–1713. [DOI] [PubMed] [Google Scholar]
Associated Data
This section collects any data citations, data availability statements, or supplementary materials included in this article.


