

Abstract
Objective
To evaluate the impact of Medicaid Managed Care (MMC) on racial disparities in access to care consistent with the Institute of Medicine (IOM) definition of racial disparity, which excludes differences stemming from health status but includes socioeconomic status (SES)-mediated differences.
Data Sources
Secondary data from the Adult Samples of the 1997–2001 National Health Interview Survey, metropolitan statistical area (MSA)-level Medicaid Health Maintenance Organization (MHMO) market share from the 1997 to 2001 InterStudy MSA Trend Dataset, and MSA characteristics from the 1997 to 2001 Area Resource File.
Study Design
I estimate multivariate regression models to compare racial disparities in doctor visits, emergency room (ER) use, and having a usual source of care between enrollees in MMC and Medicaid Fee-for-Service (FFS) plans. To contend with potential selection bias, I use a difference-in-difference analytical strategy and assess the impact of greater MHMO market share at the MSA level on Medicaid enrollees' access measures. To implement the IOM definition of racial disparity, I adjust for health status but not SES factors using a novel method to transform the distribution of health status for minority populations to approximate the white health status distribution.
Principal Findings
MMC enrollment is associated with lowered disparities in having any doctor visit in the last year for blacks, and in having any usual source of care for both blacks and Hispanics. Increasing Medicaid HMO market share lowered disparities in having any doctor visits in the last year for both blacks and Hispanics. Although disparities in most other measures were not much affected, black–white ER use disparities exist among MMC enrollees and in areas of high MHMO market share.
Conclusions
MMC programs' reduction of some disparities suggests that recent shifts in Medicaid policy toward managed care plans have benefited minority enrollees. Future research should investigate whether black–white disparities in ER use within MMC groups represent the flexibility of MMC plans to locate primary care in ERs or an inefficient delivery of care.
Keywords: Racial disparities, medicaid managed care, statistical adjustment for health status
There is substantial evidence of racial disparities in health care access and utilization. Hispanics and African Americans are less likely than whites to have a regular primary care provider, and more likely to report emergency room (ER) use (Collins, Hall, and Neuhaus 1999). African Americans and Hispanics are also less likely than whites to have a usual source of care and to have a health care visit in the last year, disparities that persist even after controlling for poverty status (Kaiser Family Foundation 2003). Spanish-speaking Hispanic patients are less likely to have an influenza vaccination (Fiscella et al. 2002), Hispanic women have lower rates of breast cancer screening than African Americans and whites, and African Americans are less likely than whites to receive preventive screening and diagnostic services for cancer (Collins, Hall, and Neuhaus 1999).
The Medicaid program is a suitable environment for studying the effect of managed care on racial disparities in access and utilization because of its disproportionate enrollment of racial minorities. With spiraling costs in the late 1980s and early 1990s, many U.S. health insurance organizations tightened management of care to stem further increases in health care spending (Levit et al. 2000). State Medicaid agencies also turned to managed care under federal program waivers to help slow health care spending and to improve access to quality health care (Kaestner, Dubay, and Kenney 2002). In 2001, some version of managed care was implemented in 48 state programs and more than 57 percent of all Medicaid enrollees were enrolled in managed care programs (CMS 2002).
Medicaid Managed Care (MMC) programs organize providers and control costs largely through two distinct models: Health Maintenance Organization (HMO) or Primary Care Case Management (PCCM). In HMO programs, the state Medicaid agency contracts directly with a prepaid health plan that assumes the risk of providing services through its own physician staff or contracts with physician organizations. In 2001, 70 percent of MMC enrollees were enrolled in commercial and Medicaid-only HMOs, compared with 27.3 percent in Medicaid PCCM programs (CMS 2002). In PCCM programs, Medicaid agencies contract with a primary care gatekeeper entity (paid fee-for-service plus a monthly coordination fee) that coordinates primary and specialty care. MMC plans pay physician organizations through full capitation (prospective payment for each individual patient adjusting for some measures of age, gender, or health status), fee-for-service (retrospective payment paid per service), or a mixture of the two (Robinson et al. 2004).
POTENTIAL EFFECTS OF MMC ON RACIAL DISPARITIES IN HEALTH CARE ACCESS AND UTILIZATION
Because Medicaid beneficiaries face few financial barriers to care, racial disparities are more likely to be influenced by supply side behaviors of MMC plans. Medicaid reimbursements are lower than private insurance reimbursements, deterring some providers from accepting Medicaid patients, and further decreasing the number of providers available to geographically isolated Medicaid recipients. To overcome this problem, state Medicaid agencies can contractually require MMC plans to supply an adequate number of providers in an area, and to provide initial visits for all enrollees for which the plan is responsible. These requirements, along with MMC plans' general emphasis on prevention, coordination of care, and provision of a usual site of care, might increase utilization for all beneficiaries. To the extent that minorities have disproportionately uncoordinated care, these efforts will also reduce disparities. States have also used their purchasing power to require interventions that address disparities. For example, the California MMC contract includes a nondiscrimination clause. The New Jersey MMC contract requires plans to create provider networks that can serve the language needs of enrollees. Colorado requires that its providers offer culturally competent services (McDonough et al. 2004).
Alternatively, MMC may increase racial disparities because of the characteristics of managed care organizations and their contracted physician organizations. In states without geographical coverage requirements, MMC-contracted doctors may be less likely to locate in residential areas where minorities live. MMC-affiliated physician associations located in poor, minority communities may be able to exercise more aggressive cost containment measures because these communities lack financial and political resources to appeal cost containment policies (Hurley, Freund, and Gage 1991; Szylagyi 1998).
Selection issues complicate the causal interpretation of the impact of MMC on racial disparities in health care access and utilization. Choice between MMC or Medicaid FFS plans may vary by race. For example, minorities may be reluctant to sign up for managed care if MMC-affiliated medical offices are far from their neighborhoods or do not have minority physicians. If these differential responses are correlated with health status and utilization measures, then changes in racial disparities cannot be causally attributed to the impact of MMC enrollment.
PREVIOUS RESEARCH
Effect of MMC on Overall Health Care Access and Utilization
Studies comparing MMC to Medicaid FFS show mixed effects of MMC on health utilization, health access, satisfaction, and health outcomes. Medicaid HMO programs reduced ER use for children (Gavin, Farrelly, and Simpson 1998; Garrett, Davidoff, and Yemane 2003), made adult enrollees less dependent on the ER as a usual source of care, and increased their likelihood of having a usual source of care and a doctor visit in the last year (Zuckerman, Brennan, and Yemane 2002). However, Lillie-Blanton and Lyons (1998) found that unhealthy MMC enrollees were more likely to use the ER than similarly unhealthy Medicaid FFS enrollees. Basu, Friedman, and Burstin (2004) found no difference in preventable hospitalizations between individuals enrolled in MMC plans and Medicaid FFS plans. Studies of the effect of MMC on women's health were also mixed. Women's participation in Medicaid HMO programs reduced non-ER use and increased reported unmet need for medical care (Garrett, Davidoff, and Yemane 2003), but had no effect on prenatal care use, birth outcomes, and cesarean section rates (Kaestner, Dubay, and Kenney 2002).
Effect of Managed Care on Racial Disparities in Health Care Access and Utilization
The evidence is inconclusive on the effect of managed care on access to health care among racial and ethnic minorities, and disparities are measured inconsistently in existing studies. Tai-Seale, Freund, and LoSasso (2001) found that black–white disparities in service use were larger in a MMC-mandated waiver county than in a nonwaiver county. Currie and Fahr (2002) found that an increase in state MMC penetration rates led to a significant decrease in doctor visits among black children and infants with chronic conditions.
Findings among non-Medicaid populations show a more positive impact of managed care on disparities. Haas et al. (2002) found no significant differences in preventive care usage between African Americans in private managed care plans and private FFS plans, but higher rates of mammography, breast exam, and pap smear among Hispanics in private managed care plans compared with Hispanics in private FFS plans. Balsa, Cao, and McGuire (2006) found that Medicare Managed Care had no effect on health care disparities except a reduction of Hispanic–white disparities in having a usual source of care.
The current paper differs from previous research on MMC and racial disparities in that it uses a method of calculating disparities that adjusts for health status and incorporates the mediating effects of socioeconomic status (SES). In addition, this paper incorporates methods that mitigate the threat of selection bias, and estimates models on survey data that are nationally representative for African American, Hispanic, and white adults. The study provides national average estimates of the impact of MMC, representing what a state or county can expect after an increase or decrease in MMC enrollment and Medicaid HMO market share.
DATA
Three sources of data were used for this study: The National Health Interview Survey (NHIS) Adult Sample (1997–2001), the Area Resource File (ARF) (1997–2001), and InterStudy Metropolitan Statistical Area (MSA) Trend Data (1997–2001). The 1997–2001 NHIS includes a wide variety of health access, utilization, insurance, and outcome measures, as well as an MSA identifier for individuals residing in large MSAs (>1 million persons). An individual is considered to be enrolled in MMC if he/she is required to choose from a list of doctors, is assigned a doctor, is required to sign up with a certain group of doctors or clinic, or needs approval or a referral for specialty care.1
Health status variables include: self-reported health status (categorized as good/very good/excellent versus poor/fair), having any limitation in the last year, reporting having ever had a specific health condition (hypertension, congenital heart disease, heart attack, stroke, asthma, ulcer, diabetes, sinusitis, bronchitis), being pregnant, having lower back pain in the last 3 months, and having a migraine headache in the last 3 months. Health behaviors considered to be related to health status for the purposes of this paper are being a current smoker, doing light to moderate exercise at least once a week, drinking greater than five drinks at a time in the last year, and being greater than 10 percent above desirable body weight according to the Metropolitan Life Insurance Company standards of desirable body weight. Other demographic variables that are related to health status are age, gender, and marital status. Variables associated with SES factors are education (education less than high school, high school graduate, any college) nativity (foreign born versus U.S. born), and living in extreme poverty (less than 50 percent of federal poverty level). NHIS data were weighted to be representative of the noninstitutionalized, civilian, nonelderly, nondisabled, and Medicaid-enrolled adult population of the United States, and the stratification and sampling strategy of the NHIS were taken into account when estimating standard errors. Because initial analysis showed that the contribution of income imputation to the variances of estimates was negligible, final models were based on a single imputed dataset.
MSA level factors used in these analyses, including median area income, HMO penetration and HMO competition indicators, were linked to the NHIS datasets by MSA and year indicators. MSA-level Medicaid HMO market share was calculated from the 1997–2001 InterStudy MSA Trend Data by dividing the number of Medicaid beneficiaries enrolled in HMOs in the MSA by the number of Medicaid enrollees in the MSA.2 This dataset identifies only those MMC beneficiaries enrolled in a Medicaid-only or commercial HMO, but these comprise the majority of MMC enrollees. Using the MHMO variable focuses the analysis on MMC plans that have specific characteristics of organization of health services delivery and provider reimbursement. Medicaid PCCMs, where most other Medicaid beneficiaries were enrolled, had no effect on utilization and access compared with Medicaid FFS plans (Garrett, Davidoff, and Yemane 2003) and, according to this dataset, no effect on racial disparities in having a doctor visit in the last year, having a usual source of care, and ER use in the last year (results available upon request).
METHODS
Defining and Measuring Racial Disparities
According to the Institute of Medicine (IOM) (2002), racial differences in quality of health care are attributable to three distinct categories of effects, those of: (1) clinical appropriateness and need and patient preferences, (2) the operation of health care systems and the legal and regulatory climate, and (3) discrimination. Differences due to health status, including age-related differences, should not be considered as part of the disparity, but components of the difference that are unrelated to health status and preferences should. Individuals of lower SES may have more difficulty paying for care, and navigating health care services and the legal and regulatory infrastructure. If minorities are disproportionately represented in lower SES categories, then this failure of health services to serve lower SES groups contributes to racial disparities. Potential health system-level sources of disparities include the restrictive network of health plans and location of high quality health care institutions in relation to minority neighborhoods. Finally, differences in quality of health care because of discrimination, the differential provision of services by a provider, whether based on prejudice, stereotypes, problems in cultural communication, or statistical discrimination (Balsa and McGuire 2003), also contribute to disparities in quality of health care.
Although racial differences in health status could reflect past unequal access to care, inequalities in environmental conditions and the absorption of cumulative shocks from racism over a life course, such differences are not consequences of the health care encounter under study. Focusing on the influence of nonhealth status/preference related variables on current health care use allows identification of those areas of the health delivery system in which current policy changes might affect disparities: provision of health insurance, income transfer programs, reduction of discrimination in medical care, elimination of barriers to care, etc.
Model Estimation
I measured the relationship between MMC and black–white and Hispanic–white disparities in having a usual source of care, having any doctor visit in the last year and having any ER use in the last year. Disparity measurements of other racial and ethnic minority groups were excluded because of inadequate sample size.
I conducted two complementary analyses, one measuring the association of MMC enrollment and the other measuring the impact of MSA-level Medicaid HMO (%MHMO) market share. Both are difference-in-difference analyses. Model 1 subtracts the effect of MMC enrollment on access and utilization in the white group from the effect of MMC enrollment in the Hispanic and black groups, addressing the endogeneity of the self-reported MMCijt enrollment measure by differencing away two potentially unrelated sources of variation. Estimates of the difference-in-differences can be obtained directly using the following equation for individual i residing in MSA j at time t:
 |
(Model 1) |
where Yijt is the outcome health access/utilization measure, f the inverse logistic function, MMCijt the enrollment in MMC organization, Racei the race/ethnicity indicator variable, Healthi the vector of health status indicator variables, Xi the vector of individual characteristics, including poverty status, nativity, and education, Zjt the vector of MSA-level income and HMO competition characteristics by year, Yeart the vector of year indicator variables, and Statej the vector of dummy variables indicating the state of an individual's reported MSA.
Controlling for year fixed effects adjusts for secular trends and yearly changes in federal Medicaid policy such as changes in federal financial outlays, and minimum and maximum benefits as required by federal government regulations. Controlling for state fixed effects adjusts for time-invariant differences among state Medicaid policies, including changes in eligibility levels, service reimbursement amounts, and application and enrollment procedures. Multiple years of cross-sectional data and the fact that some states have more than one MSA with differing MMC enrollment rates provide variation beyond the state fixed effects. All predictors with interaction terms in the model were “centered” by subtracting the mean value so that main effects are interpretable (Kraemer and Blasey 2002).
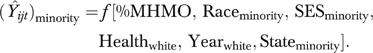
Individual enrollment in MMC is endogenous in health care access and utilization equations in areas where enrollees can choose between MMC and Medicaid FFS plans. This could threaten internal validity even in a difference-in-difference analysis if individuals in different racial/ethnic subgroups exhibit different selection behaviors in response to increased MMC market share. In order to address the bias on the treatment effect of MMC caused by differential selection, I re-estimated Model 1 using %MHMO market share per MSA:
 |
(Model 2) |
Model 2 results allow for causal inference under the assumption that changes in %MHMO market share are independent of other predictors of racial disparities in access and utilization. The problem of endogeneity inherent to Model 1 is addressed by measuring the impact of differences in geographical regions' availability of services, rather than differences in individuals' enrollment choices. Model 2 also complements Model 1 by focusing specifically on the impact of Medicaid HMOs. Taken together, results of the two models present a more complete picture of the impact of MMC and provide guidance to Medicaid policymakers on the impact of changes in MMC enrollment and HMO market share.
Interpretations are complicated by the heterogeneity in programs established in different regions of the country. Some of the heterogeneity was captured by limiting the analysis to MSAs greater than 1 million people, by controlling for regional HMO competition and penetration characteristics, and by focusing specifically on the impact of Medicaid HMO market share. These analyses do not measure the impact of a specific region's innovation in MMC provision, but do provide the estimated predicted impact of an increase or decrease in MMC enrollment and MHMO market share.
Interpreting Model Estimation in the Context of Measuring Racial Disparities
To interpret the results of model estimation using the definition of racial disparities described above, health status variables were adjusted using a method similar to McGuire et al. (2006). For health status variables, the entire distribution of minority health values (not just the mean) was transformed to allow for more accurate predictions in nonlinear models. Given that all health status variables in this study are binary, the minority health status related variables were adjusted by randomly switching minority responses from 0 to 1 if  (or 1 to 0 if
  ) until the percentage of positive responses for minorities and whites in the health status variable were equivalent.3 Year fixed effects were transformed in a similar manner to prevent racial differences mediated by year of survey response from being considered as part of the disparity.
Values for all variables other than health status or patient preferences, including significant interactions between race and nonhealth status variables, were allowed to differ among individuals and across racial groups, and this variation was included in predictions of access and utilization. State of residence was also treated like nonhealth status variables in that state-mediated racial/ethnic differences are included in the disparity. Geographic location is likely to be a mediator of racial differences because of the concentration of black and Hispanic minorities in certain areas of the United States, and the large differences in health outcomes and health care patterns by region (Chandra and Skinner 2003). A nationwide evaluation of MMC should identify the program's overall effects on racial differences, including those differences mediated by geography.
Calculation of the disparity compares the white model-based prediction (Prediction 1) with a minority counterfactual prediction (Prediction 2) that leaves race and other nonhealth status variables (SES and geography) equal to their original values but transforms all health status variables and year effects to their distributions for whites. The “white” and “minority” subscripts represent the distribution of the variable by racial/ethnic category.
| (Prediction 1) |
 |
(Prediction 2) |
The difference  is a disparity that is calculated in a way that matches the IOM definition.
Predictions 1 and 2 were calculated using results from Model 1 (Table 3, top panel) and Model 2 (Table 3, lower panel). In order to present the impact of Medicaid HMO market share on racial disparities from Model 2, disparity predictions were calculated at a low MHMO market share rate (mean %MHMO minus one standard deviation) and a high MHMO market share rate (mean %MHMO plus one standard deviation).
Table 3.
Comparison of Predicted Probabilities and Disparity Changes Regressing Access and Utilization Measures on Two Different Medicaid Managed Care Measures (n =3,286)*
| White (%) | Black (%) | Disparity (%) | Hispanic (%) | Disparity (%) | |
|---|---|---|---|---|---|
| Medicaid managed care enrollment | |||||
| Any doctor visit in last year | |||||
| Enrolled in Medicaid FFS | 86.3 (1.5) | 82.5 (1.4) | 3.8 (1.3)† | 81.5 (2.1) | 4.8 (1.8)† |
| Enrolled in Medicaid MMC | 89.4 (1.1) | 88.0 (0.8) | 1.4 (1.4) | 83.2 (1.0) | 6.2 (1.5)† |
| Δ Disparity | 2.4 (0.9) | −1.4 (1.2) | |||
| Have a usual source of care | |||||
| Enrolled in Medicaid FFS | 89.8 (1.2) | 87.7 (0.9) | 2.0 (1.3) | 86.4 (1.4) | 3.4 (1.4)† |
| Enrolled in Medicaid MMC | 91.1 (0.8) | 93.1 (0.7) | −2.0 (1.0)† | 92.3 (0.7) | −1.2 (1.1) |
| Δ Disparity | 4.1 (0.9) | 4.6 (1.1) | |||
| Any ER use in last year | |||||
| Enrolled in Medicaid FFS | 36.4 (2.2) | 38.2 (2.2) | −1.7 (2.0) | 31.3 (1.9) | 5.2 (1.9)† |
| Enrolled in Medicaid MMC | 38.1 (1.8) | 43.5 (1.5) | −5.5 (2.3)† | 32.1 (1.5) | 5.9 (2.4)† |
| Δ Disparity | 3.7 (1.2) | −0.7 (1.8) | |||
| % Medicaid HMO market share in MSA | |||||
| Any doctor visit in last year | |||||
| Low HMO penetration | 89.5 (2.1) | 83.9 (1.8) | 5.6 (2.0)† | 80.6 (1.9) | 8.9 (2.3)† |
| High MHMO penetration | 87.8 (1.1) | 87.6 (1.0) | 0.2 (1.4) | 84.7 (1.2) | 3.1 (1.3)† |
| Δ Disparity | 5.4 (2.1) | 5.8 (2.3) | |||
| Have a usual source of care | |||||
| Low HMO penetration | 88.7 (1.7) | 88.9 (1.3) | −0.2 (2.0) | 88.9 (1.2) | −0.2 (1.9) |
| High MHMO penetration | 91.7 (1.1) | 92.2 (1.2) | −0.6 (1.2) | 89.3 (1.7) | 2.3 (1.8) |
| Δ Disparity | 0.4 (2.2) | −2.5 (2.7) | |||
| Any ER use in last year | |||||
| Low HMO penetration | 35.7 (2.9) | 37.6 (2.2) | −1.9 (3.0) | 29.6 (1.5) | 6.0 (3.0)† |
| High MHMO penetration | 39.4 (2.6) | 43.7 (2.2) | −4.4 (2.3)‡ | 33.5 (2.1) | 5.9 (2.5)† |
| Δ Disparity | 2.5 (3.8) | 0.2 (4.3) | |||
Standard errors are calculated using bootstrap methodology that takes into account sampling weights and stratification used in the NHIS.
Significant difference within MHMO penetration category at 5% level.
Marginally significant difference within MHMO penetration category (p<.058).
Numbers in bold represent a significant difference-in-difference at 5% level.
FFS, fee for service; MMC, Medicaid Managed Care; MHMO, Medicaid Health Maintenance Organization; HMO, health maintenance organization; NHIS, National Health Interview Survey; ER, emergency room.
Variance estimates of difference-in-difference comparisons were calculated using a bootstrap procedure (Efron 1979) using robust variance estimation for cluster-correlated data (Rogers 1993) that accounts for the fact that individuals are independent across, but not within, MSAs. Using the Medicaid enrollee dataset described above, I created 100 bootstrap samples by randomly selecting, with replacement, MSAs within NHIS strata, to replicate the NHIS design. From each sample, I obtained Predictions 1 and 2 estimates at low and high MHMO market share rates. Finally, disparity and difference-in-disparities estimates were calculated for each of the 100 bootstrap samples, and standard errors were generated using the replicated results.
RESULTS
Unadjusted Rates
Table 1 displays health status and health utilization measures, sociodemographic and geography characteristics by race for individuals in the 1997–2001 NHIS. Blacks in the Medicaid enrollee sample were less educated, poorer, and more likely to be female and unmarried, in comparison with whites. Hispanics were less educated, poorer, and more likely to be foreign-born, compared with whites. Minorities were healthier overall than whites, with significantly lower rates of reported limitation of activity, ulcer, bronchitis, lower back pain, and migraine headaches, but blacks had significantly higher rates of hypertension than whites. Minorities were less likely to drink and smoke, but they were more likely to be overweight and Hispanics were less likely to exercise.
Table 1.
Weighted Population Characteristics N =3,286 Nondisabled, Nonelderly Adults Enrolled in Medicaid
| White (n =800) | Black (n =1,204) | Hispanic (n =1,282) | Total | ||
|---|---|---|---|---|---|
| Weighted Percentage | 34.9% | 37.3% | 27.7% | (n =3,286) | |
| Doctor visits | % with any doctor visit in last 12 months | ||||
| FFS | 86.1 | 83.2 | 80.1 | 83.2 | |
| MMC | 89.7 | 88.5* | 82.6† | 87.5 | |
| Has a usual source of care | % with usual source of care | ||||
| FFS | 89.8 | 89.3 | 86.1 | 88.5 | |
| MMC | 91.1 | 94.1* | 93.0*‡ | 92.7 | |
| ER use | % with ER use in last 12 months | ||||
| FFS | 35.1 | 35.8 | 28.6† | 33.3 | |
| MMC | 39.3 | 40.5 | 27.5† | 36.9 | |
| Education | <High school | 29.6 | 41.9† | 59.2† | 42.3 |
| High school graduate | 37.5 | 36.0 | 22.1† | 32.8 | |
| Any college | 33.0 | 22.1† | 18.7† | 24.9 | |
| Age | 19–24 | 22.8 | 28.9 | 24.7 | 25.7 |
| 25–34 | 27.7 | 30.3 | 27.5 | 28.6 | |
| 35–44 | 23.6 | 22.1 | 25.3 | 23.5 | |
| 45–54 | 17.1 | 10.4† | 13.8 | 13.7 | |
| 55–64 | 8.7 | 8.3 | 8.7 | 8.5 | |
| Nativity | Foreign-born | 12.2 | 6.5† | 59.6† | 22.8 |
| Gender | Female | 68.2 | 80.0† | 75.1† | 74.7 |
| Marital status | Married | 40.0 | 14.9† | 40.8 | 30.5 |
| Poverty status | <50% FPL | 21.4 | 32.8† | 31.3† | 28.5 |
| Health status | Good, very good, excellent | 74.9 | 76.6 | 76.6 | 76.0 |
| Limitation of activity | Any limitation in last year | 41.0 | 25.0† | 22.1† | 29.7 |
| Health conditions | Hypertension | 18.7 | 25.0† | 19.0 | 21.2 |
| Congenital heart disease | 2.8 | 2.0 | 1.8 | 2.2 | |
| Heart attack | 3.6 | 2.1† | 1.8† | 2.5 | |
| Stroke | 3.4 | 2.1 | 2.3 | 2.6 | |
| Asthma | 8.2 | 7.2 | 6.4 | 7.3 | |
| Ulcer | 11.8 | 7.6† | 6.8† | 8.8 | |
| Diabetes | 5.2 | 6.7 | 8.4† | 6.7 | |
| Sinusitis | 17.5 | 15.5 | 12.6† | 15.4 | |
| Bronchitis | 11.6 | 6.4† | 4.1† | 7.6 | |
| Pregnant | 6.2 | 4.9 | 8.9 | 6.4 | |
| Lower back pain in last 3 months | 39.5 | 31.5† | 34.8 | 35.1 | |
| Migraine in last 3 months | 33.3 | 25.1† | 25.7† | 28.1 | |
| Health behaviors | Smoker | 45.2 | 36.0† | 21.3† | 35.2 |
| Exercise | 32.7 | 31.6 | 26.3† | 30.5 | |
| Drink greater than five drinks | 17.8 | 10.5† | 11.8† | 13.4 | |
| Overweight | 55.1 | 65.8† | 61.2† | 60.9 |
Significant difference within race at 5% level.
Significance difference compared to whites at 5% level.
Marginally significant difference-in-difference by race and Medicaid plan type (p <.09).
FFS, fee-for-service; MMC, Medicaid Managed Care.
In an unadjusted analysis of having a doctor visit in the last year, there were significant “first differences” (differences calculated within managed care category or within racial category) in plan effects between black MMC and FFS beneficiaries and between white and Hispanic MMC enrollees, but no significant difference-in-differences as measured by the “Race × MMC” interaction coefficient in an unadjusted regression (results not shown). MMC marginally lowered the Hispanic–white difference in having a usual source of care at the 10 percent level (p<.09). Hispanics had significantly lower ER use than whites in both FFS and MMC plans.
Model Coefficients
Model 2 results for having any doctor visit in the last year (Table 2) show that blacks and Hispanics were significantly less likely to have seen a doctor in the last year. However, the positive black ×%MHMO interaction term indicates that blacks in MSAs with higher MHMO market share were more likely to have seen a doctor in the last year (relative to whites) than blacks in MSAs with lower MHMO market share. Females of any race were more likely than males to have any doctor visit in the last year, but black females were less likely to have a doctor visit in the last year compared with their white counterparts. Significantly positive predictors of having a doctor visit in the last year include: having any college education, being 18–24 years old, living in a poorer MSA, having any limitation of activity, hypertension, diabetes, sinusitis and migraines. The second column of Table 2 shows that the %MHMO variable was not a significant predictor of having a usual source of care. Positive predictors of having a usual source of care were being female, completing the NHIS in 2001 (not shown), and reporting asthma, whereas being foreign-born was a negative predictor. In a similarly specified model of ER use (third column of Table 2), poor Hispanics and female blacks were less likely to have had an ER visit in the last year than their counterparts of other races. Foreign-born individuals of any race were less likely to have used the ER in the last year, and foreign-born individuals in MSAs with higher rates of Medicaid HMO market share were less likely to have an ER visit. Enrollees aged 18–24 were more likely to have had an ER visit in the last year than older enrollees. Significant negative predictors of ER use were being aged 55–64, and having fair, good, or excellent health status. Positive predictors of ER use were reported hypertension, heart attack, asthma, diabetes, sinusitis, bronchitis, having migraines in the last 3 months, and being a smoker.
Table 2.
Logit Model of Access and Utilization Measures by Race on %MHMO in MSA, Race × MHMO Interactions with SES, Demographic, and Health Status Variables Used as Independent Controls
| Doctor Visit in Last Year | Usual Source of Care | ER Use in Last Year | ||||
|---|---|---|---|---|---|---|
| Coefficient | Standard Error | Coefficient | Standard Error | Coefficient | Standard Error | |
| Race | ||||||
| Black | −0.60* | 0.25 | −0.04 | 0.30 | 0.07 | 0.12 |
| Hispanic | −0.82* | 0.27 | 0.05 | 0.28 | −0.12 | 0.16 |
| %Medicaid HMO | ||||||
| MHMO | 0.42 | 0.67 | 0.43 | 0.85 | 0.43 | 0.41 |
| MHMO × black | 1.25* | 0.59 | 0.31 | 0.80 | 0.19 | 0.50 |
| MHMO × Hispanic | 0.70 | 0.77 | −0.26 | 0.85 | 0.76 | 0.45 |
| Poverty status | ||||||
| <50% FPL | 0.07 | 0.15 | −0.30 | 0.16 | 0.002 | 0.10 |
| <50% FPL × black | −0.29 | 0.42 | 0.18 | 0.41 | −0.27 | 0.27 |
| <50% FPL × Hispanic | −0.47 | 0.39 | 0.06 | 0.47 | −0.50* | 0.22 |
| <50% FPL × MHMO | −1.10* | 0.55 | −0.12 | 0.73 | 0.30 | 0.38 |
| Gender | ||||||
| Female | 1.13* | 0.19 | 1.23* | 0.23 | 0.15 | 0.10 |
| Female × black | −1.12* | 0.37 | −0.15 | 0.45 | −0.46* | 0.24 |
| Female × Hispanic | −0.58 | 0.37 | 0.26 | 0.35 | −0.41 | 0.26 |
| Female × MHMO | 0.38 | 0.75 | −0.76 | 0.95 | −0.47 | 0.57 |
| Nativity | ||||||
| Foreign-born | 0.19 | 0.23 | −0.38* | 0.18 | −0.60* | 0.12 |
| Foreign × black | −0.37 | 0.58 | −0.93 | 0.68 | 0.02 | 0.34 |
| Foreign × Hispanic | −0.62 | 0.67 | −0.84 | 0.65 | 0.51 | 0.33 |
| Foreign × MHMO | 0.63 | 0.95 | −0.64 | 0.81 | −1.46* | 0.41 |
| Education | ||||||
| High school graduate | 0.38* | 0.19 | 0.02 | 0.19 | −0.10 | 0.13 |
| High school graduate × black | −0.28 | 0.54 | −0.73 | 0.42 | 0.15 | 0.37 |
| High school graduate × Hispanic | −0.37 | 0.49 | −0.75 | 0.65 | −0.25 | 0.31 |
| High school graduate × MHMO | −0.88 | 0.92 | −0.43 | 0.59 | −0.07 | 0.54 |
| Some college | 0.51* | 0.19 | 0.03 | 0.15 | 0.24 | 0.14 |
| Some college × black | −0.50 | 0.61 | −0.81 | 0.57 | 0.34 | 0.30 |
| Some college × Hispanic | −0.67 | 0.47 | −0.37 | 0.45 | −0.06 | 0.37 |
| Some college × MHMO | 0.81 | 0.75 | 0.22 | 0.65 | −0.02 | 0.60 |
| Age (referent 35–44) | ||||||
| 18–24 | 0.48* | 0.17 | −0.43 | 0.25 | 0.37* | 0.17 |
| 25–34 | 0.14 | 0.15 | 0.15 | 0.21 | 0.19 | 0.11 |
| 45–54 | 0.07 | 0.22 | −0.24 | 0.25 | −0.09 | 0.19 |
| 55–64 | −0.02 | 0.29 | 0.37 | 0.71 | −0.37* | 0.17 |
| Marital status | ||||||
| Married | 0.15 | 0.16 | −0.14 | 0.16 | 0.13 | 0.16 |
| MSA level variables | ||||||
| Income ×$10,000 | −0.27* | 0.11 | 0.09 | 0.17 | 0.13 | 0.08 |
| HMO penetration | −0.46 | 1.03 | 0.69 | 1.33 | −0.58 | 0.75 |
| HMO competition | −0.12 | 1.17 | 1.66 | 1.16 | 0.13 | 0.59 |
| Health status | ||||||
| Health status≥fair | −0.16 | 0.23 | −0.40 | 0.25 | −0.46* | 0.13 |
| Limitation of activity | 0.65* | 0.17 | −0.02 | 0.29 | 0.18 | 0.14 |
| Health conditions | ||||||
| Hypertension | 0.58* | 0.20 | 0.12 | 0.20 | 0.23* | 0.11 |
| Congenital heart disease | 0.46 | 0.40 | 1.38 | 1.14 | 0.25 | 0.36 |
| Heart attack | −0.04 | 0.51 | 0.64 | 0.68 | 0.69* | 0.33 |
| Stroke | 0.69 | 0.82 | 0.04 | 0.72 | −0.06 | 0.42 |
| Asthma | 0.30 | 0.40 | 1.03* | 0.52 | 0.52* | 0.21 |
| Ulcer | 0.48 | 0.33 | 0.49 | 0.39 | 0.00 | 0.17 |
| Diabetes | 1.27* | 0.47 | 0.68 | 0.42 | 0.41* | 0.21 |
| Sinusitis | 0.58* | 0.26 | 0.38 | 0.39 | 0.45* | 0.14 |
| Bronchitis | 0.61 | 0.47 | 0.11 | 0.40 | 0.38* | 0.17 |
| Pregnant | 0.34 | 0.36 | 0.25 | 0.36 | 0.30 | 0.20 |
| Back pain in last 3 months | 0.30 | 0.17 | −0.16 | 0.19 | 0.24 | 0.14 |
| Migraine in last 3 months | 0.38* | 0.16 | 0.22 | 0.20 | 0.42* | 0.10 |
| Health behaviors | ||||||
| Smoker | −0.02 | 0.18 | −0.24 | 0.20 | 0.36* | 0.12 |
| Exercise | 0.13 | 0.15 | 0.21 | 0.19 | −0.08 | 0.10 |
| Drink greater than five drinks | 0.15 | 0.21 | 0.10 | 0.21 | 0.19 | 0.14 |
| Overweight | 0.11 | 0.10 | 0.08 | 0.14 | −0.03 | 0.12 |
Logit coefficients and standard errors take into account sampling weights and stratification used to make NHIS sample representative of U.S. population.
Race, gender, and age coefficients are centered on the means so that regression coefficients on a given characteristic and their significance can be directly interpreted as the difference by race from the overall mean of the characteristic.
Managed care variable used is the percentage of Medicaid beneficiaries (23 state and 4-year dummy indicators were in model but are not shown).
FPL, federal poverty level; MHMO, Medicaid Health Maintenance Organization; HMO, health maintenance organization; SES, socioeconomic status; NHIS, National Health Interview Survey.
p <.05.
MMC and Disparities
The top panel of Table 3 presents disparity calculations among enrollees in each type of Medicaid plan (a first difference calculation), and difference-in-disparity calculations. These results show that MMC enrollment was associated with a significant reduction in the black–white disparity in having any doctor visit, but was not associated with change in the Hispanic–white disparity. MMC enrollment was associated with an elimination of the disparity in having a usual source of care for both blacks and Hispanics. MMC enrollment was also associated with an exacerbation of the black–white disparity in ER use. Hispanic Medicaid FFS enrollees actually had lower rates than white FFS enrollees, and this “reverse disparity” persisted among Medicaid MMC enrollees.
The lower panel of Table 3 shows that increased MHMO market share significantly lowered the black–white and Hispanic–white disparity in having a doctor visit in the last year by 5.4 and 5.8 percent, respectively. Higher MHMO market share had no significant impact on disparities in having a usual source of care for either blacks or Hispanics. First difference results for having any ER use in the last year show that black–white disparities in ER use were marginally significant in MSAs with high rates of MHMO market share (p<.058), but there was no significant exacerbation of disparity when shifting from low MHMO market share to high HMO market share areas.
CONCLUSIONS
State health agencies adopted managed care in their Medicaid program in an attempt to curb escalating costs and to increase access to health care, but without knowing the effects of increased managed care market share on racial disparities in access and utilization. This study found that MMC has contributed to a reduction of disparities in seeing a doctor and having a usual source of care. The finding of a significant black–white ER use disparity among MMC enrollees and in high MHMO areas merits further research.
Increased MHMO market share within an MSA reduced disparities in having a doctor visit in the last year among black and Hispanic Medicaid enrollees. MHMO market share did not have the negative impact on doctor visits among black adult Medicaid enrollees that Currie and Fahr (2002) found for black MMC enrolled children and infants with chronic conditions. The finding also differed from research by Tai-Seale, Freund, and LoSasso (2001) that found the black–white disparity in physician care was significantly increased by mandated MMC enrollment in a single Midwestern state in the early 1990s. The benefits of MMC for access to care among minorities were also apparent when analyzing differences in having a usual source of care. MMC enrollment was associated with significantly reduced disparities in having a usual source of care among blacks and Hispanics. These effects disappeared when controlling for selection using the MSA-level MHMO market share variable although black rates of having a usual source of care increase in high MHMO market share areas. Taken together, these differences, while significant, were not large enough to suggest that Medicaid directors should invest heavily in managed care or increasing Medicaid HMO market share to reduce racial disparities, but using managed care to cut costs appears not to have unintended negative consequences for racial disparities in access and utilization.
A black–white disparity in having any ER use in the last year exists in MMC situations. It is unclear whether this black–white disparity in ER use represents a negative indicator of health care access because of poorer access to care for blacks, or is an appropriate use of resources. Studies in the early 1990s showed that the majority of ER use was for nonemergent care and could be treated more efficiently in primary care settings (Grumbach, Keane, and Bindman 1993, NCHS 1994). Blacks could be using primary care providers less often when enrolled in a MMC plan, and postpone care until their advanced illness forces them to the ER for more emergent care, or they could simply prefer the ER over MMC primary care providers for nonemergent care. However, given the positive results for doctor visits and usual source of care in MMC, it seems more likely that the black–white disparity in ER use reflects MMC plans using the ER as a triage site for low-cost primary care health clinics, or as a source of primary care on the weekends and after working hours, times during which blacks may be more likely to utilize health care services. Unadjusted analysis of the 1997–2001 NHIS data shows that MMC enrollees working longer hours were more likely to use the ER: 37 percent of MMC enrollees working >30 h/week, compared with 31 percent of Medicaid FFS enrollees working >30 h/week, a difference that is significantly larger than the difference between MMC and Medicaid FFS enrollees working 1–29 hours. Identifying the effect of different managed care plans' staffing models and after hours triage protocols on ER use, and investigating different patterns of employment hours by racial/ethnic subgroup, may lead to a better understanding of the mechanism underlying black–white disparities in ER use among MMC enrollees and in high MMC market share areas.
A lack of longitudinal panel data of Medicaid enrollees, and the ability of individual Medicaid enrollees to voluntarily select into or out of managed care plans complicates the measurement of the impact of MMC. Measuring the difference in difference by type of plan and race uses two sources of variation to address selection bias. Using the variable %MHMO market share in an MSA further mitigates the selection problem by reducing the endogeneity of the predictor variable of interest. Differencing using the MSA-level variable assesses the impact of increased MHMO market share on different races, but assumes that individuals in different racial/ethnic subgroups exhibit identical selection behaviors in response to MHMO market share. Using the difference-in-difference method with the market share variable therefore resembles an intent-to-treat analysis, conceding that selection patterns varying by race/ethnicity are outside of the scope of the intervention. Other methods to estimate the nationwide average impact of MMC include adjusting for regional HMO competition and market share characteristics, and controlling for state and year fixed effects.
The inclusion of state by year interaction effects was not possible given the sample size. Therefore, changes in disparities that I attribute to MMC market share may be affected by fluctuating case mix caused by eligibility level changes within states between the years of 1997 and 2001. However, this is unlikely to affect assessment of the impact of the MMC on racial disparities given small eligibility level variation within states over this time period, and the rich variation across states that is used in the analyses. Another limitation related to the data source is that the self-reported MMC enrollment measure constructed from the NHIS might be less accurate than Medicaid claims data. However, this measure's readily accessible links to NHIS and MSA-level variables provide a distinct advantage over the use of claims data.
Determining causal inference of MSA-level MHMO market share requires that this variable not be correlated with other predictors of racial disparities in access and utilization. State decisions to increase MHMO market share were driven in large part by a desire to reduce the level and growth rate of Medicaid expenditures (Duggan 2002). This suggests that the decision to increase MHMO market share may have been correlated with increasing utilization of services or deteriorating health of the Medicaid enrollee population within a state. However, it is unlikely that these decisions were driven by increasing racial disparities in utilization or health status. Increases in MHMO market share may also be correlated with budget cuts in other state social services that may have an impact on health services access and utilization, but these budget cuts would not be expected to have a differential impact on health services access and utilization for minorities compared with whites.
This study applies the IOM definition of racial disparities to an evaluation of Medicaid program changes by equalizing health status values between races, while allowing important SES characteristics to continue to mediate the race–access relationship. This method does not “penalize” the MMC program for health status factors that are outside of the program's control. On the other hand, neither does it ignore the influence of the program on the effects of SES factors that are correlated with race/ethnicity. The transformation of the black and Hispanic distributions of health status to mimic the white distribution of health status is a straightforward method of implementing the IOM definition of disparity that can be used in future evaluations of programs' effects on racial disparities. In order to accurately assess disparities, fully informed patient preferences that take into account different levels of knowledge and experience with the health care system, should be considered as part of the disparity measurement (IOM 2002). Unfortunately, measures that accurately capture fully informed preferences were unavailable in the datasets used in this study.
Reduced disparities in having a doctor visit in the last year for black and Hispanic enrollees living in high MHMO market share areas, and an association of MMC enrollment and the reduction of blacks and Hispanic disparities in having a usual source of care, suggest that managed care improved access to care for minorities. However, significant increases in ER use for black MMCO enrollees raise questions about the adequacy of this care.
Acknowledgments
This research was supported by grants P01 MH59876 from the National Institutes of Mental Health and MD 0300 from the National Center for minority Health and Disparities, and the Alfred P. Sloan Foundation Fellowship in Managed Care. For helpful comments, I thank Tom McGuire, Alan Zaslavsky, Ellen Meara, participants of the Harvard University Health Policy Research Seminar, and two anonymous referees.
Disclosures: No conflicts of interest to report.
Disclaimers: The views and opinions expressed in this article are those of the author and should not be construed to represent the views of any of the sponsoring organizations, agencies, or the United States government.
NOTES
Numerous studies have shown that individuals incorrectly report enrollment in a managed care plan and misunderstand managed care definitions and practices (Hibbard et al. 1998; Miller and Horowitz 2000; Flores et al. 2004). This proxy of managed care coverage has been previously used (McGuire et al. 2006) and in the absence of administrative data is a more accurate way of identifying managed care enrollment than directly asking individuals.
The accuracy of comparisons over time using InterStudy MSA-level data may be compromised by missing HMO data in some years. To detect inconsistencies in the data, I identified any MSA that had a nonmonotonic change over 3 years of data that was greater than 50 percent (e.g., the reported % Medicaid Health Maintenance Organization [MHMO] within the Providence, RI MSA was 24, 0.1, and 50 percent for the years 1997, 1998, and 1999, respectively), and replaced that cell with the average of the surrounding years (e.g., the Providence, RI MSA %MHMO value was recoded to equal 37 percent for 1998). In total, four such cells were found and replaced. This recoding of the data had negligible effects on the usual source of care and ER use estimates, and a small qualitative effect on the doctor visits estimate for which the change increased the precision of the %MHMO regression estimates. (Estimates of the analysis using the uncorrected InterStudy data are available upon request.)
Variation because of the random nature of this type of minority health status adjustment is minimal and does not substantially change the difference-in-difference comparisons.
References
- Balsa A, Cao Z, McGuire T. Does Managed Health Care Reduce Unfair Differences in Health Care Use between Minorities and Whites? Journal of Health Economics. 2006 doi: 10.1016/j.jhealeco.2006.06.001. forthcoming. [DOI] [PubMed] [Google Scholar]
- Balsa A, McGuire T. Prejudice, Clinical Uncertainty and Stereotyping as Sources of Health Disparities. Journal of Health Economics. 2003;22(1):89–116. doi: 10.1016/s0167-6296(02)00098-x. [DOI] [PubMed] [Google Scholar]
- Basu J, Friedman B, Burstin H. Managed Care and Preventable Hospitalization among Medicaid Adults. Health Services Research. 2004;39(3):489–509. doi: 10.1111/j.1475-6773.2004.00241.x. [DOI] [PMC free article] [PubMed] [Google Scholar]
- Centers for Medicare & Medicaid Services (CMS) 2001 Medicaid Managed Care Enrollment Reports. [March 20 2006];2002 Available at http://www.cms.hhs.gov/MedicaidDataSourcesGenInfo/Downloads/mmcer01.pdf.
- Chandra A, Skinner J. Geography and Racial Health Disparities. 2003. NBER Working Paper No. 9513.
- Collins KS, Hall A, Neuhaus C. U.S. Minority Health: A Chartbook. New York: The Commonwealth Fund; 1999. [Google Scholar]
- Currie J, Fahr J. Cambridge, MA: National Bureau of Economic Research; 2002. Medicaid Managed Care: Effects on Children's Medicaid Coverage and Utilization. Working Paper No. 8812. [Google Scholar]
- Duggan M. Cambridge, MA: National Bureau of Economic Research; 2002. Does Contracting Out Increase the Efficiency of Government Programs? Evidence from Medicaid HMOs. Working Paper No. 9091. [Google Scholar]
- Efron B. Bootstrap Methods: Another Look at the Jackknife. Annals of Statistics. 1979;7:1–26. [Google Scholar]
- Fiscella K, Franks P, Doescher MP, Saver BG. Disparities in Health Care by Race, Ethnicity, and Language among the Insured: Findings from a National Sample. Medical Care. 2002;40(1):52–9. doi: 10.1097/00005650-200201000-00007. [DOI] [PubMed] [Google Scholar]
- Flores G, Abreu M, Sun D, Tomany S. Urban Parents' Knowledge and Practices Regarding Managed Care. Medical Care. 2004;42(4):336–45. doi: 10.1097/01.mlr.0000118708.21532.de. [DOI] [PubMed] [Google Scholar]
- Garrett B, Davidoff A, Yemane A. Effects of Medicaid Managed Care Programs on Health Services Access and Use. Health Services Research. 2003;38(2):575–94. doi: 10.1111/1475-6773.00134. [DOI] [PMC free article] [PubMed] [Google Scholar]
- Gavin NI, Farrelly MC, Simpson JB. Children's Use of Primary and Preventive Care under Medicaid Managed Care. Health Care Financing Review. 1998;19(4):45–68. [PMC free article] [PubMed] [Google Scholar]
- Grumbach K, Keane D, Bindman A. Primary Care and Public Emergency Department Overcrowding. American Journal of Public Health. 1993;83(3):372–78. doi: 10.2105/ajph.83.3.372. [DOI] [PMC free article] [PubMed] [Google Scholar]
- Haas J, Phillips KA, Sonneborn D, McCulloch CE, Liang SY. Effect of Managed Care Insurance on the Use of Preventive Care for Specific Ethnic Groups in the United States. Medical Care. 2002;40:743–51. doi: 10.1097/00005650-200209000-00004. [DOI] [PubMed] [Google Scholar]
- Hibbard JH, Jewett JJ, Engelmann S, Tusler M. Can Medicare Beneficiaries Make Informed Choices? Health Affairs. 1998;17(6):181–93. doi: 10.1377/hlthaff.17.6.181. [DOI] [PubMed] [Google Scholar]
- Hurley R, Freund D, Gage B. Gatekeeper Effects on Patterns of Physician Use. Journal of Family Practice. 1991;32(2):167–74. [PubMed] [Google Scholar]
- Institute of Medicine (IOM) Unequal Treatment. Washington, DC: National Academies Press; 2002. [Google Scholar]
- Kaestner R, Dubay L, Kenney G. Cambridge, MA: National Bureau of Economic Research; 2002. Medicaid Managed Care and Infant Health: A National Evaluation. Working Paper No. 8936. [Google Scholar]
- Kaiser Family Foundation. Key Facts Race, Ethnicity and Medical Care, Prepared by Marsha Lillie-Blanton, Osula Evadne Rushing and Sonia Ruiz, June 2003. [March 20];2003 Available at http://www.kff.org/minorityhealth/6069-index.cfm.
- Kraemer HC, Blasey CM. Centering in Regression Analyses: A Strategy to Prevent Errors in Statistical Inference. International Journal of Methods in Psychiatric Research. 2002;13(3):141–51. doi: 10.1002/mpr.170. [DOI] [PMC free article] [PubMed] [Google Scholar]
- Levit J, Cowan C, Lazenby H, Sensenig A, McDonnell P, Stiller J, Martin A. Health Spending in 1998: Signals of Change. Health Affairs. 2000;19(1):124–32. doi: 10.1377/hlthaff.19.1.124. [DOI] [PubMed] [Google Scholar]
- Lillie-Blanton M, Lyons B. Managed Care and Low-Income Populations: Recent State Experiences. Health Affairs. 1998;17(3):238–47. doi: 10.1377/hlthaff.17.3.238. [DOI] [PubMed] [Google Scholar]
- McDonough JE, Gibbs BK, Scott-Harris JL, Kronebusch K, Navarro AM, Taylor K. A State Policy Agenda to Eliminate Racial and Ethnic Health Disparities. New York: The Commonwealth Fund; 2004. [Google Scholar]
- McGuire TG, Alegría M, Cook BL, Wells K, Zaslavsky A. Implementing the IOM Definition of Disparities in Health Care: An Application to Mental Health Care. Health Services Research. 2006 doi: 10.1111/j.1475-6773.2006.00583.x. forthcoming. [DOI] [PMC free article] [PubMed] [Google Scholar]
- Miller TE, Horowitz CR. Disclosing Doctors' Incentives: Will Consumers Understand and Value Information? Health Affairs. 2000;19(4):149–55. doi: 10.1377/hlthaff.19.4.149. [DOI] [PubMed] [Google Scholar]
- National Center for Health Statistics (NCHS) National Hospital Ambulatory Medical Care Survey: 1992 Emergency Data Summary. Advance Data from Vital and Health Statistics of the National Center for Health Statistics. DHHS Publication No. 94–1250. Rockville, MD: U.S. Dept of Health, Education, and Welfare, Public Health Service, Health Resources Administration; 1994. [Google Scholar]
- Robinson JC, Shortell SC, Li R, Casalino LP, Rundall T. The Alignment and Blending of Payment Incentives within Physician Organizations. Health Services Research. 2004;39(5):1589–606. doi: 10.1111/j.1475-6773.2004.00305.x. [DOI] [PMC free article] [PubMed] [Google Scholar]
- Rogers WH. Regression Standard Errors in Clustered Samples. Stata Technical Bulletin. 1993;13:19–23. [Google Scholar]
- Szylagyi PG. Managed Care for Children: Effect on Access to Care and Utilization of Health Service. The Future of Children. 1998;8(2):39–59. [PubMed] [Google Scholar]
- Tai-Seale M, Freund D, LoSasso A. Racial Disparities in Service Use among Medicaid Beneficiaries after Mandatory Enrollment in Managed Care: A Difference-in-Differences Approach. Inquiry. 2001;38(1):49–59. doi: 10.5034/inquiryjrnl_38.1.49. [DOI] [PubMed] [Google Scholar]
- Zuckerman S, Brennan N, Yemane A. Medicaid Managed Care and Beneficiary Access and Use. Inquiry. 2002;39(3):221–42. doi: 10.5034/inquiryjrnl_39.3.221. [DOI] [PubMed] [Google Scholar]