

Abstract
Objective
This study investigates geographic variation in chemotherapy utilization for ovarian cancer in both absolute and relative terms and examines area characteristics associated with this variation.
Data Sources
Surveillance, Epidemiology, and End Results (SEER) Medicare data from 1990 to 2001 for Medicare patients over 65 with a diagnosis of ovarian cancer between 1990 and 1999. Chemotherapy within a year of diagnosis was identified by Medicare billing codes. The hospital referral region (HRR) represents the geographic unit of analysis.
Study Design
A logit model predicting the probability of receiving chemotherapy by each of the 39 HRRs. Control variables included medical characteristics (patient age, stage, year of diagnosis, and comorbidities) and socioeconomic characteristics (race, income, and education). The variation among HRRs was tested by the χ2 statistic, and the relative contribution was measured by the ω statistic. HHR market characteristic are then used to explain HRR-level variation.
Principal Findings
The average chemotherapy rate was 56.6 percent, with a range by HRR from 33 percent to 67 percent. There were large and significant differences in chemotherapy use between HRRs, reflected by a χ2 for HRR of 146 (df=38, p<.001). HRR-level variation in chemotherapy use can be partially explained by higher chemotherapy rates in HRRs with a higher percentage of hospitals with oncology services. However, an ω analysis indicates that, by about 15 to one, the variation between patients in use of chemotherapy reflects variations in patient characteristics rather than unexplained variation among HRRs.
Conclusions
While absolute levels of chemotherapy variation between geographic areas are large and statistically significant, this analysis suggests that the role of geography in determining who gets chemotherapy is small relative to individual medical characteristics. Nevertheless, while variation by medical characteristics can be medically justified, the same cannot be said for geographic variation. Our finding that density of oncology hospitals predicts chemotherapy use suggests that provider supply is positively correlated with geographic variation.
Keywords: Geographic variations, chemotherapy treatment, ovarian cancer
Each year in the United States, 24,000 women are newly diagnosed with ovarian cancer and over 14,000 die of the disease (American Cancer Society 2004). Ovarian cancer is the fifth most common and fourth most deadly malignancy in U.S. women. While overall 1-year survival of patients with newly diagnosed ovarian cancer is 80 percent, survival varies greatly by age and cancer stage (SEER 2000). Nearly 50 percent of diagnosed cases occur in women over age 65 (Yancik et al. 1986). Chemotherapy is recommended for all women with ovarian cancer except those with ovary-limited disease that is well or moderately histologically differentiated (McGuire et al. 1996; McGuire and Ozols 1998).
Ovarian cancer treatment has changed greatly in the past decade. Survival has improved with the introduction of platinum agents and the use of platinum/paclitaxel regimens (Neijt 1996). However, chemotherapy use still varies significantly (Ries 1993; Devesa, Grauman, and Blot 1994; Hightower et al. 1994; Sundararajan et al. 2002). Little is known about which nonclinical factors determine these treatment variations. One study found a lower rate of chemotherapy for ovarian cancer among black patients (Sundararajan et al. 2002) which suggests that nonmedical factors, including sociodemographic characteristics and geography, may play a role. The absolute and relative contribution of these factors is unknown.
While geographic variation in chemotherapy has received minimal attention (Earle, Venditti, and Neumann 2000), many have identified geographic differences in cancer treatment (Farrow, Hunt, and Samet 1992; Lu-Yao and Greenberg 1994; Lai et al. 2001; Baxter et al. 2004). No studies have assessed the relative importance of geography as a driver of treatment decisions compared with individual medical factors. Further, the factors responsible for the geographic variation are still uncertain.
We sought to evaluate chemotherapy use among elderly patients with ovarian cancer to parse out the relative and absolute contribution of geography as a determinant of chemotherapy. Using Surveillance, Epidemiology, and End Results (SEER) Medicare data and hospital referral regions (HRRs) as the geographic unit, we explored the role of geography relative to the medical factors of stage and age, and the non-medical factors of race, education, and income. We also explored the role of market characteristics of a geographic area as a predictor of area variation.
METHODS
Data
We studied patients from the 11 tumor registries that participated in the SEER program of the National Cancer Institute between 1990 and 1999. About 97 percent of the incident cases of cancer diagnosed in the registry regions were captured (Zippin, Lum, and Hankey 1995). The SEER sites, covering 14 percent of the U.S. population (Ries et al. 1997), are representative of the U.S. population (Nattinger, McAuliffe, and Schapira 1997). The SEER records include stage, histology, date of diagnosis and death, and patient sociodemographic characteristics. Medicare claims through 2001 were linked to SEER cases with a 94 percent match rate (Potosky et al. 1993).
We studied Medicare patients who were older than 65 and had an ovarian cancer diagnosis between 1990 and 1999 in the SEER registries (N =10,986). We excluded the following: women enrolled in a Medicare health maintenance organization (HMO) at baseline (n =1,778) (because complete treatment information is unavailable); women who died in the first 30 days (n =811) (because they had insufficient opportunity to receive chemotherapy); patients in HRRs with fewer than 20 patients (n =404) (to remove those referred to SEER sites from outside the defined region); and patients missing key descriptive data (n =15). The final sample size was 7,978.
We used Medicare billing codes from Medicare claims to identify chemotherapy within a year of diagnosis. Postsurgery chemotherapy was identified by service codes in inpatient, outpatient, and physician part B files: International Classification of Diseases, 9th revision (ICD-9), procedure codes for therapy (99.25); Healthcare Common Procedure Coding System (HCPCS) codes 964xx, 965xx and Common Procedural Terminology (CPT) codes 36640 and 36260 for chemotherapy administration; and HCPCS codes for ovarian cancer-specific chemotherapy drugs (J8999–J9999 and Q0163–Q0185).
We modeled comorbidity severity using a pool of potential variables (Elixhauser et al. 1998; Silber et al. 2001). We coded 47 comorbidities using ICD-9 diagnostic codes recorded 90 days before each patient's ovarian cancer diagnosis on the Medicare portion of the SEER/Medicare file. We used SEER to obtain other disease characteristics (e.g., stage, age, and date of diagnosis) and race/ethnicity. Other socioeconomic characteristics (median per capita income and education attainment) were based on links between patients' census tracts and the 1990 Census (Krieger 1992).
The geographic unit of this analysis was the patient's HRR, a geographic area defined by The Dartmouth Atlas of Health Care (Wennberg et al. 1998). It represents a regional health care market for tertiary medical care. The SEER site comprises both metropolitan regions (San Francisco/Oakland, Detroit, Seattle/Puget Sound, Atlanta, San Jose/Monterey, and Los Angeles) and entire states (Connecticut, Hawaii, Iowa, New Mexico, and Utah). The use of HRRs allowed for comparably scaled geographies and alignment of residence with the likely area of receipt of health care services. There are 306 hospital referral regions in the United States and 39 HRRs in SEER.
We also linked health system characteristics of the HRR, such as HMO penetration, density, oncologists per MD, percentage of hospitals with an oncology facility, percentage of teaching hospitals used by SEER patients, MDs, and hospitals from the Area Resource File of the Federal Bureau of Health Professions. We chose these HRR characteristics on the basis of literature about the determinants of health care supply and demand in a health care market. We used the HRR density characteristic because demand is typically higher when travel distances are shorter (Goodman et al. 1997). We used the number of hospitals, MDs, oncologists per MD, and percentage of hospitals with oncology facilities because demand increases when more facilities are available (Ginsburg and Koretz 1983; Rohrer 1990; Roemer 1991; Brown and Barnett 1992). We used both the number of hospitals and MDs and the more chemotherapy-relevant measure of percentage of hospitals with oncology facilities and percentage of oncologists. We also included HMO penetration because although these are Medicare fee-for-service patients, some reports support spillovers to non-HMO patients in areas with higher HMO penetration (Baker 1997).
Statistical Methods
The first analysis assessed determinants of chemotherapy variation and established whether geography is a significant determinant. The second analysis identified area characteristics associated with geographic variation in chemotherapy use. Both analyses assessed the relative contribution of various factors to variation in chemotherapy use via the omega (ω) statistic (Silber, Rosenbaum, and Ross 1995).
The first analysis evaluated variation in chemotherapy rates by HRR using logistic regression with HRR fixed effects. We performed four regressions. The first contained only the fixed effects so that the raw variation between HRRs could be measured. The second added disease-specific characteristics (stage, age, comorbidities, and time) to assess the contribution of these characteristics to chemotherapy use and to assess their contribution relative to geographic area. The third added sociodemographic characteristics (race, education, and income). The fourth removed income and education to parse out the relationship between race and socioeconomic status (SES) as a determinant of chemotherapy use. In the second analysis we replaced the HRR indicator variables with HRR characteristics (HMO penetration, density, oncologists per MD, percentage of hospitals with an oncology facility, and population). We used the robust estimator of variance assuming correlation among observations within HRRs but independence between them (White 1980).
We then repeated the first analysis separately for patients diagnosed between 1990 and 1995 and those diagnosed between 1996 and 1999. The stratified analysis permits investigation of how HRR variation changed from the “pre” time period (1990–1995), when knowledge of effective chemotherapy for ovarian cancer was sparse, to the “post” time period (1996–1999), when effective treatment became widely adopted following the January 1996 report of McGuire et al. demonstrating improved outcomes after paclitaxel chemotherapy for advanced ovarian cancer. We hypothesized that HRR variation would be greater before the demonstration of effective treatment.
The extent to which the set of HRRs or HRR characteristics contribute to chemotherapy variation was tested by the likelihood ratio χ2 test for the set of variables. The contribution of individual medical, socioeconomic, or HRR characteristics was measured by their odds ratio (OR). These effects were identified as statistically significant at a two-sided p-value of .05.
An ω analysis (Silber, Rosenbaum, and Ross 1995) can be used to measure the relative contribution toward the explanation of variation among different sets of variables. Here we used ω to measure the relative contribution of the set of HRRs (or HRR characteristics) compared with the set of disease and sociodemographic characteristics in explaining variation in chemotherapy use.
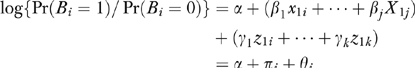
More formally, ω measures the relative contribution of the x's and the z's to predicting B where, for example, x1, …, xj describe patient characteristics; z1, …, zk describe HRR characteristics; and B is the binary outcome of chemotherapy use for patient i. (For notational convenience, x1, …, xj and z1, …, zk were centered by subtracting their means.) If
 |
where 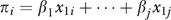 and
and  then
then 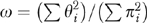
Each patient i has a πi and a Θ and fitting the logit model yields estimates of these quantities. The distribution of π and Θ is displayed in the left panel of Figure 1 on a log scale to the base of 2. If ω =0, all the variation between HRRs in chemotherapy use is predicted by characteristics of patients in the HRRs. If ω =1, the HRR characteristics predict as much variation in chemotherapy use as do patient characteristics.
Figure 1.
The Degree to Which Characteristics Explain Chemotherapy Use
Parallel Boxplots of the Θi is and πi's. The ratio of ΣΘ2 and Σπ2 forms ω and  for the patient- and hospital referral region [HRR]-based analyses, respectively. The boxplots are of the 25th and 75th percentile, with the whiskers at 5 percent and 95 percent. The first three boxplots come from Model [3], and the HRR characteristics (HRR Chars.) boxplot comes from Model [4]. SES, socioeconomic status.

Although ω describes variation among patients, it is often of interest to describe the variation among groups of patients, for example the variation among HRRs. For this analysis, one examines the average πi in an HRR and the average Θi in an HRR.  , the HRR-level ω (Silber, Rosenbaum, and Ross 1995), is computed from these averages. Each HRR j has
  and
and  . Fitting the logit model yields estimates of these quantities (Figure 1 shows the distribution of
  and
and  ).
).
RESULTS
Table 1 shows the patient characteristics. Most patients had stage 3 or 4 ovarian cancer. Most (49 percent) were in their 70s, 27 percent were 80 or older; and 24 percent were 65–69. Patients were fairly evenly distributed across SEER sites. The chemotherapy rates by HRR ranged from 33 percent in Des Moines, Iowa, to 63–67 percent in the HRRs representing the cities of Everett, Seattle, and Olympia in Washington. The average rate of chemotherapy use was 56.6 percent. This is lower than other published rates for this population (Sundararajan et al. 2002) because we excluded patients who died within 30 days rather than 120 days.
Table 1.
Patient Characteristics
| N =7,978 | ||
|---|---|---|
| Chemotherapy rate | 56.6% | |
| Stages | ||
| 1 | 19.2% | |
| 2 | 7.3% | |
| 3 | 33.8% | |
| 4 | 30.4% | |
| Unknown | 9.3% | |
| Age (years) | ||
| 65–69 | 23.7% | |
| 70–74 | 26.3% | |
| 75–79 | 22.8% | |
| 80–84 | 15.1% | |
| 85+ | 12.2% | |
| Race | ||
| White | 90.4% | |
| Black | 6.2% | |
| Other | 3.5% | |
| Education | ||
| Less than high school degree | 18.5% | |
| High school degree | 26.6% | |
| Some college | 28.1% | |
| College | 26.7% | |
| Household income | $ 43,451 | |
| SEER site | ||
| San Francisco | 9.7% | |
| Connecticut | 12.5% | |
| Detroit | 15.9% | |
| Hawaii | 1.8% | |
| Iowa | 14.2% | |
| New Mexico | 3.6% | |
| Seatle | 11.5% | |
| Utah | 5.2% | |
| Atlanta | 5.7% | |
| San Jose | 4.7% | |
| Los Angeles | 15.3% | |
| HRR characteristics | Mean | Standard deviation |
| Population density (square miles per pop) | 0.84 | 0.71 |
| Population (millions) | 3.20 | 3.19 |
| Hospitals (n) | 37.57 | 23.68 |
| Physicians (per 1,000 population) | 2.28 | 0.67 |
| Oncologists (per 1,000 physician) | 6.15 | 1.41 |
| Oncology facilities (per hospital) | 0.56 | 0.20 |
| HMO penetration (%) | 31.6 | 14.0 |
| Teaching hospitals (per SEER hospital) | 0.41 | 0.15 |
HMO, health maintenance organization; HRR, health referral region; SEER, Surveillance, Epidemiology, and End Results.
Table 2 displays results of the four logistic regression models. In Model [1], with HRR indicators only, geographic variation was a highly significant predictor of chemotherapy variation (χ2=146; df=38; p-value<.0001). In Model [2], when disease characteristics, risk factors, and time trend are added, geographic variation became a more significant predictor (χ2=168; df=38; p-value<.0001). In Model [3], with the addition of individual socioeconomic characteristics, the significance of geographic variation was slightly reduced (χ2=149; df=38; p-value<.0001).
Table 2.
Adjusted Odds Ratios of Chemotherapy Use
| Models | ||||
|---|---|---|---|---|
| [1] | [2] | [3] | [3b] | |
| Stages | ||||
| 1 | — | 1.00 | 1.00 | 1.00 |
| 2 | — | 6.68*** | 6.87*** | 6.75*** |
| 3 | — | 10.71*** | 10.86*** | 10.83*** |
| 4 | — | 7.08*** | 7.26*** | 7.22*** |
| Unknown | 2.79*** | 2.89*** | 2.87*** | |
| Age (years) | ||||
| 65–69 | — | 1.00 | 1.00 | 1.00 |
| 70–74 | — | 0.86** | 0.85** | 0.85** |
| 75–79 | — | 0.53*** | 0.54*** | 0.53*** |
| 80–84 | — | 0.27*** | 0.27*** | 0.27*** |
| 85+ | — | 0.10*** | 0.10*** | 0.10*** |
| Time trend | — | 1.04*** | 1.02*** | 1.04*** |
| Race | ||||
| White | — | — | 1.00 | 1.00 |
| Black | — | — | 0.66** | 0.48*** |
| Other | — | — | 1.38 | 1.27 |
| Education | ||||
| Less than high school degree | — | — | 1.00 | — |
| High school degree | — | — | 0.44 | — |
| Some college | — | — | 1.00 | — |
| College | — | — | 0.97 | — |
| Household income | — | — | 1.08*** | — |
| χ2 for group of variables | ||||
| Comorbidity controls (df=46) | — | 226*** | 216*** | 220*** |
| HRR controls (df=38) | 146*** | 168*** | 149*** | 160*** |
| Fit of model | ||||
| C-statistic | 0.58 | 0.80 | 0.81 | 0.80 |
.05<p-value<.10
.001<p-value<.05
p-value<.001.
HRR, health referral region.
Disease and risk characteristics were strong predictors of chemotherapy use. Patients with stage 3 disease had the highest odds of chemotherapy use and those with stage 1 disease had the lowest. The odds of receiving chemotherapy declined with age. Comorbidities, as a group, were highly significant determinants of chemotherapy use. A positive time trend was observed between 1990 and 1999 (annual odds, 1.04); chemotherapy use was increasing over this period.
Black patients had lower odds than white patients, and odds increased with income. When income and education were removed from the model (Model [3b]), the OR for black patients dropped to 0.48 from 0.66 and became more strongly significant, suggesting that the lower average income among black patients partially explains lower rates of chemotherapy in this group.
To better explain the factors that contribute to geographic variation, we replaced the 38 HRR indicators with seven HRR characteristics in the logistic regression. Table 3 displays the chemotherapy use ORs for these characteristics. Areas of higher population density tended to have lower chemotherapy rates (OR=0.82; p-value=.111). The number of hospitals was strongly correlated with chemotherapy use (OR=1.00 for a one-hospital change; p-value=.001), as was the percentage of hospitals with oncology facilities (OR=2.49 for a change from 0 percent to 100 percent; p-value<.001). However, the density of teaching hospitals in HRRs and the other selected HRR characteristics were not associated with chemotherapy use.
Table 3.
Adjusted Odds Ratios of Chemotherapy Use For HRR Characteristics (Model [4])
| Odds Ratio | p-Value | |
|---|---|---|
| Population density (population per square) | 0.82 | .111 |
| Hospitals (n) | 1.00 | .001 |
| Physicians (per 1,000 population) | 1.09 | .278 |
| Oncologists (per 1,000 physician) | 0.99 | .729 |
| Oncology facilities (per hospital) | 2.49 | .000 |
| HMO penetration (%) | 0.58 | .275 |
| Teaching hospitals (per SEER hospital) | 0.96 | .920 |
| Control variables added | ||
| Age, stage, comorbidities, time | Yes | |
| Race, education, income | Yes | |
| Fit of model | ||
| C-statistic | 0.80 | |
HMO, health maintenance organization; HRR, health referral region; SEER, Surveillance, Epidemiology, and End Results.
Table 4 summarizes the strongly significant absolute contribution of HRRs toward variation in chemotherapy use and reports on the relative contribution of HRRs via ω (with its 95 percent confidence interval). In comparing one patient with another, most variation in chemotherapy use between patients is predicted by variations in medical characteristics rather than unexplained variations among HRRs; indeed, the estimated ω of 0.066 in Model [3] suggests patient health contributes 15 times (1/0.066) more than variations among HRRs. However, in comparing one HRR with another, this situation is reversed: variations in average patient medical characteristics contribute little to the variation in average chemotherapy use among HRRs; indeed, the estimated  (i.e., ω at the HRR level) of 6.19 in Model [3] says HRR indicators are six times more important than average patient medical characteristics at predicting variation among HRRs. These two very different stories result from the fact that while there are enormous variations from patient's medical characteristics within each HRR, these variations tend to average out for comparisons between HRRs.
Table 4.
Summary of HRR Variation in Chemotherapy Use
| Models | ||||
|---|---|---|---|---|
| [1] | [2] | [3] | [4] | |
| χ2 | ||||
| HRR indicator variables | 146 | 168 | 149 | |
| HRR characteristics | 47 | |||
| p-value | <.001 | <.001 | <.001 | <.001 |
| Control variables added | ||||
| Medical: age, stage, comorbidities, time | No | Yes | Yes | Yes |
| SES: race, education, income | No | No | Yes | Yes |
| ω statistics at the patient level (95% Ci) | ||||
| HRR versus medical* | — | 0.066 | 0.066 | 0.026 |
| (0.0481, 0.091) | (0.046, 0.093) | (0.014, 0.046) | ||
| HRR versus (medical+SES)* | — | — | 0.062 | 0.024 |
| (0.044, 0.087) | (0.014, 0.042) | |||
| HRR versus SES* | — | — | 1.610 | 0.557 |
| (0.092, 2.821) | (0.294, 1.055) | |||
| SES versus medical | — | — | 0.041 | 0.046 |
| (0.024, 0.068) | (0.037, 0.057) | |||
| ω statistics at the HRR level (95% CI) | ||||
| HRR versus medical* | — | 6.164 | 6.186 | 1.776 |
| (3.315, 11.461) | (3.362, 11.381) | (0.963, 3.274) | ||
| HRR versus (medical+SES)* | — | — | 2.972 | 0.819 |
| (1.526, 5.787) | (0.489, 1.370) | |||
| Household income | — | — | 7.026 | 1.799 |
| (2.765, 17.856) | (0.916, 3.529) | |||
| SES versus medical | — | — | 0.880 | 0.987 |
| (0.393, 1.970) | (0.739, 1.319) | |||
HRR refers to HRR characteristics for Models [1]–[3], and HRR characteristics for Model [4].
HRR, health referral region; SES, socioeconomic status.
In Model [3], the ω for SES versus medical (0.041) suggests a minor marginal contribution of SES. However, whether typical chemotherapy rates by HRR can be explained by typical medical risks or by typical SES of the population in that HRR requires an evaluation of  . From this perspective, SES variation is 0.88 times as important as medical variation or 20 times the 0.041 value for ω Thus, while SES plays a relatively minor role in explaining variation in chemotherapy use among individual patients, it does play a relatively large role in explaining variation in chemotherapy use among regions.
Figure 1 summarizes the ω story with boxplots of the Θi's and πi's. The ratio of ΣσΘ2 and Σζπ2 forms ω and  . The left panel describes individual patients and the right, HRRs (i.e., averages over all patients in an HRR). See “Methods” for details. For instance, the boxplots labeled “med” refer to variables that describe patients' medical condition. Although medical variables are important to the treatment of individual patients (the “med” boxplot in the patient-based panel), most of this variation averages out within HRRs; thus, variation in the average health of patients in HRRs contributes little to variations among treatment between HRRs.
Finally, Table 5 summarizes the stratified analysis by diagnosis date. Variation by HRR was reduced in the “post” period with adoption of effective treatments for ovarian cancer, shown by the lower χ2 (127 in the “pre” period and 63 in the “post” period) and by the ω of HRR relative to medical characteristics. The HRR versus medical ω in the “post” period (0.069) was 75 percent of the ω in the “pre” period (0.093).
Table 5.
Summary of HRR Variation in Chemotherapy Use Stratified by Date of Diagnosis
| Model [3] “Pre” Period Diagnosis 1990–1995 (N =4,802) | Model [3] “Post” Period Diagnosis 1996–1999 (N =3,172) | |
|---|---|---|
| χ2: | ||
| of HRR indicator variables | 127 | 63.4 |
| p-value | <.001 | 0.006 |
| Control variables added | ||
| Medical: age, stage, comorbidities, time | Yes | Yes |
| SES: race, education, income | Yes | Yes |
| ω statistics at the patient level (95% Ci) | ||
| HRR versus medical | 0.093 | 0.069 |
| (0.063, 0.135) | (0.041, 0.116) | |
| HRR versus (medical+SES) | 0.089 | 0.063 |
| (0.061, 0.129) | (0.038, 0.106) | |
| HRR versus SES | 2.717 | 1.242 |
| (1.319, 5.596) | (0.574, 2.688) | |
| SES versus medical | 0.034 | 0.056 |
| (0.017, 0.068) | (0.027, 0.114) | |
| ω statistics at the HRR level (95% CI) | ||
| HRR versus medical | 4.367 | 8.888 |
| (2.411, 7.910) | (4.260, 18.544) | |
| HRR versus (medical+SES) | 3.191 | 3.266 |
| Household income | (1.712, 5.948) | (1.437, 7.424) |
| HRR versus SES | 13.148 | 6.264 |
| (3.616, 47.803) | (2.152, 18.236) | |
| SES versus medical | 0.332 | 1.419 |
| (0.094, 1.174) | (0.550, 3.663) | |
| Fit of model | ||
| C-statistic | 0.80 | 0.83 |
CI, confidence interval; HRR, health referral region; SES, socioeconomic status.
DISCUSSION
Our study indicates that 56 percent of patients with newly diagnosed ovarian cancer over age 65 received chemotherapy within 1 year of diagnosis. As expected, medical factors were the primary determinant of this chemotherapy use. Race, income, and geographic location also were significant in predicting chemotherapy use, although far less so than medical characteristics.
The role of stage, age, and comorbidities in the choice to administer chemotherapy is well known. Chemotherapy is not a primary therapy for stage 1 ovarian cancer but is increasingly recommended for stages 2 and 3 (Chen and Berek 2001). The odds of chemotherapy use by stage estimated here reflect these recommendations. A decreased likelihood of chemotherapy as patients' age has been shown for ovarian cancer (Sundararajan et al. 2002) and other cancers (Greenfield et al. 1987; Ries 1993; Hightower et al. 1994; Hillner et al. 1996). That comorbidities typically reduce the odds of chemotherapy use has been shown elsewhere (Desch et al. 1996; Extermann et al. 1998; Earle, Venditti, and Neumann 2000). These factors are often related to the probability of tolerance or complications of chemotherapy. Finally, time trend has been grouped with medical factors to account for changes in practice patterns and technology. Chemotherapy use increased in the 1990s, consistent with the growing application of new chemotherapy technologies (Chen and Berek 2001).
Less understood is the role of geography (Wennberg and Gittelsohn 1973) and SES (Bradley, Given, and Roberts 2002; Madison et al. 2004) in determining treatment rates. Consistent with the literature, we found a robust, statistically significant relationship between geography and chemotherapy use. This relationship was slightly stronger after adjustment for medical factors and was slightly weaker after adjustment for socioeconomic factors. SES was also important: being black or poor was correlated with lower rates of chemotherapy for ovarian cancer. A previous paper found lower chemotherapy rates for ovarian cancer in Hispanic but not black patients (Sundararajan et al. 2002). The lower rates for black patients are consistent with findings in lung and colorectal cancers (Shavers and Brown 2002).
Although HRRs were a strongly significant determinant of chemotherapy use, their influence was small relative to that of medical characteristics. Figure 1 best describes this finding. Studies of determinants of use typically do not separate the contribution of the various factors toward the variation between patients or between regions. The ω statistic provides this perspective. The ω of 0.066 between HRRs and medical characteristics (Table 4, Model [3]) suggests that characteristics of individual patients are 15 times more important than HRRs in predicting which patients will receive chemotherapy. If medical characteristics are the determinants of use at the patient–physician encounter and HRR is a marker for where that encounter occurs, this suggests that, to the degree that chemotherapy use can be explained, it is mostly determined at the patient–physician level. The HRR in which the patient lives does not seem to be a determinant, a somewhat reassuring finding.
The systematic variation among regions that does exist may still offer opportunities for improving practice, even if dwarfed by patient-level factors. This is most dramatically demonstrated in the stratified analysis by time. Practice improvements due to use of paclitaxel led to a remarkable reduction in HRR variation. Other opportunities to improve practice through market factors may also exist. We found that more hospitals with oncology facilities in a market predicted greater use of chemotherapy. It is unclear whether oncology providers induce excess use of chemotherapy or whether the lack of oncology facilities in a market leads to underuse. However, the manner in which health systems are organized clearly influences the probability that patients residing in those systems will receive treatment—but again, these effects are small when compared with seemingly appropriate medical considerations.
In addition, the HRR level of variation in SES relative to medical variation has an  of 0.40, while the same ω at the patient level was 0.04. Taken together, these data suggest that an individual's SES contributes little to the odds of receiving chemotherapy in ovarian cancer, but patients in higher-SES regions are more likely to receive chemotherapy than patients in lower-SES regions. The small role of individual SES may be partially explained by the fact that all patients studied had Medicare coverage for treatment. However, these patients may still have differences in supplemental coverage which could still play a role in chemotherapy use. A region's average SES predicts the degree of intensive treatment in the HRR. A region's market characteristics also appear to matter. However, the largest part of the variation remains unexplained.
Our study had several limitations. First, the findings for the Medicare non-HMO patients may not be generalizable to all elderly patients or all patients with ovarian cancer. Similarly, the SEER sites are not entirely representative of the U.S. population. Finally, our use of the HRR may not completely reflect the region by which health care delivery decisions are made. In some areas, a narrower or wider geographic definition may be more appropriate.
CONCLUSIONS
The factors influencing the decision to administer chemotherapy are generally based on appropriate variables. One could argue that all the variation in chemotherapy use should be explained by patient's medical factors and not by the patient's geographic region. However, this may be unrealistic. The policy question may be what amount of variation across regions is acceptable. We are reassured that racial and SES disparities inside the HRR do not seem to be great. However, the SES of the HRR does slightly influence decision making, which raises equity concerns.
As for the effects of oncologist providers on the practice of receiving chemotherapy, why should the accessibility of a hospital with oncology facilities influence the chance of receiving chemotherapy? On the surface, this implies that oversupply drives demand or that insufficient supply leaves some without needed chemotherapy. However, if this finding denotes a relationship between MD/oncologists and other regional variables not fully defined, then physician- or hospital supply-driven demand may not be the only explanation. Whatever the reason, it remains reassuring that this effect is small compared with the influence of medical characteristics.
Acknowledgments
This paper was supported by NCI Grant #R01-CA095664 (J. H. S.) and NSF Grant SES-0345113 (P. R. R.). This study used the linked SEER-Medicare database. The interpretation and reporting of these data are the sole responsibility of the authors. Tha authors acknowledge the effort of the Applied Research Program, NCI; the Office of Research, Development and Information, CMS; Information Management Services (IMS), Inc.; and the Surveillance, Epidemiology, and End Results (SEER) Program tumor registries in the creation of the SEER-Medicare database.
REFERENCES
- American Cancer Society. Cancer Facts and Figures 2004. Atlanta: American Cancer Society; 2004. [Google Scholar]
- Baker L C. The Effect of HMOs on Fee-for-Service Health Care Expenditures: Evidence from Medicare. Journal of Health Economics. 1997;16(4):453–82. doi: 10.1016/s0167-6296(96)00535-8. [DOI] [PubMed] [Google Scholar]
- Baxter N N, Virnig B A, Durham S B, Tuttle T M. Trends in the Treatment of Ductal Carcinoma In Situ of the Breast. Journal of the National Cancer Institute. 2004;96(6):443–8. doi: 10.1093/jnci/djh069. [DOI] [PubMed] [Google Scholar]
- Bradley C J, Given C W, Roberts C. Race, Socioeconomic Status, and Breast Cancer Treatment and Survival. Journal of the National Cancer Institute. 2002;94(7):490–6. doi: 10.1093/jnci/94.7.490. [DOI] [PubMed] [Google Scholar]
- Brown L J, Barnett J R. Influence of Bed Supply and Health Care Organization on Regional and Local Patterns of Diabetes Related Hospitalization. Social Science and Medicine. 1992;35(9):1157–70. doi: 10.1016/0277-9536(92)90228-i. [DOI] [PubMed] [Google Scholar]
- Chen L, Berek I S. Ovarian. In: Haskell CM, et al., editors. Cancer Treatment. 5. Philadelphia: W.B. Saunders Company; 2001. pp. 900–32. [Google Scholar]
- Desch C E, Penberthy L T, Newschaffer C J, Hillner B E, Whittemore M, McClish D, Smith T J, Retchin S M. Factors That Determine the Treatment for Local and Regional Prostate Cancer. Medical Care. 1996;34(2):152–62. doi: 10.1097/00005650-199602000-00007. [DOI] [PubMed] [Google Scholar]
- Devesa S S, Grauman D J, Blot W J. Recent Cancer Patterns among Men and Women in the United States: Clues for Occupational Research. Journal of Occupational Medicine. 1994;36(8):832–41. [PubMed] [Google Scholar]
- Earle C C, Venditti L N, Neumann P J. Who Gets Chemotherapy for Metastatic Lung Cancer? Chest. 2000;117(5):1239–46. doi: 10.1378/chest.117.5.1239. [DOI] [PubMed] [Google Scholar]
- Elixhauser A, Steiner C, Harris D R, Coffey R M. Comorbidity Measures for Use with Administrative Data. Medical Care. 1998;36(1):8–27. doi: 10.1097/00005650-199801000-00004. [DOI] [PubMed] [Google Scholar]
- Extermann M, Overcash J, Lyman G H, Parr J, Balducci L. Comorbidity and Functional Status Are Independent in Older Cancer Patients. Journal of Clinical Oncology. 1998;16(4):1582–7. doi: 10.1200/JCO.1998.16.4.1582. [DOI] [PubMed] [Google Scholar]
- Farrow D C, Hunt W C, Samet J M. Geographic Variation in the Treatment of Localized Breast Cancer. New England Journal of Medicine. 1992;326(17):1097–101. doi: 10.1056/NEJM199204233261701. [DOI] [PubMed] [Google Scholar]
- Ginsburg P B, Koretz D M. Bed Availability and Hospital Utilization: Estimates of the Roemer Effect. Health Care Financing Review. 1983;5(1):87–92. [PMC free article] [PubMed] [Google Scholar]
- Goodman D C, Fisher E, Stukel T A, Chang C. The Distance to Community Medical Care and the Likelihood of Hospitalization: Is Closer Always Better? Journal of Public Health. 1997;87(7):1144–50. doi: 10.2105/ajph.87.7.1144. [DOI] [PMC free article] [PubMed] [Google Scholar]
- Greenfield S, Blanco D M, Elashoff R M, Ganz P A. Patterns of Care Related to Age of Breast Cancer Patients. Journal of the American Medical Association. 1987;257(20):2766–70. [PubMed] [Google Scholar]
- Hightower R D, Nguyen N H, Averaette H E, Hoskins W, Harrison T, Steren A. National Survey of Ovarian Carcinoma. IV: Patterns of Care and Related Survival for Older Patients. Cancer. 1994;73(2):377–83. doi: 10.1002/1097-0142(19940115)73:2<377::aid-cncr2820730223>3.0.co;2-#. [DOI] [PubMed] [Google Scholar]
- Hillner B E, Penberthy L T, Desch C E, McDonald M K, Smith T J, Retchin S M. Variation in Staging and Treatment of Local and Regional Breast Cancer in the Elderly. Breast Cancer Research Treatment. 1996;40:75–86. doi: 10.1007/BF01806004. [DOI] [PubMed] [Google Scholar]
- Krieger N. Overcoming the Absence of Socioeconomic Data in Medical Records: Validation and Application of a Census-Based Methodology. American Journal of Public Health. 1992;92:703–10. doi: 10.2105/ajph.82.5.703. [DOI] [PMC free article] [PubMed] [Google Scholar]
- Lai S, Lai H, Lamm S, Obek C, Krongrad A, Roos B. Radiation Therapy in Non-Surgically-Treated Nonmetastatic Prostate Cancer: Geographic and Demographic Variation. Urology. 2001;57(3):510–7. doi: 10.1016/s0090-4295(00)01034-7. [DOI] [PubMed] [Google Scholar]
- Lu-Yao G L, Greenberg E R. Changes in Prostate Cancer Incidence and Treatment in USA. Lancet. 1994;343(8892):251–4. doi: 10.1016/s0140-6736(94)91109-6. [DOI] [PubMed] [Google Scholar]
- Madison T, Schottenfeld D, James S A, Schwartz A G, Gruber S B. Endometrial Cancer: Socioeconomic Status and Racial/Ethnic Differences in Stage at Diagnosis, Treatment, and Survival. American Journal of Public Health. 2004;94(12):2104–11. doi: 10.2105/ajph.94.12.2104. [DOI] [PMC free article] [PubMed] [Google Scholar]
- McGuire W P, Hoskins W J, Brady M F, Kucera P R, Partridge E E, Look K Y, Clarke-Pearson D L, Davidson M. Cyclosphosphamide and Cisplatin Compared with Paclitaxel and Cisplatin in Patients with Stage III and Stage IV Ovarian Cancer. New England Journal of Medicine. 1996;334(1):1–6. doi: 10.1056/NEJM199601043340101. [DOI] [PubMed] [Google Scholar]
- McGuire W P, Ozols R F. Chemotherapy of Advanced Ovarian Cancer. Seminal Oncology. 1998;25(3):340–8. [PubMed] [Google Scholar]
- Nattinger A B, McAuliffe T L, Schapira M M. Generalizability of the Surveillance, Epidemiology, and End Results Registry Population: Factors Relevant to Epidemiologic and Health Care Research. Journal of Clinical Epidemiology. 1997;50:939–45. doi: 10.1016/s0895-4356(97)00099-1. [DOI] [PubMed] [Google Scholar]
- Neijt J P. New Therapy for Ovarian Cancer. New England Journal of Medicine. 1996;334:50–1. doi: 10.1056/NEJM199601043340112. [DOI] [PubMed] [Google Scholar]
- Potosky A L, Riley G F, Lubitz J D, Mentnech R M, Kessler L G. Potential for Cancer Related Health Services Research Using a Linked Medicare-Tumor Registry Database. Medical Care. 1993;31:732–48. [PubMed] [Google Scholar]
- Ries L A. Ovarian Cancer: Survival and Treatment Differences by Age. Cancer. 1993;71:524–9. doi: 10.1002/cncr.2820710206. [DOI] [PubMed] [Google Scholar]
- Ries L A G, Kosary C L, Hankey B F, Miller B A, Harras A, Edwards B K. SEER Cancer Statistics Review 1973–1994. NIH publication 97-2789. Bethesda, MD: National Cancer Institute; 1997. [Google Scholar]
- Roemer M I. National Health Systems of the World. Vol. 2. New York: Oxford University Press; 1991. [Google Scholar]
- Rohrer J E. Supply-induced Demand for Hospital Care. Health Services Management Research. 3(1):41–8. doi: 10.1177/095148489000300105. [DOI] [PubMed] [Google Scholar]
- SEER. Cancer Statistics Review 1973–1996. Bethesda, MD: National Institutes of Health; 2000. Available at http://seer.cancer.gov/csr/1973_1996/ [Google Scholar]
- Shavers V L, Brown M L. Racial and Ethnic Disparities in the Receipt of Cancer Treatment. Journal of the National Cancer Institute. 2002;94(5):334–57. doi: 10.1093/jnci/94.5.334. [DOI] [PubMed] [Google Scholar]
- Silber J H, Rosenbaum P R, Ross R N. Comparing the Contributions of Groups of Predictors: Which Outcomes Vary with Hospital Rather Than Patient Characteristics? Journal of the American Statistical Association. 1995;90:7–18. [Google Scholar]
- Silber J H, Rosenbaum P R, Trudeau M E, Even-Shoshan O, Chen W, Zhang X, Mosher R E. Multivariate Matching and Bias Reduction in the Surgical Outcomes Study. Medical Care. 2001;39:1048–64. doi: 10.1097/00005650-200110000-00003. [DOI] [PubMed] [Google Scholar]
- Sundararajan V, Hershman D, Grann V R, Jacobson J S, Neugut A I. Variations in the Use of Chemotherapy for Elderly Patients with Advanced Ovarian Cancer: A Population-Based Study. Journal of Clinical Oncology. 2002;20(1):173–8. doi: 10.1200/JCO.2002.20.1.173. [DOI] [PubMed] [Google Scholar]
- Wennberg J E, Cooper M M. The Dartmouth Atlas of Health Care 1998. Hanover, NH: Center for the Evaluative Clinical Sciences, Dartmouth Medical School; 1998. [PubMed] [Google Scholar]
- Wennberg J E, Gittelsohn S. Small Area Variations in Health Care Delivery. Science. 1973;182:1102–8. doi: 10.1126/science.182.4117.1102. [DOI] [PubMed] [Google Scholar]
- White H. A Heteroskedasticity-Consistent Covariance Matrix Estimator and a Direct Test for Heteroskedasticity. Econometrica. 1980;48:817–38. [Google Scholar]
- Yancik R, Ries L G, Yates J W. Ovarian Cancer in the Elderly: An Analysis of Surveillance, Epidemiology, and End Results Program Data. American Journal of Obstetrics and Gynecology. 1986;154:639–47. doi: 10.1016/0002-9378(86)90623-x. [DOI] [PubMed] [Google Scholar]
- Zippin C, Lum D, Hankey B F. Completeness of Hospital Cancer Case Reporting from the SEER Program of the National Cancer Institute. Cancer. 1995;76:2343–50. doi: 10.1002/1097-0142(19951201)76:11<2343::aid-cncr2820761124>3.0.co;2-#. [DOI] [PubMed] [Google Scholar]