Abstract
Background
Recent studies have shown that microvascular dysfunction after myocardial infarction is a dynamic phenomenon.
Aims
To evaluate the implications of dynamic changes in microvascular dysfunction on contractile recovery and left ventricular remodelling, and to identify the ideal timing of assessment of such microvascular dysfunction.
Methods and results
In 39 patients with a first myocardial infarction who underwent successful percutaneous coronary intervention, microvascular dysfunction was studied by myocardial contrast echocardiography (MCE) at 24 h, 1 week and 3 months after the procedure. Real‐time MCE was performed by contrast pulse sequencing and intravenous Sonovue. 14 patients exhibited left ventricular remodelling at 3 months (>20% increase in left ventricular end‐diastolic volume, group B), whereas 25 did not (group A). Microvascular dysfunction was similar in the two groups at 24 h and improved in group A only, being significantly better than that of group B at 1 week (p<0.05) and 3 months (p<0.005). Improvement in microvascular dysfunction was not associated with improvement in wall motion in the same segments. With multivariate analysis including all echocardiographic variables, microvascular dysfunction at 1 week was found to be the only independent predictor of left ventricular remodelling (p<0.01). With a cut‐off value of 1.4, 1‐week microvascular dysfunction predicts left ventricular remodelling with sensitivity and specificity of 73%.
Conclusions
Improvement in microvascular dysfunction occurs early after myocardial infarction, although it is not associated with a parallel improvement in wall motion but is beneficial in preventing left ventricular remodelling. Accordingly, 1‐week microvascular dysfunction is a powerful and independent predictor of left ventricular remodelling.
Despite optimal infarct‐related artery recanalisation by percutaneous coronary intervention (PCI) significant left ventricular dilatation occurs in about 30% of patients with acute and chronic myocardial infarction.1 In these patients, microvascular dysfunction, as documented by intracoronary myocardial contrast echocardiography (MCE) performed soon after PCI, has been shown to be the most powerful independent predictor of left ventricular dilatation and the only predictor of cardiac death, reinfarction and heart failure.2
Microvascular dysfunction on MCE is documented as absent contrast opacification within a myocardial region, probably as the result of an obstructed microvascular network. Of note, lack of contrast opacification after PCI, a phenomenon known as “no‐reflow”, is associated with reduced coronary flow reserve of the culprit artery.3 Microvascular damage may be sustained when obstruction is associated with anatomical damage of post‐ischaemic microvessels, or it may be reversible when it is due to functional changes in microvascular flow.4,5 Indeed, we have recently documented that microvascular dysfunction at intravenous MCE spontaneously improves within the first month of myocardial infarction in about 50% of cases.6
To explore the pathophysiological and clinical implications of dynamic changes in microvascular dysfunction on regional contractile dysfunction and on left ventricular remodelling, we applied a non‐invasive, easily repeatable and bed‐side technique, such as intravenous real‐time MCE, to identify changes in microvascular dysfunction at 24 h and 1 week after PCI. We hypothesised that, given the dynamic nature of microvascular dysfunction, the simultaneous analysis of temporal changes in myocardial and microvascular function at different times after successful primary PCI could identify peculiar forms of post‐PCI dysfunctioning myocardium. Furthermore, we aimed to assess the timing for the MCE test to provide the best prognostic information, along with the ideal cut‐off of MCE score able to predict left ventricular remodelling.
Patients and methods
Study population
In all, 39 patients (34 men, with a mean (SD) age of 59.1 (9.6) years) admitted to our coronary care unit with first ST elevation acute myocardial infarction undergoing successful PCI within 6 h of pain onset were enrolled in the study. Diagnosis of myocardial infarction was based on the following: typical chest pain lasting more than 30 min and unresolved by nitroglycerine; ST segment elevation >0.1 mV in at least two contiguous leads in the initial ECG. Exclusion criteria were: (1) cardiogenic shock or clinical instability; (2) inadequate echocardiographic image quality; (3) malignant life‐threatening diseases; and (4) inability to give informed consent. The Ethics Committee of the Catholic University of the Sacred Heart, Rome, Italy, approved the study and all patients gave informed consent to participate.
Recanalisation strategy
In all patients, catheterisation was performed by the percutaneous femoral approach. After diagnostic coronary angiography, intracoronary nitroglycerine 0.1 mg was given to reverse any possible epicardial spasm.
Then, in all patients, primary PCI with stenting of the infarct‐related artery was performed according to the clinical protocol used at our institution. Glycoprotein IIb/IIIa receptor inhibitors were used in all patients. Coronary angiograms were stored on a compact disk for off‐line analysis. Flow in the infarct vessel was graded by means of the thrombolysis in myocardial infarction (TIMI) flow classification. Successful PCI was defined as the restoration of TIMI 3 or 2 flow. Residual stenosis of the culprit artery after PCI was <20% in all patients.
Myocardial contrast echocardiography
Conventional echocardiography and MCE were performed in all patients within 24 h (19.9 (12.3) h) of coronary recanalisation, at 1 week and 3 months. In all patients, follow‐up echocardigraphy was performed at 3 months for the evaluation of regional and global left ventricular function and volumes.
MCE studies were performed using real‐time contrast pulse sequencing operating on a Sequoia ultrasound system (Siemens, Berlin, Germany). Contrast pulse sequencing is a novel real‐time MCE method that, thanks to the analysis of non‐linear response of contrast bubbles in fundamental and higher harmonics, is able to provide an image with excellent signal to noise ratio and with particularly high sensitivity using a very low mechanical index.
Acoustic power and compression were maximised and gain settings were optimised at the onset of each study and held constant throughout. The focus was initially set at two thirds of the depth of the image, and then moved to the level of the myocardial segment to be examined. The definitive setting of the ultrasound images was optimised after initial contrast infusion, kept constant throughout the study and matched at follow‐up MCE study.
The intravenous contrast used in this study was Sonovue (Bracco, Milan, Italy), a second‐generation ultrasound contrast agent that consists of microbubbles containing sulphur hexafluoride surrounded by a phospholipid shell. The mean size and concentration of the microbubbles is 2.5 μm and (1–5)×108/ml, respectively. It is reconstituted by the addition of normal saline to the final solution of 5 ml. Sonovue was given intravenously at the rate of 2 ml/min.
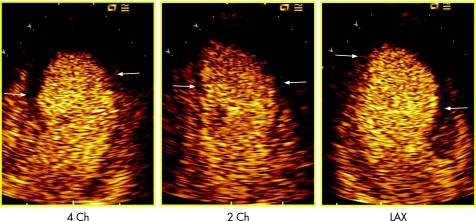
Contrast images were acquired in apical four‐chamber, two‐chamber and long‐axis view (fig 1); as soon as the myocardial videointensity had reached a plateau, a flash of ultrasound with very high mechanical index was given to destroy the microbubbles in the sector, and then the replenishment of the bubbles was observed and digitally acquired and stored on a magneto‐optical disk.
Figure 1 Example of myocardial contrast echocardiography image in 4 chamber (4 Ch), 2 chamber (2 Ch) and long axis (LAX) view. The microvascular network reached by the microbubbles is coloured orange, whereas a large area of microvascular dysfunction is shown in each view as a black area at the apex (within arrows).
Data analysis
Two experienced observers who had no knowledge of the patients' identity provided visual interpretation of the echocardiograms; disagreement was resolved by consensus. Images were randomised across time points and patients. Regional wall motion was semiquantitatively scored according to the recommendations of the American Society of Echocardiography7 (1 = normal; 2 = hypokinesia; 3 = akinesia; and 4 = dyskinesia) and a wall motion score index (WMSI) was calculated as the sum of the score of all segments divided by the total number of segments. The total number of akinetic and dyskinetic segments was also recorded for each patient. End‐diastolic and end‐systolic left ventricular volumes were calculated from four‐chamber and two‐chamber views using the modified Simpson biplane method. Ejection fraction was calculated from the formula (end‐diastolic volume – end‐systolic volume)/end‐diastolic volume.
Myocardial opacification at MCE, the echocardiographic parameter of microvascular dysfunction, was visually assessed in each myocardial segment and semiquantitatively scored. A single perfusion score was assigned on the basis of both the change in myocardial signal intensity throughout the replenishment curve and the degree of opacification at the peak contrast effect.8 Scores were graded as: 1, normal (homogeneous opacification approximating that of the normal region at peak and normal rate of increase in signal); 2, reduced (partial or reduced opacification compared with the normal region at peak and/or reduced rate of increase in signal intensity); and 3, absent (no opacification throughout the replenishment time). An MCE score index (MCESI) was calculated as the sum of the MCE score in each segment divided by the total number of segments. The number of non‐perfused segments (MCE score = 3) was also recorded for each patient.
On the basis of MCE temporal changes, each myocardial segment with contractile dysfunction (WMS 3 or 4) was considered as showing: reflow (MCE score 1 or 2 at 24 h and at 1 week); sustained microvascular dysfunction (MCE score 3 at 24 h and at 1 week); or reversible microvascular dysfunction (MCE score 3 at 24 h but 1 or 2 at 1 week).
To assess intraobserver variability in MCE analysis, 16 MCE studies obtained in the first eight patients were independently reviewed by the same observer (LG) at a mean (SD) of 40 (10) days after initial scoring. Interobserver variability was assessed by comparing the readings of two observers (LG, AL). Intraobserver and interobserver variabilities of MCESI were 3.2% (2) and 4.2% (2) (absolute difference), respectively. For left ventricular volume analysis, intraobserver and interobserver variability was 3.4% (1) and 5.1% (2), respectively.
Statistical analysis
Statistical analysis was performed using an SPSS software package. Continuous variables were compared by Student's t test or Wilcoxon test and presented as mean (SD). Proportions were compared by χ2. Changes in continuous variables over time and comparison among groups were analysed using two‐way analysis of variance for repeated measures and Scheffe's F test. Differences were considered significant at p⩽0.05.
Bivariate correlation analysis was performed to compare WMSI and MCESI at 24 h and 1 week and their temporal changes (from 24 h to 1 week) and temporal changes in left ventricular volume (from 24 h to 3 months), and Pearson's correlation coefficient was calculated.
A multiple linear regression analysis was also performed to compare MCESI, WMSI, and number of non‐perfused and akinetic segments in the prediction of left ventricular dilatation.
Receiver operating characteristic analysis was performed to estimate sensitivity and specificity on the basis of a wide range of cut‐off points. Test performance was estimated by calculating the area under the curve. The optimal cut‐off value was defined as that providing maximal accuracy in distinguishing between patients with and without left ventricular dilation.
Results
The study population comprised 39 patients with a first acute and chronic myocardial infarction, treated with primary PCI within 6 h of symptom onset (3.7 (2) h). According to previous studies,1,9 our population was classified as patients without left ventricular dilation if, at the 3 month follow‐up, EDV increased by <20% (from 104.3 (30.7) to 106.7 (29.6); p = NS; group A) and as patients with left ventricular dilation if EDV increased by ⩾20% (from 92.8 (22.4) to 136.9 (28.6); p<0.001; group B). Table 1 summarises the clinical characteristics of groups A and B. Lower prevalence of TIMI 3 flow (p<0.05), higher peak creatine kinase (p<0.05) and higher prevalence of patients showing no reflow (p<0.05) were observed in group B.
Table 1 Clinical characteristics of group A and B patients.
| Group A (n = 25) | Group B (n = 14) | p Value | |
|---|---|---|---|
| Sex (male) | 22 | 12 | NS |
| Age (years) | 58.7 (8.9) | 59.8 (10.7) | NS |
| TIMI 3 (%) | 20 | 7 | <0.05 |
| Single‐vessel disease | 23 | 11 | NS |
| Double‐vessel disease | 1 | 3 | NS |
| Three‐vessel disease | 1 | 0 | NS |
| Smoking | 15 | 9 | NS |
| Hypercholesterolaemia (%) | 12 | 6 | NS |
| Hypertension (%) | 15 | 7 | NS |
| Diabetes (%) | 3 | 2 | NS |
| Preceding angina (%) | 7 | 2 | NS |
| Time to reperfusion (min) | 3.5 (2.5) | 5 (5.2) | NS |
| Early Q waves | 2.1 (1.9) | 2.4 (1.2) | NS |
| Peak CK (UI/ml) | 2666.1 (1037.1) | 4314.3 (1966.6) | <0.05 |
| No‐reflow at MCE | 10 | 11 | <0.05 |
CK, creatine kinase; MCE, myocardial contrast echocardiography; TIMI, thrombolysis in myocardial infarction.
Values are number or mean (SD).
Temporal changes in myocardial and microvascular damage
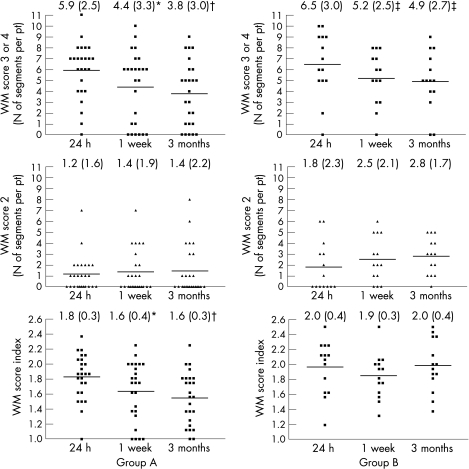
Figure 2 shows the temporal changes in regional contractile dysfunction between 24 h after PCI, 1‐week and 3‐month follow‐up in groups A and B. Although the number of segments with WMS 2 did not change over time in either group, the number of segments with WMS 3 or 4 had significantly decreased at 1 week (p<0.005 vs 24 h) and at 3 months (p<0.001 vs 24 h) in group A and, although to a lower extent, in group B (p<0.05 at 1 week and 3 months vs 24 h). Notably, WMSI had improved in group A at 1 week (p<0.005 vs 24 h) and at 3 months (p<0.001 vs 24 h), but not in group B (p = NS). No difference in the extent of contractile dysfunction was observed in both groups between 1 week and 3 months.
Figure 2 Number of segments per patient (pt) with wall motion (WM) score = 3 (akinetic) and 4 (dyskinetic) (top panels), WM score = 2 (hypokinetic) (middle panels) and WM score index (WMSI) (lower panels) at 24 h, 1 week and 3 weeks after percutaneous coronary intervention in group A (left panels) and B patients (right panels). Although the number of WM score 2 segments did not change over time in the two study groups, the number of WM score 3 and 4 segments was significantly reduced at 1 week (*p<0.005 vs 24 h) and 3 months (†p<0.001 vs 24 h) in group A and, although to a lower extent, in group B (‡p<0.05 vs 24 h). WMSI had improved only in group A patients at 1 week (*p<0.005 vs 24 h) and 3 months (†p<0.001 vs 24 h). Numbers at the top of each graph represent the mean (SD) for each dataset.
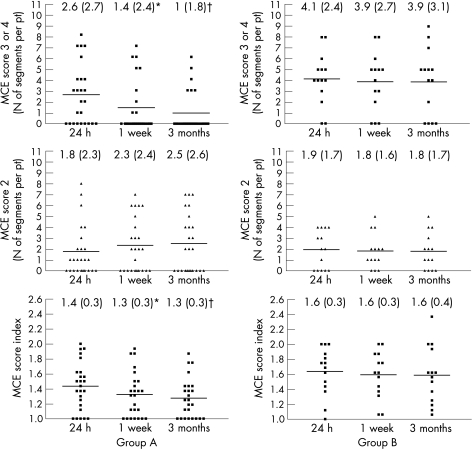
Figure 3 shows the temporal changes in microvascular dysfunction in groups A and B. Although the number of segments with MCE score 2 did not change over time in either group (p = NS), the number of MCE 3 segments and MCESI had significantly decreased both at 1 week (p<0.05 vs 24 h) and at 3 months (p<0.005 vs 24 h) in group A, but not in group B (p = NS). No difference in the extent of microvascular dysfunction was observed in both groups between 1 week and 3 months.
Figure 3 Number of segments per patient (pt) with myocardial contrast echocardiography (MCE) score = 3 (absent perfusion) (top panels), MCE score = 2 (reduced perfusion) (middle panels) and MCE score index (MCESI) (lower panels) for each patient at 24 h, 1 week and 3 weeks after percutaneous coronary intervention in group A (left panels) and B patients (right panels). Although the number of MCE 2 segments did not change over time in the two study groups, the number of MCE 3 segments and MCESI were significantly reduced at 1 week (*p<0.05 vs 24 h) and 3 months (†p<0.005 vs 24 h) only in group A patients. Numbers at the top of each graph represent the mean (SD) for each dataset.
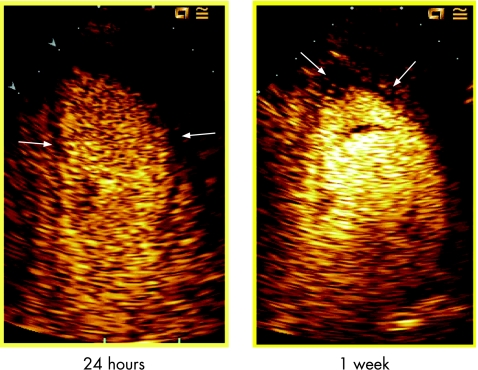
Figure 4 depicts an example of the reduction in microvascular dysfunction extent as non‐opacified area at MCE from 24 h to 1 week after PCI.
Figure 4 Example of myocardial contrast echocardiography (MCE) study in two‐chamber view at 24 h and 1 week. A significant reduction in microvascular dysfunction (black area within arrows) is evident at 1 week compared with 24 h MCE.
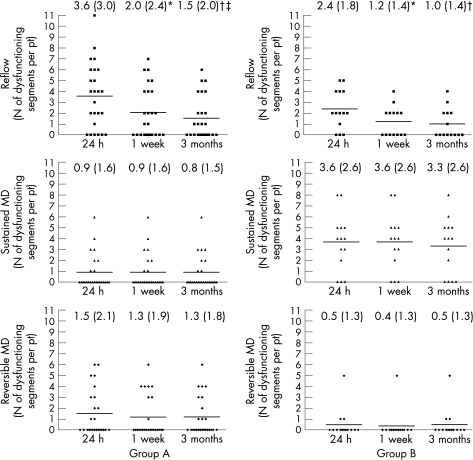
Figure 5 shows the correlation between temporal changes in microvascular dysfunction and contractile recovery, as changes in the number of dysfunctioning segments with different microvascular flow pattern (reflow, sustained and reversible microvascular dysfunction) in both groups of patients. Among segments showing reflow, the number of dysfunctioning segments (WMS 3 or 4) had decreased at 1 week (p<0.005 vs 24 h) and at 3 months (p<0.001 vs 24 h) in both groups. An additional reduction in the number of dysfunctioning reflow segments was observed between 1 week and 3 months in group A only (p<0.05). Among segments showing either sustained or reversible microvascular dysfunction, the number of dysfunctioning segments did not change over time in either group.
Figure 5 Number of dysfunctioning segments (wall motion score = 3 and 4) per patient (pt) with reflow (top panels), sustained microvascular dysfunction (MD) (middle panels) and reversible MD (bottom panels) in group A (left panels) and group B (right panels). The number of dysfunctioning reflow segments was reduced from 24 h to 1 week (*p<0.005) and 3 months (†p<0.001) after percutaneous coronary intervention (PCI) in both group A and B patients. An additional reduction in the number of such dysfunctioning reflow segments was observed between 1 week and 3 months after PCI (‡p<0.05) only in group A patients. The number of dysfunctioning with either sustained or reversible MD segments did not change over time in either group of patients. Numbers at the top of each graph represent the mean (SD) for each dataset.
Optimal timing for MCE and wall motion assessment in the prediction of left ventricular remodelling
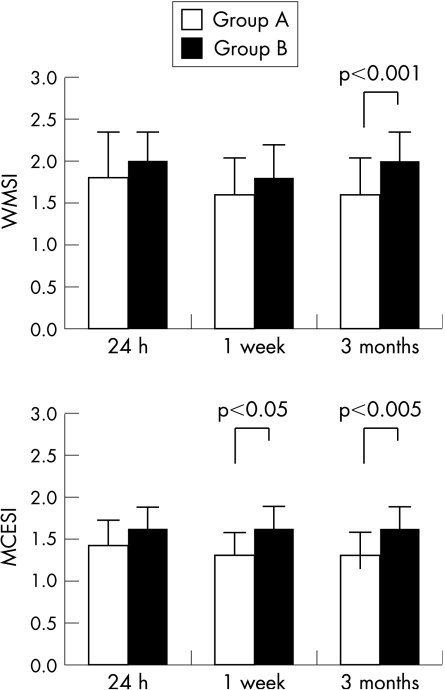
At 24 h after PCI, groups A and B had similar WMSI and MCESI (fig 6). In contrast, patients of group A, compared with those of group B, exhibited lower MCESI at 1 week (p<0.05) and lower WMSI (p<0.001) and MCESI (p<0.005) at 3 months (fig 6).
Figure 6 Differences between group A and B patients in wall motion score index (WMSI) (top panel) and MCE score index (MCESI) (bottom panel).
Linear regression analysis showed that, although WMSI did not correlate with changes in left ventricular volumes, MCESI at 24 h showed a weak and non‐significant correlation with changes in left ventricular volume (from 24 h to 3 months; r = 0.3 p = 0.08), and that, at 1 week, MCESI significantly correlated with such changes (r = 0.4, p = 0.006). Interestingly, temporal changes in MCESI (from 24 h to 1 week) showed a significant correlation with temporal changes in left ventricular volumes (r = 0.3, p = 0.05).
On multivariate analysis that included echocardiographic variables of microvascular and myocardial dysfunction such as MCESI, WMSI, number of dyskinetic segments and number of non‐perfused segments at 24 h and 1 week, only MCESI at 1 week was found to be predictive of left ventricular remodelling at 3 months (p = 0.006; R2 = 0.197; table 2).
Table 2 Multivariate analysis.
| Variables | β | p Value |
|---|---|---|
| 24 h MCESI | 21.255 | 0.079 |
| 24 h WMSI | 0.553 | 0.988 |
| 24 h non‐perfused segments | −1.142 | 0.762 |
| 24 h akinetic segments | −0.132 | 0.940 |
| 1 week MCESI | 33.285 | 0.006 |
| 1 week WMSI | −1.225 | 0.945 |
| 1 week non‐perfused segments | −1.095 | 0.578 |
| 1 week akinetic segments | −0.540 | 0.744 |
MCESI, myocardial contrast echocardiography score index; WMSI, wall motion score index.
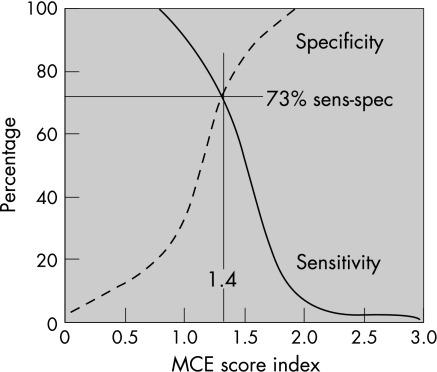
On receiver operating characteristic analysis, the best cut‐off value of MCESI at 1 week in predicting left ventricular remodelling at 3 months was 1.4, with sensitivity and specificity of 73% (fig 7).
Figure 7 Receiver operating characteristic analysis curves of 1‐week myocardial contrast echocardiography (MCE) score index showing the ideal cut‐off of 1.4 with sensitivity and specificity of 73% in predicting left ventricular dilatation.
Discussion
Our study shows that post‐infarct dysfunctioning myocardial segments that spontaneously recover their function are only those with preserved microvascular integrity and reflow guaranteed at 24 h. Post‐infarct microvascular dysfunction may spontaneously recover within the first week after primary PCI; yet, such improvement is not paralleled by contractile recovery in the same segments. Interestingly, such segments with recovered microvascular patency but persistent myocardial dysfunction are associated with preserved left ventricular volumes at follow‐up, thus significantly contributing to the prevention of left ventricular remodelling. Accordingly, in our study, microvascular dysfunction assessed 1 week after myocardial infarction, thus after the recovery of microvascular reflow, was the best predictor of left ventricular remodelling with sensitivity and specificity of 73% and a cut‐off value of 1.4 for the MCESI.
Reversible microvascular dysfunction coupled with persistent myocardial dysfunction
It is well known that post‐infarct microvascular integrity is a prerequisite to maintaining myocardial viability, so that contractile recovery of post‐infarct dysfunctioning myocardium may occur only within regions of preserved microvascular network.10 This concept is confirmed by our current data showing that contractile dysfunction was reversible in most segments showing reflow, but in none of the segments showing sustained microvascular dysfunction. Furthermore, we report, for the first time, that microvascular integrity alone does not guarantee recovery of function as segments with reversible microvascular dysfunction did not show recovery of function. Although in this study we could not estimate the extent of myocardial necrosis, the presence of subendocardial or patchy necrosis may be responsible for the lack of contractile recovery of function of such segments with preserved microvascular integrity.11
More importantly, although preserved microvascular integrity may not be sufficient to guarantee recovery of contractile function, our and previous studies show that such integrity is crucial to prevent adverse left ventricular remodelling. In fact, in accordance with Bolognese et al,2 we show that the extent of microvascular dysfunction is the best predictor of left ventricular remodelling. These authors assessed microvascular dysfunction with intracoronary MCE soon after primary PCI and report that microvascular dysfunction is the most important predictor not only of remodelling but also of cardiac death.2 In our study, microvascular dysfunction assessed at 24 h was associated with left ventricular remodelling, although only reaching a statistically significant difference at 1 week MCE. In fact, the present data confirm our previous report of reversible microvascular dysfunction, as shown by the recovery of microvascular flow at MCE in some segments initially not perfused at 24 h.6 Although we do not have a definitive explanation for this phenomenon, we postulate that it might be the result of resolution of potentially reversible mechanisms of microvascular obstruction such as arteriolar spasm, tissue oedema and cellular plugging.12
Dynamic changes in microvascular dysfunction and left ventricular remodelling
In this study, we showed that recovery of microvascular integrity within the first week after myocardial infarction has an important role in the prevention of left ventricular remodelling even in the absence of myocardial functional recovery. As a consequence of the association between preserved left ventricular volume and reversible microvascular dysfunction coupled with persistent myocardial dysfunction, microvascular patency status at 1 week after PCI was found to be the best independent predictor of left ventricular remodelling, being superior to wall motion abnormality assessment and to 24‐h MCE.
In this study, we report, for the first time, that, the best time to perform a MCE study aimed at the prognostic stratification of patients after myocardial infarction is 1 week after PCI. These data assume critical clinical importance as, based on the information that the best prognostic value is given by MCE performed 1 week after PCI, 24‐h MCE can be avoided and the test can be postponed to when the patient is clinically more stable.
We also report that the best cut‐off value of MCESI is 1.4, associated with a sensitivity and specificity of 73%. This is the first time that a MCESI cut‐off has been identified as able to predict the likelihood of a patient undergoing left ventricular dilatation, thus providing clinically important prognostic information in a measurable way.
Acknowledgements
We thank the nurses of the coronary care unit and the cardiology outpatient clinic for their invaluable help during the MCE studies.
Abbreviations
EDV - end‐diastolic volume
MCE - myocardial contrast echocardiography
MCESI - myocardial contrast echocardiography score index
PCI - percutaneous coronary intervention
TIMI - thrombolysis in myocardial infarction
WMS - wall motion score
WMSI - wall motion score index
Footnotes
Competing interests: None.
Informed consent was obtained for publication of the patients' details in this report.
References
- 1.Bolognese L, Neskovic A N, Parodi G.et al Left ventricular remodeling after primary coronary angioplasty. Patterns of left ventricular dilation and long‐term prognostic implications. Circulation 20021062351–2357. [DOI] [PubMed] [Google Scholar]
- 2.Bolognese L, Carrabba N, Parodi G.et al Impact of microvascular dysfunction on left ventricular remodeling and long term clinical outcome after primary coronary angioplasty for acute myocardial infarction. Circulation 20041091121–1126. [DOI] [PubMed] [Google Scholar]
- 3.Lepper W, Hoffman R, Kamp O.et al Assessment of myocardial reperfusion by intravenous myocardial contrast echocardiography and coronary flow reserve after primary percutaneous transluminal coronary angioplasty in patients with acute myocardial infarction. Circulation 20001012368–2374. [DOI] [PubMed] [Google Scholar]
- 4.Ito H, Iwakura K, Oh H.et al Temporal changes in myocardial perfusion patterns in patients in reperfused anterior wall myocardial infarction. Their relation to myocardial viability. Circulation 199591656–662. [DOI] [PubMed] [Google Scholar]
- 5.Brochet E, Czitrom D, Karila‐Cohen D.et al Early changes in myocardial perfusion patterns after myocardial infarction: relation with contractile reserve and functional recovery. J Am Coll Cardiol 1998322011–2017. [DOI] [PubMed] [Google Scholar]
- 6.Galiuto L, Lombardo A, Maseri A.et al Temporal evolution and functional outcome of no‐reflow: sustained and spontaneously reversible patterns following successful coronary recanalization. Heart 200389731–737. [DOI] [PMC free article] [PubMed] [Google Scholar]
- 7.Schiller N B, Shah P M, Crawford M.et al Recommendations for quantitation of the left ventricle by two‐dimensional echocardiography. American Society of Echocardiography Committee on Standards, Subcommittee on Quantitation of Two‐Dimensional Echocardiograms. J Am Soc Echocardiogr 19892358–367. [DOI] [PubMed] [Google Scholar]
- 8.Wei K, Jayaweera A R, Firoozan S.et al Quantification of myocardial blood flow with ultrasound‐induced destruction of microbubbles administered as a constant venous infusion. Circulation 199897473–483. [DOI] [PubMed] [Google Scholar]
- 9.Jeremy R W, Hackworthy R A, Bautovich G.et al Infarct artery perfusion and changes in left ventricular volume in the month after acute myocardial infarction. J Am Coll Cardiol 19879989–995. [DOI] [PubMed] [Google Scholar]
- 10.Iliceto S, Galiuto L, Marchese A.et al Analysis of microvascular integrity, contractile reserve, and myocardial viability after acute myocardial infarction by dobutamine echocardiography and myocardial contrast echocardiography. Am J Cardiol 199677441–445. [DOI] [PubMed] [Google Scholar]
- 11.Tennant R, Wiggers C J. The effect of coronary occlusion on myocardial contraction. Am J Physiol 1935112351–361. [Google Scholar]
- 12.Kloner R A, Rude R E, Carlson N.et al Ultrastructural evidence of microvascular damage and myocardial cell injury after coronary artery occlusion: which comes first? Circulation 198062945–952. [DOI] [PubMed] [Google Scholar]


