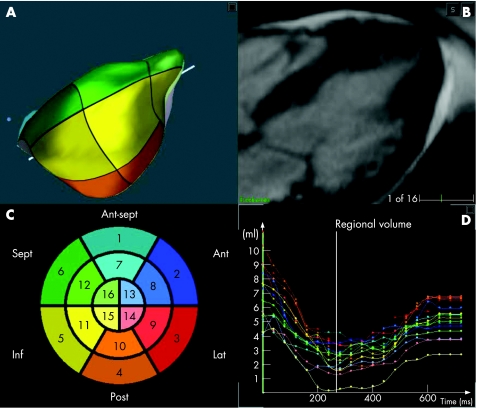
Figure 1 Example of radial long‐axis cardiac magnetic resonance image of the left ventricle obtained at end diastole in a patient with apical hypertrophic cardiomyopathy (B) and the detected endocardial surface (A). Schematic “bull's eye” representation of the three‐dimensional segmentation (C), with the colour notation used for the different segments in both the endocardial surface (A) and the regional left ventricular volume‐time curves (D). Ant, anterior; ant sept, antero‐septal; inf, inferior; lat, lateral; post, posterior; sept, septal.

An official website of the United States government
Here's how you know
Official websites use .gov
A
.gov website belongs to an official
government organization in the United States.
Secure .gov websites use HTTPS
A lock (
) or https:// means you've safely
connected to the .gov website. Share sensitive
information only on official, secure websites.
