Abstract
Background
Internal limiting membrane (ILM) peeling with indocyanine green (ICG) staining is a commonly used procedure to treat idiopathic macular holes (MH).
Aim
To report changes in the patterns of residual ICG fluorescence over time after vitrectomy using the Heidelberg Retina Angiograph 2 (HRA2, Heidelberg Engineering, Heidelberg, Germany).
Methods
10 patients (10 eyes) who had undergone vitrectomy for MH with ILM peeling were included. 9 (90%) patients underwent ILM peeling with ICG, and 1 (10%) patient had it with triamcinolone acetonide (TA). We observed residual ICG using HRA2, postoperatively. Autofluorescence, optical coherence tomography images and best‐corrected visual acuity (BCVA) measurements were also obtained. The minimal follow‐up was 3 months.
Results
The MHs were closed postoperatively in all patients (100%). In eyes that underwent ILM peeling with ICG, the BCVA improved significantly (p<0.001) in 8 (89%) eyes and was unchanged in 1 (11%) eye. HRA2 showed the ICG fluorescence patterns but not TA postoperatively. The ICG hyperfluorescent signal was typically diffuse at the posterior retina and was hypofluorescent around the fovea. The hyperfluorescence then migrated towards the optic nerve disc presumably along the nerve fibre, and the area of ILM peeling was clearly identified. A large number of hyperfluorescent dots were observed instead of diffuse hyperfluorescence that was observed just after surgery.
Conclusions
Patterns of residual ICG fluorescence were sequentially observed with HRA2 after vitrectomy for MH with ICG‐assisted ILM peeling.
Internal limiting membrane (ILM) peeling with indocyanine green (ICG) staining in macular hole surgery, first reported in 2000, has become the commonly used procedure to treat idiopathic macular hole (MH).1,2 However, morphological and functional retinal damage due to ICG‐assisted ILM peeling was reported recently.3 They include retinal pigment epithelial (RPE) changes,4,5,6,7 less improvement of best‐corrected visual acuity (BCVA)8,9,10 and visual field defects.11,12
The presence of persistent ICG fluorescence after MH surgery with ICG‐assisted ILM peeling using the Heidelberg Retina Angiograph 2 (HRA2, Heidelberg Engineering, Heidelberg, Germany) has also been reported.13 Although several reports indicated that an ICG fluorescence signal is present for a relatively long period after surgery,14,15,16,17 detailed kinetics of ICG after surgery have not been well investigated. Therefore, we observed residual ICG fluorescence after vitrectomy for MH with ICG‐assisted ILM peeling using HRA2.
Patients and methods
Patients
Ten eyes of 10 patients who had undergone vitrectomy for MH with ILM peeling were included in this study. Nine eyes (cases 1–9; 90%) underwent vitrectomy including vitreous cortex removal, ICG‐assisted ILM peeling, fluid–air exchange and gas tamponade. In one eye triamcinolone acetonide (TA) was used instead of ICG (case 10; 10%).18 Although HRA2 is non‐invasive, informed consent was obtained from all patients at every examination. Approval from the institutional review board of our institution was not required.
Surgical procedure
ICG dye solution was prepared as described previously.19,20 After dissolving 25 mg of ICG powder in 1 ml of distilled water, 4.0 ml of balanced salt solution (BSS) was added to obtain a 0.5% concentration. TA also was prepared according to a modified method described elsewhere.21 TA was washed with approximately 2.0 ml of BSS two or three times, and 2.5 ml of BSS was added. After creating a posterior vitreous detachment with visualisation by TA, approximately 0.3 ml of 0.5% ICG or prepared TA was sprayed onto the retinal surface to visualise the ILM and facilitate peeling. Excess ICG or TA was washed immediately. A fluid–air exchange and gas tamponade was performed using 20% sulphur hexafluoride (9 eyes; 90%) or 16% perfluoropropane (1 eye; 10%). All patients were instructed to remain in a face‐down position for at least 1 week, postoperatively.
Follow‐up
Patients were followed up at 2 weeks, and 1, 2, 3 and 6 months after surgery. The BCVA was measured, optical coherence tomography (OCT) examination was performed and colour fundus photographs were taken at every follow‐up visit. The retinal status was evaluated by slit‐lamp‐based biomicroscopy.
HRA2 examination
Postoperatively, HRA2 examination was performed to observe ICG fluorescence and autofluorescence images and OCT was performed to observe MH closure according to the instructions of the manufacturer. In addition, 5 of 10 eyes (50%; 4 eyes in the ICG group and the 1 eye that received TA) were examined before surgery.
HRA2 is a confocal laser scanning system that provides three types of images: fluorescein angiography (FA), ICG angiography and infrared reflectance images. HRA2 has three laser systems (a 488 nm solid‐state laser for FA, a 795 nm diode laser for ICG angiography and a 820 nm diode laser for infrared reflectance) and two filters (500 nm for FA and 810 nm for ICG). We adjusted the sensitivity and illumination so as to properly observe the ICG fluorescence. When ICG fluorescence was too faint to be observed, we processed the image with an averaging procedure, computing the mean image mode, to amplify the fluorescence signals.
Results
Table 1 shows the demographic data of all 10 eyes. The patients included four men and six women (mean (SD) age 61.4 (8.7) years; range 45–72 years). The MH closed in all eyes (100%) after surgery. The BCVA improved significantly (p<0.001) in 8 (80%) eyes (cases 1–5, 7–9) and was unchanged in 2 (20%) eyes (cases 6 and 10).
Table 1 Demographic data and visual changes in patients who underwent vitrectomy for idiopathic macular hole and examined with Heidelberg Retina Angiograph 2.
| Case | Age (years) | Gender | Vitrectomy with ICG/TA | BCVA (before surgery) | BCVA (1 month after surgery) | BCVA (3 months after surgery) | BCVA (6 months after surgery) |
|---|---|---|---|---|---|---|---|
| 1 | 69 | M | ICG | 20/48 | 20/63 | 20/80 | NA |
| 2 | 63 | F | ICG | 20/63 | 20/40 | 20/25 | NA |
| 3 | 70 | M | ICG | 20/40 | 20/16 | 20/16 | 20/16 |
| 4 | 64 | M | ICG | 20/160 | 20/63 | 20/50 | NA |
| 5 | 60 | F | ICG | 20/63 | 20/40 | 20/32 | NA |
| 6 | 72 | M | ICG | 20/125 | 20/63 | 20/100 | NA |
| 7 | 54 | F | ICG | 20/50 | 20/32 | 20/32 | 20/25 |
| 8 | 65 | F | ICG | 20/125 | 20/80 | 20/63 | 20/50 |
| 9 | 52 | F | ICG | 20/125 | 20/50 | 20/25 | 20/32 |
| 10 | 45 | F | TA | 20/80 | 20/80 | 20/80 | NA |
BCVA, best‐corrected visual acuity; F, female; ICG, indocyanine green; M, male; NA, not available; TA, triamcinolone acetonide.
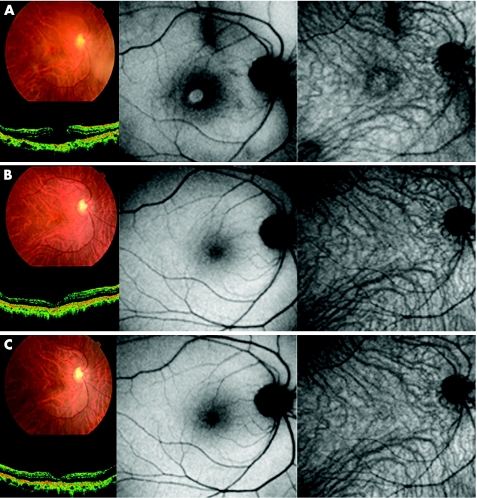
No ICG fluorescence was observed both before and after operation in the case in which TA was used (case 10; fig 1); however, we detected ICG fluorescence signals in the other nine cases postoperatively.
Figure 1 Case 10. Colour fundus photograph, optical coherence tomography (OCT), autofluorescence image and indocyanine green (ICG) fluorescence image of a patient who underwent vitrectomy for a macular hole (MH) with triamcinolone acetonide‐assisted internal limiting membrane peeling before surgery (top), 1 month after surgery (middle) and 3 months after surgery (bottom). (Top left) Fundus photograph and OCT image show the MH preoperatively. (Top centre) Autofluorescence image shows hyperfluorescence in the MH bed. (Top right) There is no fluorescence signal on the ICG fluorescence image. (Middle left) Fundus photograph and OCT image show MH closure after surgery. (Middle centre) Hyperfluorescence signal that was seen preoperatively on the autofluorescence image is no longer detected. (Middle right) There is no ICG fluorescence signal in the ICG image. (Bottom left and centre) The MH is closed and the fundus photograph, OCT image and autofluorescence image show normal architecture. (Bottom right) There is no ICG fluorescence signal.
Case presentations
Case3
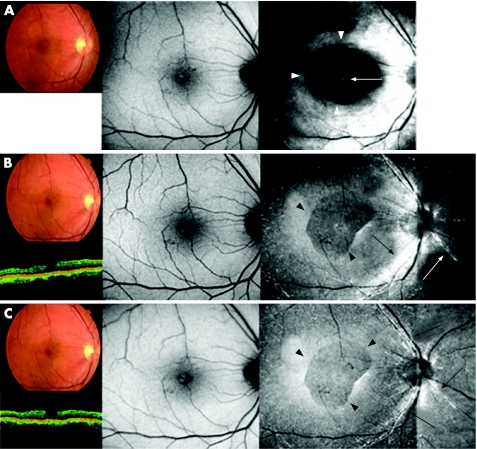
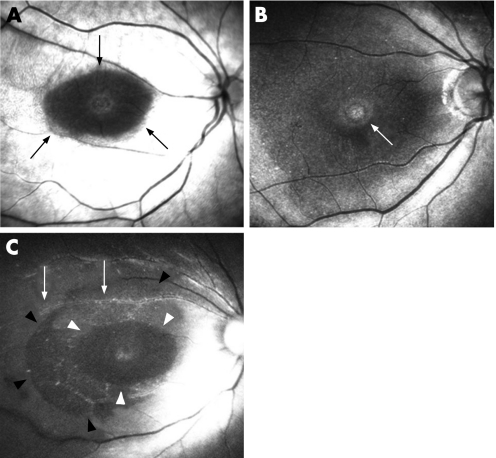
Figure 2 shows the ICG fluorescence images, autofluorescence images, OCT images and fundus photographs obtained 1, 3 and 6 months postoperatively in case 3. Fundus photograph, OCT images and autofluorescence images showed a MH before surgery; the BCVA was 20/40. Anatomical closure occurred 1 month after surgery (fig 2, top left). Autofluorescence image showed a faint hyperfluorescence signal at the fovea (fig 2, top centre). ICG fluorescence images showed hyperfluorescence distributed diffusely at the posterior retina and hypofluorescence around the fovea (fig 2, top right, white arrowheads). Hyperfluorescent spots corresponding to the MH were also present presumably at the RPE level (fig 2, top right, white arrow).
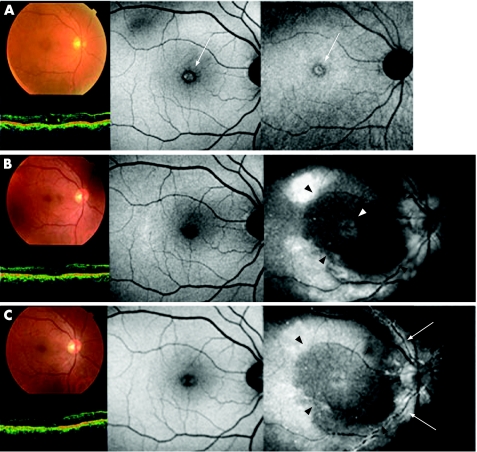
Figure 2 Case 4. Fundus photograph, optical coherence tomography (OCT), autofluorescence image and indocyanine green (ICG) fluorescence images of a patient who underwent vitrectomy for a macular hole (MH) with ICG‐assisted internal limiting membrane (ILM) peeling at the time of surgery (top), 1 month (middle) and 3 months (bottom), postoperatively. (Top left) Fundus photograph and OCT image showing a MH. (Top centre) Autofluorescence image shows hyperfluorescence in the MH bed (white arrow). (Top right) No apparent ICG fluorescence signal is detected, although hyperfluorescence in the MH bed was observed (white arrow). (Middle left and centre) 1 month after surgery, fundus photograph and OCT image show MH closure, and the foveal hyperfluorescence had resolved on the autofluorescence image. (Middle right) ICG hyperfluorescence is seen in the posterior retina with an area of hypofluorescence area (black arrowheads). A faint ICG signal is detected in the MH bed (white arrowhead). (Bottom left and centre) 3 months after the surgery, fundus photograph, OCT and autofluorescence image are unchanged. (Bottom right) Dot ICG hyperfluorescence is observed diffusely in the posterior retina resembling a stardust pattern. Dot fluorescence has accumulated along the artery (white arrows). The area of ILM peeling is clearly identified (black arrowheads).
Although fundus photographs and autofluorescence images showed no changes (fig 2, middle left and centre), the ICG hyperfluorescence migrated towards the optic disc nerve head, seemingly along the nerve fibre layer (NFL) 3 months postoperatively (fig 2, middle right, black arrows). At this time, the area of ILM peeling was clearly identified and differed from that of hypofluorescence around the fovea at 1 month after surgery (fig 2, middle right, black arrowheads), and hyperfluorescence was prominent along the retinal artery (fig 2, middle right, white arrow).
There were no changes on the colour fundus photographs and autofluorescence images 6 months after surgery (fig 2, bottom left and centre). An intense ICG signal at the NFL level almost disappeared and instead dots of hyperfluorescence resembling stardust developed extensively in the posterior retina. The edge of the peeled ILM membrane was still identifiable (fig 2, bottom right, black arrowheads). A relatively intense ICG signal was detected along the artery near the optic nerve disc (fig 2, bottom right, black arrows).
Case4
Preoperatively, OCT and fundus photographs showed a MH (fig 3, top left), and autofluorescence images showed hyperfluorescence corresponding to the MH bed (fig 3, top centre and right, white arrows). However, no ICG fluorescence was observed (fig 3, top right). OCT images showed anatomical closure of the MH 1 month after surgery (fig 3, middle left). The preoperative hyperfluorescent spots were no longer observed on the autofluorescence images (fig 3, middle centre). ICG hyperfluorescence was detected diffusely at the posterior retina and in the MH bed (fig 3, middle right, white arrowhead), and there was hypofluorescence around the fovea and might be the same area from which ILM is peeled (fig 3, middle right, black arrowheads).
Figure 3 The typical findings related to indocyanine green (ICG) after vitrectomy with ICG‐assisted internal limiting membrane (ILM) peeling are diffuse hyperfluorescence at the posterior retina (top left), hypofluorescence at the macula (top left, black arrows; bottom, white arrowheads), identification of area of ILM peeling (bottom, black arrowheads), hyperfluorescence in the bed of the macular hole (top right, white arrow), diffuse stardust‐like hyperfluorescence (bottom) and hyperfluorescence along the retinal artery (bottom, white arrows).
At 3 months after surgery, no changes were seen in the fundus photographs, OCT and autofluorescence images (fig 3, bottom left and centre). A small number of dots of hyperfluorescence were observed along the artery (fig 3, bottom right, white arrows). The area of foveal hypofluorescence was still clearly identifiable (fig 3, bottom right, black arrowheads).
Case6
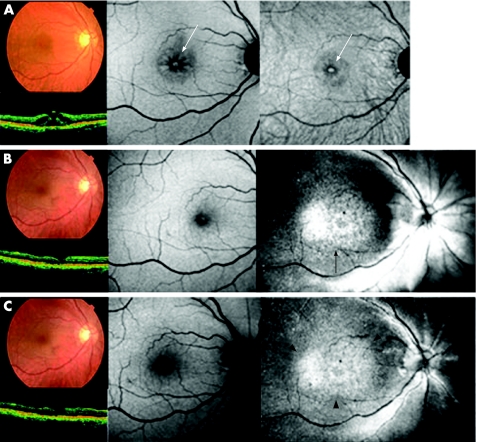
A MH was present on the fundus photographs and OCT images, preoperatively (fig 4, top left). Both autofluorescence images showed relatively dark spots around the MH, hyperfluorescence presumed to be in the MH bed, and standard autofluorescence image showed retinal cystic changes around the MH (fig 4, top centre and right, white arrow). Fundus photographs, OCT and autofluorescence images showed MH closure and no apparent degenerative changes at the RPE level 1 month after surgery (fig 4, middle left and centre). However, the ICG fluorescence signal persisted diffusely at the posterior pole (fig 4B, middle right, black arrows). This hyperfluorescence weakened but persisted 3 months after surgery (fig 4, bottom right, black arrowheads), with no apparent abnormality on the fundus photographs, OCT images and autofluorescence images (fig 4, bottom left and centre). The BCVA was unchanged after surgery in this case. Diffuse hyperfluorescence, probably at the RPE level, was observed only in this case.
Figure 4 Case 3. Fundus photograph, optical coherence tomography (OCT), and autofluorescence and indocyanine green (ICG) fluorescence images of a patient who underwent vitrectomy for a macular hole (MH) with ICG‐assisted internal limiting membrane (ILM) peeling at 1 month (top), 3 months (middle) and 6 months (bottom), postoperatively. (Top left) Fundus photograph shows MH closure after vitrectomy. (Top centre) Autofluorescence image shows faint foveal hyperfluorescence. (Top right) ICG hyperfluorescence is distributed diffusely at the posterior retina and there is hypofluorescence around the fovea (white arrowheads). Hyperfluorescent spots corresponding to the MH are also observed (white arrow), although the signal is not intense. (Middle left and centre) After 3 months, fundus photograph and OCT image show MH closure and autofluorescence image is unchanged. (Middle right) ICG hyperfluorescence migrates towards the optic nerve disc presumably along the nerve fibre layer (black arrows). The area of ILM peeling during surgery is clearly identified (black arrowheads). Dot hyperfluorescence along the artery near the optic nerve disc is present (white arrow). (Bottom left and centre) After 6 months, fundus photograph, OCT and autofluorescence image are unchanged. (Bottom right) Dot ICG hyperfluorescence is diffusely observed at the posterior retina resembling a stardust pattern. Most of the dot fluorescence is along the artery (black arrows). The area of ILM peeling is still identified clearly (black arrowheads).
Figure 5 shows the typical findings of ICG fluorescence among the 10 patients. We observed six distinct types of persistent ICG staining; diffuse hyperfluorescence at the posterior retina (fig 5, top left), hypofluorescence area at the macula, which was often different from that of ILM peeling (fig 5, top left, black arrows and bottom, white arrowheads), hyperfluorescence in the MH bed (fig 5, top right, white arrow), hyperfluorescence at the edge of the area from which the ILM was peeled (fig 5, bottom, black arrowheads), diffuse stardust‐like hyperfluorescence (fig 5, bottom) and accumulation of dots of hyperfluorescence along the retinal artery (fig 5, bottom, white arrows).
Figure 5 Case 6. Fundus photograph, optical coherence tomography (OCT), autofluorescence and indocyanine green (ICG) fluorescence images of a patient who underwent vitrectomy for a macular hole (MH) with ICG‐assisted internal limiting membrane (ILM) peeling at the time of surgery (top), 1 month (middle) and 3 months (bottom), postoperatively. (Top left) Fundus photograph and OCT image show a MH. (Top centre) Autofluorescence image shows hyperfluorescence in the MH bed and retinal cystic changes (white arrow). (Top right) No ICG signal is seen, although hyperfluorescence is detected in the MH bed (white arrow). (Middle left and centre) 1 month after surgery, fundus photograph and OCT image show MH closure and the foveal hyperfluorescence has resolved on the autofluorescence image. (Middle right) On the ICG fluorescence image, hyperfluorescence is detected in the posterior retina (black arrows), but without an area of hypofluorescence. The ICG pattern seems to be an accumulation of small fluorescent dots, and it may differ somewhat from cases 3 and 4.(Bottom left and centre) 3 months after surgery, fundus photograph, OCT and autofluorescence image are unchanged. (Bottom right) Dot fluorescence is unchanged and is still in the posterior retina (black arrowheads).
Discussion
Residual ICG dye remains in the eye for a long time after surgery; however, the processes of absorption and formation of the residual ICG patterns are not clear. Non‐axonal and axonal transport of ICG into the optic nerve disc has been reported.22,23 The ICG dye moved towards the optic disc nerve head over time during the current study, which is consistent with previous reports.
Typical findings were the hypofluorescence at the macula seen in a relatively early phase. The mechanism of this process is uncertain; however, we believe that this is related to ILM peeling. The stained ILM was removed during surgery before ICG permeated into the other retinal layers (ie, the NFL), and this might be observed as hypofluorescent spots. In the area in which the ILM was not peeled, the ICG might have reached the NFL, which was recognised as a hyperfluorescence signal. However, this hypothesis raises another question. The postoperative area of hypofluorescence often differed from that of the area from which the ILM was peeled (fig 5, bottom), a difference that was observed even in the very early phase after surgery. We presume that the residual ICG dye that reached the NFL began migrating along the nerve fibre immediately after surgery. HRA2 is not useful to observe residual ICG dye soon after surgery because of gas tamponade. It would be interesting to determine the kinetics of ICG a couple of days after MH surgery.
Other new typical findings were the dots of hyperfluorescence that appeared gradually in the middle or late phase, especially along the retinal artery. We believe that the hyperfluorescence, presumably at the NFL level, might be too intense to observe other fluorescence signals during the early phase, which is why the stardust‐like ICG signals were not seen in the early phase after surgery. We could not determine the source of the stardust fluorescence signal, but we assumed that it was at the level of the RPE and Bruch's membrane, because RPE cells phagocytose the ICG. ICG injected intravenously reportedly accumulated at the RPE–Bruch's membrane complex in the late stage.24 In addition, it is unknown whether intravitreal ICG penetrates the retina and reaches the RPE cells. The RPE cells in the MH bed did not typically emit the stardust ICG signals in the late phase, but emitted faint ICG signals in the early phase and no signals for the most part in the late phase. Thus, it is uncertain whether the RPE is the source of the stardust‐like hyperfluorescence. Other possible sources are the macrophages or the microglia, which can undergo phagocytosis.25 Future investigation is needed in this direction.
HRA2 enables us to observe the detailed kinetics of residual ICG after surgery, because the resolution and sensitivity of HRA2 are higher than a conventional ICG fundus camera.26 However, we must carefully evaluate the ICG signals, as we adjusted the parameters such as sensitivity and illumination simultaneously at every examination. Therefore, the ICG signal does not represent an absolute value, but represent a relative intensity. In addition, the images are not comparable. Unfortunately, we could not determine the relationship between the residual ICG pattern and the postoperative visual function. In this study, only one case had unchanged vision, and we observed an ICG fluorescence pattern that was different from other cases, while the autofluorescence images seemed normal. Therefore, further investigations are needed to determine the relationship between the residual ICG and the retinal function after surgery.
Abbreviations
BCVA - best‐corrected visual acuity
BSS - balanced salt solution
FA - fluorescein angiography
HRA2 - Heidelberg Retina Angiograph 2
ICG - indocyanine green
ILM - internal limiting membrane
MH - idiopathic macular hole
NFL - nerve fibre layer
OCT - optical coherence tomography
RPE - retinal pigment epithelium
TA - triamcinolone acetonide
Footnotes
Funding: This study was supported by grant No 16591750 from the Ministry of Education, Culture, Sports, Science, and Technology of Japan and a grant from Health and Labor Sciences Research of Japan.
Competing interests: None.
References
- 1.Kadonosono K, Itoh N, Uchio E.et al Staining of internal limiting membrane in macular hole surgery. Arch Ophthalmol 20001181116–1118. [DOI] [PubMed] [Google Scholar]
- 2.Da Mata A P, Burk S E, Riemann C D.et al Indocyanine green‐assisted peeling of the retinal internal limiting membrane during vitrectomy surgery for macular hole repair. Ophthalmology 20011081187–1192. [DOI] [PubMed] [Google Scholar]
- 3.Gandorfer A, Haritoglou C, Gass C A.et al Indocyanine green‐assisted peeling of the internal limiting membrane may cause retinal damage. Am J Ophthalmol 2001132431–433. [DOI] [PubMed] [Google Scholar]
- 4.Sakamoto T, Itaya K, Noda Y.et al Retinal pigment epithelial changes after indocyanine green‐assisted vitrectomy. Retina 200222794–796. [DOI] [PubMed] [Google Scholar]
- 5.Sippy B D, Engelbrecht N E, Hubbard G B.et al Retinal pigment epithelial changes after macular hole surgery with indocyanine green‐assisted internal limiting membrane peeling. Am J Ophthalmol 200213389–94. [DOI] [PubMed] [Google Scholar]
- 6.Engelbrecht Ne, Freeman J, Sternberg P.et al Retinal pigment epithelial changes after macular hole surgery with indocyanine green‐assisted internal limiting membrane peeling. Am J Ophthalmol 200213389–94. [DOI] [PubMed] [Google Scholar]
- 7.Chang A A, Zhu M, Billson F. The interaction of indocyanine green with human retinal pigment epithelium. Invest Ophthalmol Vis Sci 2005461463–1467. [DOI] [PubMed] [Google Scholar]
- 8.Haritoglou C, Gandorfer A, Gass C A.et al Indocyanine green‐assisted peeling of the internal limiting membrane in macular hole surgery affects visual outcome: a clinicopathologic correlation. Am J Ophthalmol 2002134836–841. [DOI] [PubMed] [Google Scholar]
- 9.Horio N, Horiguchi H. Effect on visual outcome after macular hole surgery when staining the internal limiting membrane with indocyanine green dye. Arch Ophthalmol 2004122992–996. [DOI] [PubMed] [Google Scholar]
- 10.Ando F, Sasano K, Ohba N.et al Anatomic and visual outcomes after indocyanine green‐assisted peeling of the retinal internal limiting membrane in idiopathic macular hole surgery. Am J Ophthalmol 2004137609–614. [DOI] [PubMed] [Google Scholar]
- 11.Kanda S, Uemura A, Yamashita T.et al Visual field defects after intravitreous administration of indocyanine green in macular hole surgery. Arch Ophthalmol 20041221447–1451. [DOI] [PubMed] [Google Scholar]
- 12.Uemura A, Kanda S, Sakamoto Y.et al Visual field defects after uneventful vitrectomy for epiretinal membrane with indocyanine green‐assisted internal limiting membrane peeling. Am J Ophthalmol 2003136252–257. [DOI] [PubMed] [Google Scholar]
- 13.Weinbergerb A W, Kirchhof B, Mazinani B E.et al Persistent indocyanine green (ICG) fluorescence 6 weeks after intraocular ICG administration for macular hole surgery. Graefes Arch Clin Exp Ophthalmol 2001239388–390. [DOI] [PubMed] [Google Scholar]
- 14.Tadayoni R, Paques M, Girmens J F.et al Persistence of fundus fluorescence after use of indocyanine green for macular surgery. Ophthalmology 2003110604–608. [DOI] [PubMed] [Google Scholar]
- 15.Hirata A, Inomata Y, Kawaji T.et al Persistent subretinal indocyanine green induces retinal pigment epithelium atrophy. Am J Ophthalmol 2003136353–355. [DOI] [PubMed] [Google Scholar]
- 16.Ciardella A P, Schiff W, Barile G.et al Persistent indocyanine green fluorescence after vitrectomy for macular hole. Am J Ophthalmol 2003136174–177. [DOI] [PubMed] [Google Scholar]
- 17.Kersey T L, Bolton A, Patel C K. Serial autofluorescence imaging over two years following indocyanine green‐assisted internal limiting membrane peel for macular hole. Clin Experiment Ophthalmol 200533538–539. [DOI] [PubMed] [Google Scholar]
- 18.Kimura H, Kuroda S, Nagata M. Triamcinolone acetonide‐assisted peeling of the internal limiting membrane. Am J Ophthalmol 2004137172–173. [DOI] [PubMed] [Google Scholar]
- 19.Horiguchi M, Miyake K, Ohta I.et al Staining of the lens capsule for circular continuous capsulorrhexis in eyes with white cataract. Arch Ophthalmol 1998116535–537. [DOI] [PubMed] [Google Scholar]
- 20.Burk S E, Da Mata A P, Snyder M E.et al Indocyanine green‐assisted peeling of the retinal internal limiting membrane. Ophthalmology 20001072010–2014. [DOI] [PubMed] [Google Scholar]
- 21.Nishimura A, Kobayashi A, Segawa Y.et al Isolating triamcinolone acetonide particles for intravitreal use with a porous membrane filter. Retina 200323777–779. [DOI] [PubMed] [Google Scholar]
- 22.Cekic O, Morimoto T, Ohji M.et al Nonaxoplasmic transfer of indocyanine green into the optic nerve after intravitreal application. Retina 200424412–415. [DOI] [PubMed] [Google Scholar]
- 23.Paques M, Genevois O, Regnier A.et al Axon‐tracing properties of indocyanine green. Arch Ophthalmol 2003121367–370. [DOI] [PubMed] [Google Scholar]
- 24.Chang A A, Morse L S, Hand J T.et al Histologic localization of indocyanine green dye in aging primate and human ocular tissues with clinical angiographic correlation. Ophthalmology 19981051060–1068. [DOI] [PubMed] [Google Scholar]
- 25.Chen L, Yang P, Kijlsta A. Distribution, makers, and function of retinal microglia. Ocul Immunol Inflamm 20021027–39. [DOI] [PubMed] [Google Scholar]
- 26.Holz F G, Bellmann C, Rohrschneider K.et al Simultaneous confocal scanning laser fluorescein and indocyanine green angiography. Am J Ophthalmol 1998125227–236. [DOI] [PubMed] [Google Scholar]


