

Abstract
CXCR4 regulates hematopoietic and tumor cell homing to bone, but its role during osteoclast (OC) development is unknown. We investigated the role of CXCR4 in osteoclastogenesis and in a model of bone metastasis. Compared with controls, mice reconstituted with CXCR4 null hematopoietic cells exhibited elevated markers of bone resorption, increased OC perimeter along bone, and increased bone loss. CXCR4−/− OCs demonstrated accelerated differentiation and enhanced bone resorption in vitro. Furthermore, tumor growth specifically in bone was significantly increased in mice reconstituted with CXCR4−/− hematopoietic cells. Finally, enhancement of bone tumor growth in the absence of CXCR4 was abrogated with the OC inhibitor, zoledronic acid. These data demonstrate that disruption of CXCR4 enhances osteoclastogenesis and suggest that inhibition of CXCR4 may enhance established skeletal tumor burden by increasing OC activity.
Keywords: bone metastasis, osteoclast
Bone metastases are a significant cause of morbidity, causing pain, pathologic fractures, spinal cord compression, and hypercalcemia (1). Tumor cells that reach the bone marrow (BM) can stimulate one or both types of cells involved in bone remodeling, namely osteoblasts (stromal cell origin) or osteoclasts (OCs) (hematopoietic cell lineage), leading to new bone formation and osteoblastic lesions or bone loss and osteolytic lesions, respectively. OC resorption releases bone matrix-derived growth factors that can enhance local tumor growth (1–3). Disruption of OC resorption can decrease tumor growth in bone (3), and we have recently shown that pharmacologic enhancement of OC activity with granulocyte-colony stimulating factor increases tumor growth in bone in mice (4).
CXCR4 is a seven-transmembrane G protein-coupled receptor expressed by many cell types, including hematopoietic, endothelial, stromal, and neuronal cells (5). Stromal cell-derived factor-1 (SDF-1) (or CXCL12) is the only known ligand for CXCR4 and is produced by multiple BM cell types, including stromal cells, osteoblasts, and OCs (6–8). CXCR4/SDF-1 are critical molecules in the process of hematopoietic stem cell (HSC) homing to and egress from the BM (9, 10). Gene-targeted disruptions of CXCR4 and SDF-1 are embryonic lethal, but examination of late-stage embryos reveal diminished HSC homing to the fetal BM (11–13). Additionally, inhibitors of either SDF-1 or CXCR4 have been shown to impair BM engraftment in transplant models (5). Small molecule inhibitors of CXCR4 mobilize HSCs and progenitor cells from the BM into the peripheral blood. Clinical trials are underway using CXCR4 inhibitors to mobilize and collect HSCs/hematopoietic progenitor cells from the peripheral blood in preparation for stem cell transplantation for malignant BM diseases (14).
Signaling through CXCR4 has been shown to have both stimulatory and inhibitory roles on various hematopoietic cells, including promoting survival and proliferation of HSCs (5), inducing apoptosis in T cells (15), or causing quiescence in neural progenitors (16). The signaling pathways activated depend on the cell type and physiologic context (17). CXCR4 is expressed on macrophages, the hematopoietic precursor of the OC (7), and OCs can migrate toward SDF-1 gradients (18) but CXCR4's role during osteoclastogenesis is not well established.
Recently, attention has been given to the role of CXCR4 in tumor biology and metastasis to bone and other SDF-1-rich organs. Disruption of tumor-derived CXCR4 can decrease the invasiveness of a number of different cancer cell lines in vitro (19) and diminishes lung and bone metastases in vivo (20) (21). Conversely, overexpressing CXCR4 in tumor cells promotes bone metastasis in mice (22).
We examined the role of host CXCR4 in OC function and bone metastasis. Because of the embryonic lethality of global CXCR4 disruption, we generated CXCR4−/− and WT mice by performing fetal liver transplants in lethally irradiated WT mice. Loss of CXCR4 enhanced osteoclastogenesis in vitro and in vivo and increased precursor proliferation and differentiation. Bone but not lung and s.c. tumor growth was significantly enhanced in CXCR4−/− mice compared with WT controls. Enhancement of tumor growth in bone in CXCR4−/− mice was abrogated with the OC inhibitor, zoledronic acid. These data demonstrate that disruption of CXCR4 enhances osteoclastogenesis and suggest that inhibition of CXCR4 may enhance established skeletal tumor burden by increasing OC activity.
Results
Genetic Disruption of CXCR4 Results in Increased Bone Resorption and Increased OC Numbers in Vivo.
CXCR4 hematopoietic null (CXCR4−/−) and WT (WT-CXCR4+/+) control mice were generated via fetal liver transplant. Flow cytometry of BM macrophages (BMMs) stained for Mac-1 (CD11b) and CXCR4 confirmed the expression or absence of CXCR4 in the macrophage (OC precursor) population in transplanted animals (Fig. 1A).
Fig. 1.

Genetic disruption of CXCR4 results in increased bone resorption and increased OC numbers in vivo. (A) Double staining for Mac-1 (CD11b) and CXCR4 confirmed the lack of expression of CXCR4 in moncytes derived from CXCR4−/− animals. (B) OC activity measured by serum TRAP 5b (Left) and serum CTX (Right) levels 5 weeks after transplant. * for TRAP 5b P = 0.003, two-tailed t test, n = 4 WT, n = 4 CXCR4−/−; * for CTX P < 0.0005, two-tailed t test, n = 3 WT, n = 3 CXCR4−/−. (C) Histomorphometric analysis of the tibial trabecular bone volume/total volume (BV/TV) (*, P < 0.002, two-tailed t test, n = 8 WT, n = 8 CXCR4−/−). (D) Histomorphometric analysis of the tibial OC perimeter along bone perimeter (*, P < 0.0005, two-tailed t test, n = 8 WT, n = 8 CXCR4−/−). (E) Primary BMM from CXCR4−/− and WT transplanted mice were cultured in the presence of M-CSF and RANKL. A colorimetric assay was used to determine levels of TRAP activity (*, P = 0.3 day 2, P = 0.0008 day 3, P = 0.02 day 4, two-tailed t test; samples run in triplicate). (F) Representative images of cultured macrophages and OCs. (Scale bars: 120 μm.)
Five weeks after transplantation, we measured serum tartrate-resistant acid phosphatase (TRAP) 5b, an enzyme specific to OCs, which correlates with OC number (23), and observed a 20% increase in serum TRAP 5b in CXCR4−/− mice compared with WT controls (Fig. 1B). CXCR4−/− mice had elevated serum carboxyl-terminal collagen cross-links (CTX), a marker of bone collagen degradation indicative of increased OC resorption, compared with WT controls (Fig. 1B). Histomorphometric analyses of tibias from transplanted animals revealed a 2-fold decrease in trabecular bone area (Fig. 1C) and a 2-fold increase in OC perimeter (Fig. 1D) in CXCR4−/− mice compared with WT controls. Taken together, these data suggest that loss of hematopoietic CXCR4 enhances OC formation and activity in vivo.
Loss of CXCR4 Leads to Cell Autonomous Enhancement of OC Formation and Resorption in Vitro.
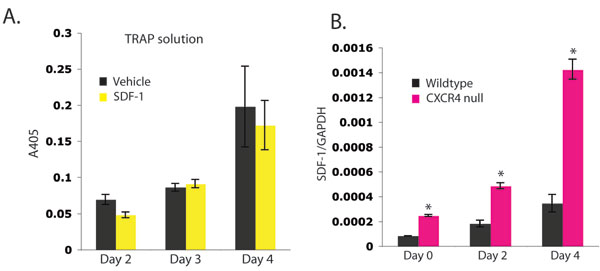
CXCR4 hematopoietic null and WT BMMs were plated in osteoclastogenic media containing macrophage colony-stimulating factor (M-CSF) and receptor activator of NF-κB ligand (RANKL). CXCR4−/− BMM formed mature OCs earlier than WT macrophages and produced increased levels of OC resorptive protein, TRAP, in vitro (Fig. 1 D and E). Interestingly, exogenous SDF-1 administration to WT BMM cultured with M-CSF and RANKL did not alter OC formation or TRAP protein levels [supporting information (SI) Fig. 6A]. However, we did find that SDF-1 was expressed by murine WT and CXCR4−/− cultured macrophages and OCs by RT-PCR (SI Fig. 6B), as has been observed in human macrophages (7), which could account for the lack of OC formation effects of additional exogenous effects of SDF-1. Furthermore, the CXCR4−/− macrophages had a significant increase in SDF-1 mRNA compared with WT cells consistent with a cell autonomous feedback mechanism (SI Fig. 6B).
To account for potential differences in HSC homing to bone marrow, fetal liver-derived macrophages (FLMs) from both WT and CXCR4−/−, embryos were directly cultured in M-CSF and RANKL. CXCR4−/− fetal liver-derived OCs produced increased numbers of OCs (Fig. 2 A and B) with 30% increase in nuclei number (Fig. 2C) compared with WT cells. When cultured on bone, CXCR4−/− OCs produced a 3-fold increase in bone resorption pit area compared with WT cells (Fig. 2D). These data suggest that loss of CXCR4 enhances OC formation and activity from both BMMs and FLMs.
Fig. 2.

Loss of CXCR4 leads to cell autonomous enhancement of OC formation and resorption in vitro. (A) Representative images of cultured FLM and OCs. (Scale bars: 120 μm.) (B) OC number from day 3 quantitated. *, P = 0.048, two-tailed t test. (C) Number of OC nuclei per cell quantitated for each genotype. *, P = 0.04 days 3 and 4, two-tailed t test. (D) Quantitation of pit area after culture of FLM on bone slices (day 4). *, P = 0.002, two-tailed t test.
CXCR4−/− Macrophages Demonstrate Increased Proliferation and Accelerated OC Differentiation.
One explanation for increased OC formation in CXCR4−/− cells could be through enhanced proliferation of OC precursors, because SDF-1 has been shown to reduce the proliferation of neural stem cells (16). CXCR4−/− FLMs demonstrated a 2-fold increase in proliferation compared with WT FLM (Fig. 3A). We next evaluated whether the increased osteoclastogenesis in CXCR4−/− cells could be caused by a prolonged OC lifespan, because SDF-1 can induce T cell apoptosis in certain situations (15). OCs are terminally differentiated cells that undergo apoptosis after maturation. No differences in apoptosis, as measured by histone-associated DNA fragments, were observed between CXCR4−/− and WT mature OC cultures (Fig. 3B). Taken together, these data suggest that CXCR4 signaling inhibits macrophage proliferation, but does not affect apoptosis in mature OCs.
Fig. 3.

CXCR4−/− macrophages demonstrate increased proliferation and accelerated OC differentiation. (A) BrdU incorporation was measured in FLM from CXCR4−/− and WT cells. *, P = 0.03, two-tailed t test. (B) DNA fragmentation was measured from day-5 and -6 OC cultures from CXCR4−/− and WT cells. P = 0.64 day 5 and P = 0.34 day 6, two-tailed t test. (C) CXCR4 mRNA levels decreased as WT macrophages differentiated into OCs. Levels of TRAP and Cathepsin K were elevated in CXCR4−/− fetal liver-derived pre-OCs and OCs compared with WT (P < 0.005 day 2 and day 4 TRAP levels, P = 0.02 day 4 Cathepsin K levels; two-tailed t test). (D) Actin ring formation was evaluated in CXCR4−/− (Lower) and WT (Upper) FLM plated on bone in M-CSF and RANKL in triplicate. Representative images of cultures from days 3 (Left), 5 (Center), and 7 (Right) are shown. (Scale bars: 120 μm.)
Because CXCR4 null macrophages generated OCs earlier than WT macrophages, we examined mRNA levels of TRAP and Cathepsin K, two markers of OC differentiation, by real-time PCR at different time points during differentiation. CXCR4−/− pre-OCs (day 2) and OCs (day 4) demonstrated a >2-fold increase in levels of TRAP and Cathepsin K compared with WT cells (Fig. 3C). Levels of CXCR4 mRNA decrease as WT murine macrophages mature into OCs (Fig. 3C), and as expected there were no detectable levels of CXCR4 in the CXCR4−/− FLMs and OCs (Fig. 3C). We next examined the formation of the actin ring, a characteristic of mature OCs cultured on bone. CXCR4−/− cells formed mature actin rings earlier than their WT counterparts (Fig. 3D), again suggesting accelerated differentiation in the CXCR4−/− cells.
Genetic Disruption of Host CXCR4 Leads to Increased Osteolytic Tumor Growth in Bone in Vivo.
Because CXCR4−/− mice demonstrated increased OC activity, we hypothesized that CXCR4−/− mice would have increased tumor growth in bone because increases in OC activity are known to enhance tumor growth in bone (1, 4). Three weeks after hematopoietic cell reconstitution with CXCR4 or WT fetal liver cells, 105 osteolytic B16 syngeneic mouse melanoma firefly luciferase (FL)-labeled cells (B16-FL) that do not express CXCR4 (SI Fig. 7A) were inoculated into the arterial system by left ventricular (LV) injection. In vivo bioluminescence imaging demonstrated a >2-fold increase in tumor burden in bone in CXCR4−/− compared with WT controls at all time points examined. Furthermore, the slope of the line for tumor growth in the CXCR4−/− setting (slope = 60) was three times higher than that for the WT setting (slope = 20), consistent with an increased rate of tumor growth in CXCR4−/− bones (Fig. 4 A and G). Histomorphometric analysis of the bones of CXCR4−/− mice demonstrated increased tumor area and a >2-fold decrease in trabecular bone volume compared with WT controls (Fig. 4 B–D). There were no significant differences in serum SDF-1 levels within the BM of WT and CXCR4−/− (SI Fig. 7B) mice, and the B16-FL tumor cells did not express CXCR4 (SI Fig. 7A). Thus, it is unlikely that the increase in tumor burden in CXCR4−/− bones was caused by differences in CXCR4-mediated homing of tumor cells. Taken together, these data suggest that disruption of CXCR4 in the host hematopoietic compartment creates an environment favoring enhanced tumor growth in bone.
Fig. 4.

Tumor growth is increased in bone but not in lung or s.c. tissue of CXCR4−/− mice. (A) In vivo bioluminescence imaging after LV injection of B16-FL cells. Photon flux was quantitated in fixed region of interest (ROI) in the tibia/femur bones. *, P < 0.008 at all time points, two-tailed t test; n = 11 WT, n = 12 CXCR4−/−. (B) Histomorphometric analysis of tumor area/total area from tibial bones. *, P = 0.006; two-tailed t test. (C) Representative images of tibial bone sections (T = tumor). (Scale bars: 150 μm.) (D) Trabecular bone volume/total volume (BV/TV) measured from tibial bones. *, P = 0.0003, two-tailed t test. (E) In vivo bioluminescence imaging after s.c. injection of B16-FL. Photon flux was quantitated in fixed ROI in the dorsal tumors. P = 0.1 day 5, P = 0.5 day 7, P = 0.6 day 10, P = 0.4 day 14, two-tailed t test; n = 5 WT, n = 5 CXCR4−/−). (F) In vivo bioluminescence imaging after i.v. injection of B16-FL. Photon flux was quantitated in fixed ROI in the lung area. P = 0.8 day 7, P = 0.7 day 9, P = 0.4 day 12, P = 0.1 day 16, two-tailed t test; n = 5 WT, n = 5 CXCR4−/−. (G) Representative images of WT (Left) vs. CXCR4−/− (Right) mice on the final day of imaging from each tumor experiment. (Top) Day 12 LV. (Middle) Day 14 s.c. (Bottom) Day 16 i.v.
Genetic Disruption of CXCR4 Does Not Affect Tumor Growth in the Subcutaneous Compartment or the Lungs.
To determine whether or not the enhanced tumor growth seen in the CXCR4 hematopoietic null setting was bone-specific, B16-FL cells were inoculated s.c. or i.v. into mice of each genotype. In vivo bioluminescence imaging of B16-FL SC tumors demonstrated no differences in tumor burden between WT controls and CXCR4−/− (Fig. 4 E and G). In vivo bioluminescence imaging to monitor the occurrence of lung metastases after B16-FL i.v. injection demonstrated no difference in lung tumor burden between WT controls and CXCR4−/− mice (Fig. 4 F and G). These data suggest that the increased tumor growth seen in the bone metastasis model was not seen in s.c. tumors or lung metastases.
Zoledronic Acid Prevents the Enhancement of Tumor Growth in Bone in CXCR4−/− Mice.
To examine whether the increased tumor growth in bone in CXCR4−/− mice was related to enhanced OC activity, we pretreated a cohort of CXCR4−/− mice with the OC inhibitor, zoledronic acid, before tumor inoculation. The bisphosphonate, zoledronic acid, has been shown to disrupt OC function in vivo and in vitro and block tumor-associated bone loss in mice and humans (1, 24). Tumor growth in bone in the CXCR4−/− mice treated with zoledronic acid was similar to WT controls; whereas tumor growth in bone was significantly increased at all time points evaluated in the vehicle-treated CXCR4−/− mice (Fig. 5A). Histomorphometric analysis confirmed decreased tumor area in the bones of CXCR4−/− mice treated with zoledronic acid compared with saline controls (Fig. 5 B–D). These data suggest that the enhanced tumor growth in bone observed in the CXCR4−/− mice can be disrupted by zoledronic acid.
Fig. 5.

Zoledronic acid prevents the enhancement of tumor growth in bone in CXCR4−/− mice. (A) In vivo bioluminescence imaging was performed, and photon flux was quantitated in fixed ROI in the bone area on days 8, 10, and 12. CXCR4−/−animals given vehicle displayed increased tumor burden compared with WT transplanted animals, whereas CXCR4−/− animals treated with zoledronic acid showed equivalent tumor burden to WT mice. P = 0.0031 CXCR4−/− +PBS vs. WT +PBS; P = 0.54 CXCR4−/− + zoledronic acid vs. WT. n = 5 in each group. (B) Histomorphometric analysis of tumor area/total area from tibial bones (*, P = 0.0002, two-tailed t test) and increased tumor burden in PBS-treated CXCR4−/− mice compared with WT controls (P = 0.01, two-tailed t test). (C) Representative images of tibial bone sections stained for TRAP. (Left) WT. (Center) CXCR4−/−. (Right) CXCR4−/− + zoledronic acid. M, marrow; T, tumor.
Discussion
We have demonstrated that genetic disruption of CXCR4 increases markers of OC number and function in vivo. Additionally, loss of CXCR4 leads to enhanced OC formation and function in both BMs and FLMs in vitro in a cell-autonomous manner. These findings suggest that disruption of CXCR4 enhances osteoclastogenesis.
Because of the BM homing defects observed in CXCR4−/− HSCs (5, 9, 10), we anticipated decreased BM OCs. However, we found that mice reconstituted with CXCR4−/− HSCs from fetal liver developed increased OC perimeter, serum TRAP 5b, serum CTX, and decreased trabecular bone volume compared with WT controls. We also found that SDF-1 levels in the BM of WT and CXCR4−/− mice were equivalent, despite the increased levels of SDF-1 seen in CXCR4−/− macrophages and OCs in vitro. This finding is likely because most SDF-1 in the BM is produced by osteoblasts and stromal cells, which are WT in origin in both WT and CXCR4−/− hematopoietic transplant animals. These data also suggest that altered levels of the homing chemokine SDF-1 were not likely responsible for the increased numbers of OCs observed in CXCR4−/− mice.
Mechanistically, the increased osteoclastogenesis seen in the CXCR4−/− background could be explained by enhanced proliferation and/or accelerated differentiation of macrophages. Loss of CXCR4 resulted in increased proliferation of OC precursor macrophages, which correlates with data from other groups (16). The addition of exogenous SDF-1 to WT macrophages did not effect OC formation or activity in our hands, and we found that murine BMMs and OCs express endogenous SDF-1 (SI Fig. 6). It has been reported that SDF-1 when given exogenously promotes human OC migration and activity (18, 25), but no dramatic alterations in numbers of OCs have been reported. We have shown that murine macrophages and OCs express endogenous SDF-1, which may explain why we do not see effects of exogenous SDF-1 on OC development. Additionally, recent evidence suggests that SDF-1 binds to at least one receptor other than CXCR4, namely, CXCR7 (26, 27). Although we did not find CXCR7 to be expressed on macrophages or OCs in our model, it is possible that SDF-1 binds to yet another receptor and that the previously reported effects of SDF-1 on OC function are a result of signaling through a receptor other than CXCR4. Furthermore, it is also possible that CXCR4 may signal via a ligand other than SDF-1.
The observed increase in OC markers in CXCR4−/− pre-OCs (D2) and OCs (D4) suggest that macrophage differentiation into OCs may be accelerated in the absence of CXCR4. Several groups (28–32) have shown that signaling through p38 is important for OC differentiation. We found that phosphorylation of p38 was modestly increased in the CXCR4−/− macrophages (data not shown). CXCR4 is linked to GαI and diminishes PKA activation via inhibition of adenyl cyclase. PKA phosphorylates TAK-1, a MAPKKK upstream of p38 (33). Thus, it is possible that CXCR4 leads to decreased activation of p38 MAPK in some instances.
OC activity can enhance tumor cell growth within bone (1, 4, 34, 35). Consistent with previous data demonstrating the enhancing effects of osteoclastic bone resorption on tumor growth in bone, we found that loss of CXCR4 on HSCs resulted in enhanced tumor growth within bone but not the lungs or s.c. tissues of CXCR4−/− animals. Although the observed increase in tumor burden could potentially be explained by a global immune defect, as CXCR4 has been shown to play an important role in the function of other hematopoietic cells, including T and B cells (36), the tissue-specific increase in tumor burden seen here makes this explanation less likely. Recently, Jones et al. (37) concluded that B16 tumor cells could induce bone loss independent of OC activity despite numerous reports that tumor cells require OCs to induce osteolysis (38). We have previously shown that the clone of B16 cells labeled with luciferase used in these experiments does not induce bone loss in OC-defective mice (39), suggesting that bone destruction seen in this B16-FL model is not likely mediated directly by tumor cells.
Several groups (20, 21, 40, 41) have shown that short-term pharmacologic inhibition of CXCR4 in systems where tumor cells express CXCR4 results in decreased tumor burden; however, it is not clear whether the decrease in metastasis and tumor growth was secondary to direct anti-tumor effects or homing. Effects on OC resorption were not reported. Evaluation of CXCR4 inhibitors in patients with cancer is under consideration (2) and will likely involve chronic, long-term administration of CXCR4 inhibitors to prevent ongoing metastasis and decrease tumor growth of CXCR4-positive tumors. In our genetic model, we have shown that disruption of host hematopoietic CXCR4 results in enhanced tumor growth within the skeleton.
There is increasing evidence that cancer therapies have detrimental effects on skeletal health (42). We have recently shown that granulocyte colony-stimulating factor, a growth factor commonly used to support chemotherapy can enhance osteoclastogenesis and increase tumor growth in bone in mice (4). Likewise, tumors that produce granulocyte-macrophage colony-stimulating factor have enhanced OC recruitment and tumor growth in bone in mice (43). We found that disruption of CXCR4 on murine hematopoietic cells enhanced tumor burden in bone in part through its effect on OCs; therefore, monitoring of skeletal health should be evaluated with the clinical use of CXCR4 inhibitors, particularly in patients with bone metastases.
Methods
Cells.
B16-FL cells have been described (4).
Animals.
C57BL/6 mice were obtained from Harlan Laboratories (Indianapolis, IN). CXCR4+/− breeding pairs were obtained from Jackson Laboratory (Bar Harbor, ME). Mice were housed according to the guidelines of the Division of Comparative Medicine, Washington University School of Medicine, and the animal ethics committee approved all experiments.
Fetal Liver Transplantation.
Fetal livers were harvested from embryonic day 14–16 embryos generated by setting up timed pregnancies between CXCR4+/− mice. Single-cell suspensions were frozen in RPMI medium 1640 with 20% FCS and 20% DMSO (Sigma, St Louis, MO). A portion of the embryo was saved to determine genotype by PCR. Five-week-old C57BL/6 recipients were lethally irradiated by using a 137Cs source with 900 rads. Single-cell suspensions of 106 CXCR4−/− or WT thawed fetal liver cells were injected into the lateral tail vein of each recipient mouse to generate CXCR4−/− mice and WT controls.
Serum CTX Assay.
CTX was measured from WT or CXCR4−/− mouse fasting serum by using a CTX ELISA system (Nordic Bioscience Diagnostics, Herlev, Denmark).
Serum TRAP 5b Assay.
TRAP 5b was measured in WT or CXCR4−/− mouse serum by using a TRAP 5b ELISA system (IDS, Fountain Hills, AZ).
Bone Histomorphometry.
Bone volume/total volume, OC perimeter/bone perimeter, and tumor area were measured according to a standard protocol using Bioquant Osteo blinded to genotype (Bioquant Image Analysis, Nashville, TN) (4, 44).
In Vivo Bioluminescence Imaging and Analysis.
Tumor imaging was performed with a CCD camera (IVIS 100; Xenogen, Alameda, CA) as described (4).
LV or Intraarterial Bone Metastasis Model.
Mice were anesthetized and inoculated intraarterially in the left cardiac ventricle (operators were blinded to genotype) with 105 B16-FL cells as described (4, 39). In vivo bioluminescence imaging was performed on days 8, 10, and 12 at which point mice were killed.
Drug Administration.
A 0.75-μg s.c. dose of zoledronic acid or vehicle was given 10 and 3 days before LV tumor injection.
Subcutaneous Tumor Injections.
A total of 105 B16-FL cells were injected s.c. on the dorsal surface of anesthetized mice (blinded to genotype) and imaged on days 5, 7, 10, and 14.
Intravenous Bone Metastasis Model.
A total of 2 × 10⁵ B16-FL cells in 200 μl of PBS were injected into the lateral tail vein of mice by operators blinded to genotype and imaged on days 7, 9, 12, and 16.
Image Acquisition.
Images of cells and isolated tibias were taken with an Eclipse TE300 inverted microscope (Nikon, Tokyo, Japan) connected to a Magnafire camera model S99802 (Optronics, Goleta, CA) using the ×4 Nikon lens (N.A. 0.13) or ×10 Nikon lens (N.A. 0.30).
OC Formation Assays.
Primary BMMs or primary FLMs were generated as described using whole BM extracted from femurs and tibias of transplanted C57BL/6 mice (3–6 weeks after transplantation) or directly from fetal livers. Cultured OCs were generated from BMM or FLM plated at 5 × 10⁵ per ml in α-MEM containing 10% FCS, CMG-14-12 supernatant (1/20 vol), and GST-RANKL (100 ng/ml) and incubated at 37°C in 6% CO2, 94% room air for 5 days as described (4, 45). TRAP staining was performed according to the manufacturer's instructions (Sigma). A quantitative TRAP solution assay (modified from ref. 46) was performed as described (4).
Bone Resorption Assays.
Bone resorption assays were performed as described (47). Pit area was determined from five ×4 fields by using Osteo software (Bioquant, Nashville, TN) blinded to genotype.
Actin Ring Formation Assays.
Actin ring formation assays were performed as described (48).
Flow Cytometry.
Whole BM was harvested from CXCR4−/− mice and WT controls and incubated in blocking media [2.4G2 hybridoma (HB-197; American Type Culture Collection, Manassas, VA)] with 5 μl of MsIgG (Beckman Coulter, Miami, FL), then incubated with FITC-conjugated anti-mouse CD11b (Mac-1; eBioscience, San Diego, CA) and biotinylated rat anti-mouse CD184 (CXCR4) (BD PharMingen, La Jolla, CA) for 25 min on ice and then washed and incubated with phycoerythrin streptavidin (eBioscience) for 15 min on ice, then washed and analyzed on a FACScan Flow Cytometer (BD Biosciences, San Jose, CA).
Reverse Transcription and Real-Time PCR.
Total RNA from primary BMM, FLM, and OCs were isolated with the RNeasy mini kit (Qiagen, Valencia, CA) and digested with DNase to eliminate genomic DNA. Complementary DNA was made by using the SuperScript first-strand synthesis system for RT-PCR (Invitrogen, Carlsbad, CA). Semiquantitative PCR was performed with mouse-specific primers for CXCR4. Sequences for CXCR4 were: forward, TAGGATCTTCCTGCCCACCAT; reverse, TGACCAGGATCACCAATCCA; Real-time PCR was performed with mouse-specific primers using iQ SYBR Green Supermix (Bio-Rad, Hercules, CA) on the Bio-Rad i-cycler. Mouse-specific primers for CXCR4 and SDF-1 were purchased from Superarray Bioscience. TRAP, Cathepsin K (Ctsk), and GAPDH were ordered from IDT, Coralville, IA). Sequences were: GAPDH, forward TCAACAGCAACTCCCACTCTTCCA, reverse ACCCTGTTGCTGTAGCCGTATTCA; Ctsk, forward AGGCAGCTAAATGCAGAGGGTACA, reverse AGCTTGCATCGATGGACACAGAGA; and TRAP, forward CGTCTCTGCACAGATTGCAT, reverse AAGCGCAAACGGTAGTAAGG.
Proliferation Assays.
FLMs (104) plated in 96-well Costar assay plates (black plate, clear bottom with lid; Corning, Corning, NY) were starved in α-MEM containing 0.1% FCS for 12 h. Then, α-MEM containing 100 ng/ml recombinant M-CSF (R&D Systems, Minneapolis, MN) and BrdU were added, cells were labeled for 24 h, and proliferation was measured by using the chemiluminescent cell proliferation ELISA from Roche Diagnostics (Mannheim, Germany).
OC Apoptosis Assay.
A total of 5 × 10⁴ FLM were plated in osteoclastogenic media in 96-well plates for 5 or 6 days to generate OCs. Cell death was measured by cell death detection ELISA (Roche Diagnostics, Penzberg, Germany) in quadruplicate.
SDF-1 BM Serum ELISA.
Femurs and tibias from each leg of WT and CXCR4−/− mice were flushed repeatedly with 500 μl of PBS, then spun at 2,000 × g, the supernatant was saved, and murine SDF-1 α levels were quantitated with an ELISA kit (R&D Systems).
Statistical Analysis.
For experiments that involved more than two groups being compared, we used mixed repeated measures linear modeling with nonorthogonal contrasts to test hypotheses of differences between treatment groups and interactions between time and treatment groups with using SAS version 9 statistical software (SAS, Cary, NC). All other experiments were analyzed with Student's t test. In calculating two-tailed significance levels for equality of means, equal variances were assumed for the two populations.
Supplementary Material
Acknowledgments
We thank Dr. Steven Teitelbaum, Dr. Paddy Ross, Dr. David Gutmann, Dr. Dan Link, Anthony Apicelli, and Valarie Salazar for helpful discussions; Stephanie Becker and Ivana Rosova for technical assistance; and Kathryn Trinkaus in the Division of Biostatistics at Washington University for statistical analysis. A.C.H. was supported by National Institutes of Health Hematology Training Grant T32 HL007088. K.N.W. was supported by National Institutes of Health Grant R01 CA097250. O.U. was supported by National Institutes of Health Cancer Biology Training Grant T32 CA09547. M.C.E. was supported by National Institutes of Health Grant R01 CA097250. E.A.M. was supported by National Institutes of Health Medical Scientist Training Program Training Grant T32 GM7200. J.L.P. and D.P.-W. were supported by National Institutes of Health Molecular Imaging Center Grant P50 CA94056.
Abbreviations
- OC
osteoclast
- RANKL
receptor activator of NF-κB ligand
- SDF-1
stromal cell-derived factor-1
- FL
firefly luciferase
- ROI
region of interest
- TRAP
tartrate-resistant acid phosphatase
- BM
bone marrow
- BMM
BM macrophage
- FLM
fetal liver macrophage
- HSC
hematopoietic stem cell
- CTX
carboxyl-terminal collagen cross-links
- M-CSF
macrophage colony-stimulating factor
- LV
left ventricular/ventricule.
Footnotes
The authors declare no conflict of interest.
This article is a PNAS Direct Submission.
This article contains supporting information online at www.pnas.org/cgi/content/full/0705203104/DC1.
References
- 1.Mundy GR. Nat Rev Cancer. 2002;2:584–593. doi: 10.1038/nrc867. [DOI] [PubMed] [Google Scholar]
- 2.Kozlow W, Guise TA. J Mammary Gland Biol Neoplasia. 2005;10:169–180. doi: 10.1007/s10911-005-5399-8. [DOI] [PubMed] [Google Scholar]
- 3.Roodman GD. N Engl J Med. 2004;350:1655–1664. doi: 10.1056/NEJMra030831. [DOI] [PubMed] [Google Scholar]
- 4.Hirbe AC, Uluckan O, Morgan EA, Eagleton MC, Prior JL, Piwnica-Worms D, Trinkaus K, Apicelli A, Weilbaecher K. Blood. 2007;109:3424–3431. doi: 10.1182/blood-2006-09-048686. [DOI] [PMC free article] [PubMed] [Google Scholar]
- 5.Lapidot T, Kollet O. Leukemia. 2002;16:1992–2003. doi: 10.1038/sj.leu.2402684. [DOI] [PubMed] [Google Scholar]
- 6.Semerad CL, Christopher MJ, Liu F, Short B, Simmons PJ, Winkler I, Levesque JP, Chappel J, Ross FP, Link DC. Blood. 2005;106:3020–3027. doi: 10.1182/blood-2004-01-0272. [DOI] [PMC free article] [PubMed] [Google Scholar]
- 7.Grassi F, Piacentini A, Cristino S, Toneguzzi S, Cavallo C, Facchini A, Lisignoli G. Histochem Cell Biol. 2003;120:391–400. doi: 10.1007/s00418-003-0587-3. [DOI] [PubMed] [Google Scholar]
- 8.Le Y, Zhou Y, Iribarren P, Wang J. Cell Mol Immunol. 2004;1:95–104. [PubMed] [Google Scholar]
- 9.Aiuti A, Webb IJ, Bleul C, Springer T, Gutierrez-Ramos JC. J Exp Med. 1997;185:111–120. doi: 10.1084/jem.185.1.111. [DOI] [PMC free article] [PubMed] [Google Scholar]
- 10.Peled A, Grabovsky V, Habler L, Sandbank J, Arenzana-Seisdedos F, Petit I, Ben-Hur H, Lapidot T, Alon R. J Clin Invest. 1999;104:1199–1211. doi: 10.1172/JCI7615. [DOI] [PMC free article] [PubMed] [Google Scholar]
- 11.Ma Q, Jones D, Borghesani PR, Segal RA, Nagasawa T, Kishimoto T, Bronson RT, Springer TA. Proc Natl Acad Sci USA. 1998;95:9448–9453. doi: 10.1073/pnas.95.16.9448. [DOI] [PMC free article] [PubMed] [Google Scholar]
- 12.Tachibana K, Hirota S, Iizasa H, Yoshida H, Kawabata K, Kataoka Y, Kitamura Y, Matsushima K, Yoshida N, Nishikawa S, et al. Nature. 1998;393:591–594. doi: 10.1038/31261. [DOI] [PubMed] [Google Scholar]
- 13.Nagasawa T, Hirota S, Tachibana K, Takakura N, Nishikawa S, Kitamura Y, Yoshida N, Kikutani H, Kishimoto T. Nature. 1996;382:635–638. doi: 10.1038/382635a0. [DOI] [PubMed] [Google Scholar]
- 14.Flomenberg N, Devine SM, Dipersio JF, Liesveld JL, McCarty JM, Rowley SD, Vesole DH, Badel K, Calandra G. Blood. 2005;106:1867–1874. doi: 10.1182/blood-2005-02-0468. [DOI] [PubMed] [Google Scholar]
- 15.Vlahakis SR, Villasis-Keever A, Gomez T, Vanegas M, Vlahakis N, Paya CV. J Immunol. 2002;169:5546–5554. doi: 10.4049/jimmunol.169.10.5546. [DOI] [PubMed] [Google Scholar]
- 16.Krathwohl MD, Kaiser JL. Stem Cells. 2004;22:109–118. doi: 10.1634/stemcells.22-1-109. [DOI] [PubMed] [Google Scholar]
- 17.Kucia M, Jankowski K, Reca R, Wysoczynski M, Bandura L, Allendorf DJ, Zhang J, Ratajczak J, Ratajczak MZ. J Mol Histol. 2004;35:233–245. doi: 10.1023/b:hijo.0000032355.66152.b8. [DOI] [PubMed] [Google Scholar]
- 18.Wright LM, Maloney W, Yu X, Kindle L, Collin-Osdoby P, Osdoby P. Bone. 2005;36:840–853. doi: 10.1016/j.bone.2005.01.021. [DOI] [PubMed] [Google Scholar]
- 19.Taichman RS, Cooper C, Keller ET, Pienta KJ, Taichman NS, McCauley LK. Cancer Res. 2002;62:1832–1837. [PubMed] [Google Scholar]
- 20.Smith MC, Luker KE, Garbow JR, Prior JL, Jackson E, Piwnica-Worms D, Luker GD. Cancer Res. 2004;64:8604–8612. doi: 10.1158/0008-5472.CAN-04-1844. [DOI] [PubMed] [Google Scholar]
- 21.Sun YX, Schneider A, Jung Y, Wang J, Dai J, Wang J, Cook K, Osman NI, Koh-Paige AJ, Shim H, et al. J Bone Miner Res. 2005;20:318–329. doi: 10.1359/JBMR.041109. [DOI] [PubMed] [Google Scholar]
- 22.Kang Y, Siegel PM, Shu W, Drobnjak M, Kakonen SM, Cordon-Cardo C, Guise TA, Massague J. Cancer Cell. 2003;3:537–549. doi: 10.1016/s1535-6108(03)00132-6. [DOI] [PubMed] [Google Scholar]
- 23.Halleen JM. Anticancer Res. 2003;23:1027–1029. [PubMed] [Google Scholar]
- 24.Powles T, Paterson S, Kanis JA, McCloskey E, Ashley S, Tidy A, Rosenqvist K, Smith I, Ottestad L, Legault S, et al. J Clin Oncol. 2002;20:3219–3224. doi: 10.1200/JCO.2002.11.080. [DOI] [PubMed] [Google Scholar]
- 25.De Klerck B, Geboes L, Hatse S, Kelchtermans H, Meyvis Y, Vermeire K, Bridger G, Billiau A, Schols D, Matthys P. Arthritis Res Ther. 2005;7:R1208–R1220. doi: 10.1186/ar1806. [DOI] [PMC free article] [PubMed] [Google Scholar]
- 26.Burns JM, Summers BC, Wang Y, Melikian A, Berahovich R, Miao Z, Penfold ME, Sunshine MJ, Littman DR, Kuo CJ, et al. J Exp Med. 2006;203:2201–2213. doi: 10.1084/jem.20052144. [DOI] [PMC free article] [PubMed] [Google Scholar]
- 27.Balabanian K, Lagane B, Infantino S, Chow KY, Harriague J, Moepps B, Arenzana-Seisdedos F, Thelen M, Bachelerie F. J Biol Chem. 2005;280:35760–35766. doi: 10.1074/jbc.M508234200. [DOI] [PubMed] [Google Scholar]
- 28.Ross FP. In: Primer on the Metabolic Bone Diseases and Disorders of Mineral Metabolism. 6th Ed. Favus MJ, editor. Washington, DC: Am Soc Bone and Mineral Res; 2006. pp. 30–35. [Google Scholar]
- 29.Ross FP, Teitelbaum SL. Immunol Rev. 2005;208:88–105. doi: 10.1111/j.0105-2896.2005.00331.x. [DOI] [PubMed] [Google Scholar]
- 30.Feng X. IUBMB Life. 2005;57:389–395. doi: 10.1080/15216540500137669. [DOI] [PubMed] [Google Scholar]
- 31.Huang H, Chang EJ, Ryu J, Lee ZH, Lee Y, Kim HH. Biochem Biophys Res Commun. 2006;351:99–105. doi: 10.1016/j.bbrc.2006.10.011. [DOI] [PubMed] [Google Scholar]
- 32.Troen BR. Ann NY Acad Sci. 2006;1068:165–172. doi: 10.1196/annals.1346.018. [DOI] [PubMed] [Google Scholar]
- 33.Kobayashi Y, Mizoguchi T, Take I, Kurihara S, Udagawa N, Takahashi N. J Biol Chem. 2005;280:11395–11403. doi: 10.1074/jbc.M411189200. [DOI] [PubMed] [Google Scholar]
- 34.Guise TA. Cancer. 2000;88:2892–2898. doi: 10.1002/1097-0142(20000615)88:12+<2892::aid-cncr2>3.0.co;2-y. [DOI] [PubMed] [Google Scholar]
- 35.Kostenuik PJ, Singh G, Suyama KL, Orr FW. Clin Exp Metastasis. 1992;10:411–418. doi: 10.1007/BF00133470. [DOI] [PubMed] [Google Scholar]
- 36.Klein RS, Rubin JB. Trends Immunol. 2004;25:306–314. doi: 10.1016/j.it.2004.04.002. [DOI] [PubMed] [Google Scholar]
- 37.Jones DH, Nakashima T, Sanchez OH, Kozieradzki I, Komarova SV, Sarosi I, Morony S, Rubin E, Sarao R, Hojilla CV, et al. Nature. 2006;440:692–696. doi: 10.1038/nature04524. [DOI] [PubMed] [Google Scholar]
- 38.Martin TJ, Mundy GR. Nature. 2007;445:E19. doi: 10.1038/nature05657. discussion E19–E20. [DOI] [PubMed] [Google Scholar]
- 39.Bakewell SJ, Nestor P, Prasad S, Tomasson MH, Dowland N, Mehrotra M, Scarborough R, Kanter J, Abe K, Phillips D, Weilbaecher KN. Proc Natl Acad Sci USA. 2003;100:14205–14210. doi: 10.1073/pnas.2234372100. [DOI] [PMC free article] [PubMed] [Google Scholar]
- 40.Alsayed Y, Ngo H, Runnels J, Leleu X, Singha UK, Pitsillides CM, Spencer JA, Kimlinger T, Ghobrial JM, Jia X, et al. Blood. 2007;109:2708–2717. doi: 10.1182/blood-2006-07-035857. [DOI] [PMC free article] [PubMed] [Google Scholar]
- 41.Rubin JB, Kung AL, Klein RS, Chan JA, Sun Y, Schmidt K, Kieran MW, Luster AD, Segal RA. Proc Natl Acad Sci USA. 2003;100:13513–13518. doi: 10.1073/pnas.2235846100. [DOI] [PMC free article] [PubMed] [Google Scholar]
- 42.Hirbe A, Morgan EA, Uluckan O, Weilbaecher K. Clin Cancer Res. 2006;12:6309s–6314s. doi: 10.1158/1078-0432.CCR-06-0652. [DOI] [PMC free article] [PubMed] [Google Scholar]
- 43.Park BK, Zhang H, Zeng Q, Dai J, Keller ET, Giordano T, Gu K, Shah V, Pei L, Zarbo RJ, et al. Nat Med. 2007;13:62–69. doi: 10.1038/nm1519. [DOI] [PubMed] [Google Scholar]
- 44.Parfitt AM. J Bone Miner Res. 1987;2:595–610. doi: 10.1002/jbmr.5650020617. [DOI] [PubMed] [Google Scholar]
- 45.Zhao H, Kitaura H, Sands MS, Ross FP, Teitelbaum SL, Novack DV. J Bone Miner Res. 2005;20:2116–2123. doi: 10.1359/JBMR.050724. [DOI] [PubMed] [Google Scholar]
- 46.Tintut Y, Parhami F, Tsingotjidou A, Tetradis S, Territo M, Demer LL. J Biol Chem. 2002;277:14221–14226. doi: 10.1074/jbc.M111551200. [DOI] [PubMed] [Google Scholar]
- 47.Zhao H, Laitala-Leinonen T, Parikka V, Vaananen HK. J Biol Chem. 2001;276:39295–39302. doi: 10.1074/jbc.M010999200. [DOI] [PubMed] [Google Scholar]
- 48.Mulari MT, Zhao H, Lakkakorpi PT, Vaananen HK. Traffic. 2003;4:113–125. doi: 10.1034/j.1600-0854.2003.40206.x. [DOI] [PubMed] [Google Scholar]
Associated Data
This section collects any data citations, data availability statements, or supplementary materials included in this article.