Abstract
Although signaling between neurons is central to the functioning of the brain, we still do not understand how the code used in signaling depends on the properties of synaptic transmission. Theoretical analysis combined with patch clamp recordings from pairs of neocortical pyramidal neurons revealed that the rate of synaptic depression, which depends on the probability of neurotransmitter release, dictates the extent to which firing rate and temporal coherence of action potentials within a presynaptic population are signaled to the postsynaptic neuron. The postsynaptic response primarily reflects rates of firing when depression is slow and temporal coherence when depression is fast. A wide range of rates of synaptic depression between different pairs of pyramidal neurons was found, suggesting that the relative contribution of rate and temporal signals varies along a continuum. We conclude that by setting the rate of synaptic depression, release probability is an important factor in determining the neural code.
Keywords: synaptic plasticity, synaptic depression, action potential decoding, neural networks
There is an ongoing debate on whether a cortical neuron is driven mainly by the average firing rates of presynaptic neurons or by temporally coherent firing events (see refs. 1–3). The important factor in this debate that has been overlooked is the constraints imposed by the properties of synaptic transmission between specific types of neurons. The striking feature of synaptic transmission between neocortical pyramidal neurons is activity-dependent synaptic depression, resulting in complex postsynaptic responses that cannot be reduced to a linear sum of responses to single presynaptic action potentials (APs) (4). To isolate the primary determinants of signaling between these neurons, we applied a combined approach based on dual whole-cell patch clamp recordings of layer 5 pyramidal neurons and a phenomenological model of synaptic transmission between these neurons. Preliminary results of this study were published in ref. 5. Some of the results presented here were independently obtained in ref. 6.
MATERIALS AND METHODS
Electrophysiology.
Sagittal slices (300 μM) were cut from the neocortex of Wistar rats (13–15 days; from the Weizmann Institute of Science) as described (7). While only immature synapses were studied, the behavior of this type of synaptic connection in the adult animal is similar (4). All experiments were performed at 30–32°C. The extracellular solution contained 125 mM NaCl, 2.5 mM KCl, 25 mM glucose, 25 mM NaHCO3, 1.25 mM NaH2PO4, 2 mM CaCl2, and 1 mM MgCl2. Layer 5 pyramidal neurons from the somatosensory cortical area were identified using infrared differential interference contrast video-microscopy on an upright microscope (Zeiss) fitted with a ×40 water/0.75 numerical aperture objective lens as described (8). Somatic whole-cell recordings (10–20 MΩ access resistance) were obtained and signals were amplified using two Axoclamp-2B amplifiers (Axon Instruments, Foster City, CA) and captured on computer using pulse control (Richard Bookman and colleagues, University of Miami), which was analyzed using programs written in igor (WaveMetrics, Lake Oswego, OR). Neurons were recorded with pipettes containing 100 mM K-gluconate, 20 mM KCl, 4 mM ATP-Mg, 10 mM phosphocreatine, 0.03 mM GTP, 10 mM Hepes, and 0.5% biocytin (pH 7.3, 310 mOsm). Resting membrane potential levels were typically −62 ± 2 mV. The amplitude of excitatory postsynaptic potentials (EPSPs) were measured as the difference between the postsynaptic voltage at the peak and at the onset, from average traces (30–75 trials; average of 3–5 sampling points). The average depolarization caused by a train of EPSPs was measured as the integral of the postsynaptic voltage relative to the resting membrane potential over the specified time window.
Model.
We characterized the synaptic connection by its absolute amount of “resources,” which can be partitioned into three states: effective, inactive, and recovered. If all the resources are activated by a presynaptic AP, this would generate the maximal possible response defined here as the absolute synaptic efficacy (ASE). Each presynaptic AP activates a certain fraction of resources available in the recovered state, which then quickly inactivates with a time constant of a few milliseconds and recovers with a time constant of about 1 sec. This model could reflect various possible biophysical mechanisms of synaptic depression, such as receptor desensitization (9) or depletion of synaptic vesicles (10).
Kinetic equations for the fraction of resources in each of the three states read:
 |
 |
 |
1 |
where E (effective), I (inactive), and R (recovered) are the fraction of resources in the corresponding state. τinact and τrec are the time constants of inactivation and recovery, respectively. Each AP, arriving at the time tAP, instantaneously activates a fraction, USE (utilization of synaptic efficacy parameter), of synaptic resources available in the recovered state. The net postsynaptic somatic current is proportional to the fraction of resources in the effective state, E. Trial-by-trial fluctuations in synaptic responses, including failures, are neglected in the model because synaptic inputs from large populations of neurons are expected to average out these fluctuations. USE (as well as τrec and τinact) is a kinetic parameter of the model that determines the dynamic behavior of synaptic transmission, in particular the rate of depression. The higher the USE, the faster synaptic resources are utilized, which effectively leads to more rapid depression.
These equations allow iterative expressions for successive excitatory postsynaptic currents (EPSCs) produced by a train of presynaptic APs:
 |
 |
2 |
where Δt is the time interval between nth and (n + 1)th AP, and ASE is the maximal EPSC evoked when all the resources are shifted into the effective state. In deriving Eq. 2, Δt was assumed to be much larger than the inactivation time constant, hence the dependence on τinact dropped out of this equation.
RESULTS
Simulating Dynamic Synaptic Transmission.
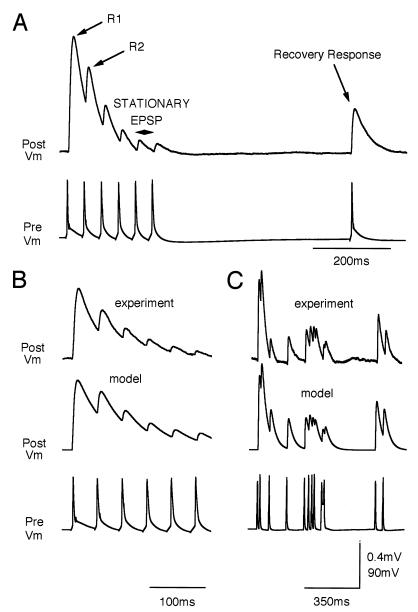
To use the model to simulate dynamic synaptic transmission a number of parameters have to be determined experimentally. The postsynaptic responses to a standard stimulation protocol were used to derive the paramters ASE, USE, and τrec for a given synapse (Fig. 1A). The model could then reproduce the experimental traces for both regular and irregular trains of presynaptic APs (Fig. 1 B and C).
Figure 1.
Functional synaptic model. (A) Stimulation paradigm used to obtain the parameters for the model. (B) Postsynaptic potential generated by a regular spike train (Bottom), at a frequency of 23 Hz measured experimentally (Top; average more than 50 sweeps), and computed with the model (Middle). (C) Same as B for irregular spike train (different synaptic connection). Postsynaptic potential is computed using a passive membrane mechanism [τmem(dV/dt) = −V + RinIsyn(t)] with an input resistance of 100MΩ. τrec is obtained by measuring the time of recovery for a synapse after stimulating it with high frequency burst (single exponential). Other parameters are determined by iteratively comparing model and experimental traces until the best match with the initial (R1), transition (R2 and others), and stationary responses is achieved. Parameters in B: τinact = 3 msec, τrec = 800 msec, USE = 0.67, ASE = 250 pA, τmem = 50 msec. Parameters in C: τinact = 3 msec, τrec = 450 msec, USE = 0.55, ASE = 530 pA, τmem = 30 msec.
Rate Coding.
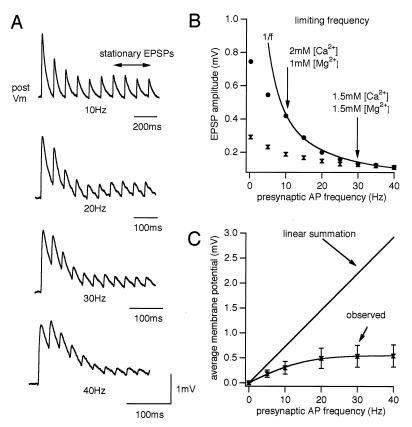
The model made several predictions, both about the properties of synaptic transmission and how these properties influence the way in which the signal transmitted between pyramidal neurons could be coded. The first prediction was that if the synapses are driven beyond a certain frequency, defined as the limiting frequency, then the stationary amplitude of individual EPSPs reached during a regular spike train would begin to decrease in inverse proportion to the frequency (1/f):
 |
3 |
To test the accuracy of this prediction we recorded the synaptic responses at different frequencies and found the prediction to be true in all of 11 cases (Fig. 2 A and B). The limiting frequencies were between 10 and 25 Hz. The 1/f law of these synapses indicates that above the limiting frequency the average postsynaptic depolarization from resting membrane potential saturates as presynaptic firing rates increase (Fig. 2C). The limiting frequency therefore sets the frequency range within which these synapses are able to transmit information about the presynaptic firing rate.
Figure 2.
Frequency-dependent synaptic depression. (A) Recorded EPSPs generated by presynaptic spike trains at various frequencies (same neuron, average of 20 sweeps). (B) Stationary EPSPs in 2 mM [Ca2+]out (•) and 1.5 mM [Ca2+]out (⧗), same synapse. The solid line shows the inverse relationship with frequency. This effect of lowering [Ca2+]out on the limiting frequency was observed in all four synaptic connections tested. (C) Time-averaged membrane potential in postsynaptic neurons during the last four EPSPs, relative to resting potential as a function of presynaptic AP frequency (seven synapses; observed). (Bars = SD.)
The second prediction was that factors that determine the rate of synaptic depression also determine the limiting frequency:
 |
4 |
In the model, the higher USE is, the faster synaptic responses depress to a stationary level for a given frequency of stimulation and the lower the limiting frequency is.
Depending on the biophysical mechanism of depression, the USE parameter can be in part or completely determined by the probability that an AP would evoke neurotransmitter release. Indeed, reducing this probability by lowering Ca2+ concentration ([Ca2+]) slowed the rate of synaptic depression and increased the limiting frequency (Fig. 2B; see refs. 11 and 12). Release probability therefore determines the frequency range within which rate coding is possible. The model also shows that beyond the limiting frequency, the average depolarization caused during the train is independent of release probability (see Eq. 3). Changing release probability therefore results in redistribution of synaptic efficacy between spikes in a train and not in a change in absolute synaptic efficacy (see also ref. 7). A natural range of USE values (0.1–0.95) was found within a population of 33 experimentally examined synaptic connections, which is consistent with the range of release probabilities found at these synapses using a binomial model (ref. 13; H.M., J. Lübke, A. Roth, M. Frotscher, and B. Sakmann, unpublished data).
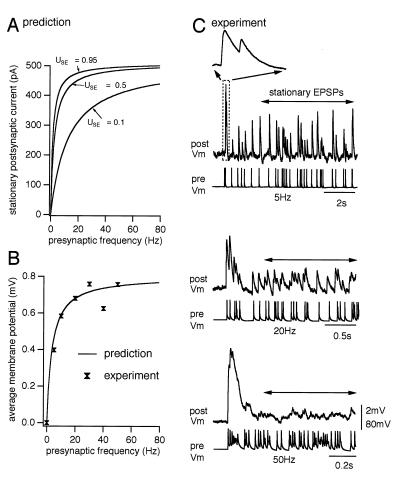
The range of USE values predicts a continuum of frequency-dependent behaviors under in vivo conditions where neurons are firing irregularly (14) (Fig. 3A). To test the accuracy of this prediction, the synaptic behavior for a particular synaptic connection was first modeled using the parameters derived from the average response to a regular AP train (see Fig. 1A). The computed time-averaged membrane potential (analogous to spatial summation of synaptic input from a population) generated by Poisson spike trains at different rates was then compared with the results from an experiment in which the same neuron was forced to generate Poisson spike trains at different rates (Fig. 3 B and C). Indeed the predicted and observed behaviors matched (Fig. 3B).
Figure 3.
Utilization of synaptic efficacy parameter determines signaling presynaptic firing rates. (A) The predicted spatially summated synaptic input from n = 500 presynaptic neurons firing Poisson trains as a function of their firing rates r. The corresponding analytical expression, derived from the model Eq. 1, reads Ipost = ASEn(rτinactUSE/1 + rτrec USE). Represented are the lowest, highest, and mean values of USE, derived from 33 experimentally examined synaptic connections. (B) Predicted time-averaged membrane potential at different presynaptic spiking frequencies, computed from the model. Parameters: USE = 0.4, τrec = 700 msec, τinact = 3 msec, τmem = 25 msec. Superimposed are the experimental time-averaged membrane potentials from the neuron represented in C. (C) Experimentally recorded EPSPs generated by Poisson presynaptic spike trains at various frequencies. Single-sweep responses are represented. Arrows indicate the time window over which the time-averaged membrane potentials shown in B were determined. (Inset) The onset of the response to the 5-Hz Poisson spike train. Similar results were obtained from three synaptic connections.
Temporal Coding.
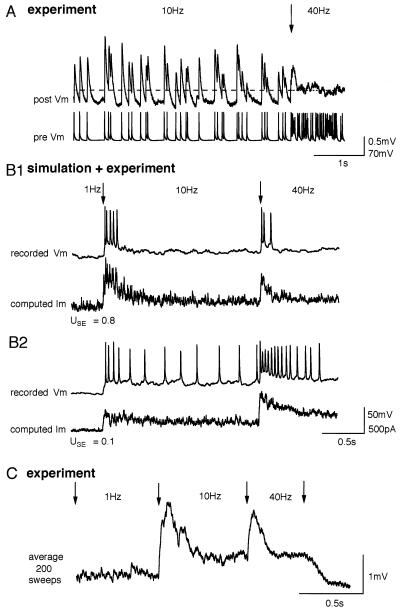
The 1/f law implies that when a single presynaptic neuron, firing at a rate above the limiting frequency, increases its firing rate, the average postsynaptic depolarization will not change (Fig. 4A). However, several transition EPSPs are generated before the stationary level of synaptic responses is reached for a given frequency (see Figs. 1A and 3C), allowing for a time window within which synchronous changes in synaptic input from a population of neurons would summate to generate a transient signal in the postsynaptic neuron (Fig. 4B). The value of USE determines the rate of synaptic depression and hence the time window for spatial summation of synchronized inputs, as well as the amplitude of this transient response.
Figure 4.
Signaling of synchronized transitions in the activity of a population of presynaptic neurons. (A) Experimentally recorded EPSPs generated by a Poisson spike train undergoing transition (indicated by arrow) from 10 to 40 Hz. The average membrane potentials before and after the transition (indicated by dashed line) were equal to the third decimal point. (B1) Simulated postsynaptic current, generated by Poisson spike trains, of a population of 500 presynaptic neurons with synchronous transitions from 1 to 10 Hz and then to 40 Hz, together with the response of a pyramidal neuron when the simulated synaptic current was injected into the soma. A population signal emerged as the number of neurons in the presynaptic pool was increased. Parameters of the model are the same as in Fig. 3. (B2) The same as B1 but with lower value of USE and twice as large ASE. (C) Average voltage response recorded from a postsynaptic neuron after stimulating the presynaptic neuron with the sequence of 200 different Poisson spike trains undergoing the same transitions as in B.
Neurotransmitter release probability therefore determines the contributions of rate and temporal signals to the postsynaptic response by modulating the relative amplitudes of its transient and stationary components (compare Fig. 4 B1 and B2). Transient currents can reliably drive neocortical pyramidal neurons (15), and hence the temporal coherence of APs in the presynaptic population could be reflected in the AP response of the postsynaptic neuron (1, 16, 17). To test this possibility experimentally, we injected computed current into a pyramidal neuron and recorded its response. Indeed, we found that when USE was high, the AP response reflected mostly coherent firing rate transitions in the presynaptic population (Fig. 4B1) and when USE was low, the AP response reflected more average presynaptic firing rates (Fig. 4B2). To observe this transient current experimentally would require simultaneous stimulation of hundreds of presynaptic neurons. It was, however, confirmed indirectly by stimulating the same synaptic connection with different Poisson spike trains and averaging the postsynaptic voltage response (Fig. 4C).
Regulating the Neural Code.
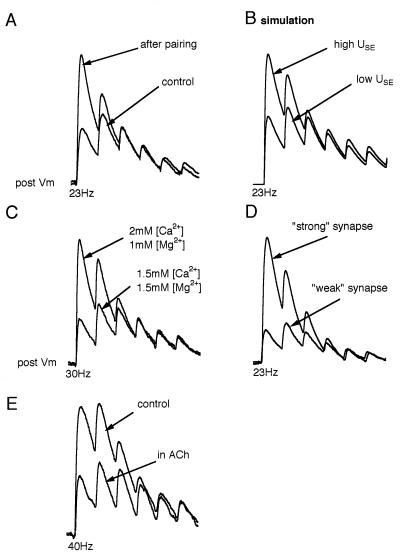
We identified two different means by which the brain could regulate the neural code between pyramidal neurons. Redistribution of synaptic efficacy, caused by pairing pre- and postsynaptic activity, has been shown to increase the rate of synaptic depression (7) without changing stationary EPSPs at high frequencies (and τrec) and can be modeled as an increase in the value of USE (Fig. 5 A and B). This change in USE is analagous to the change in release probability (Fig. 5C). From a population of synaptic connections examined experimentally, we found that pairing resulted in an increase in USE from 0.5 ± 0.23 to 0.69 ± 0.18 (mean ± SD; 18 synaptic connections, P < 0.01 paired t test). Pairing would thus limit rate coding and emphasize the importance of presynaptic temporal coherence as well as the history of activity, and therefore represents a mechanism by which the significance of coherent firing is scaled according to the individual firing history of each neuron. The value of USE is likely to be set by the precise pattern of pre- and postsynaptic activity (ref. 7; H.M., J. Lübke, M. Frotscher, and B. Sakmann, unpublished data), which may underlie the natural distribution of USEs observed in these synapses (Fig. 5D).
Figure 5.
Changing the amount of synaptic utilization by APs. (A) Effect of pairing pre- and postsynaptic APs on the synaptic response to a 23-Hz train of presynaptic APs (experiment). The average response of 58 sweeps is shown before and 20 min after pairing. This effect is described in greater detail in (7). Pairing episodes were repeated 20 times every 30 sec. (B) Changing USE can mimic the effect of pairing. USE = 0.35 before pairing, USE = 0.67 after pairing. The rest of parameters are as in Fig. 1B. (C) Lowering extracellular calcium increases the rate of failures of the synaptic connection from 2.6 ± 2.17% (n = 19) to 21 ± 5.4% (n = 6) and slows the rate of synaptic depression. This effect has been recorded in 10 synaptic connections and is reversible (data not shown). Despite a marked decrease in the probability of release, the stationary EPSPs (last three EPSPs) are unaffected. Average responses (40 sweeps) to 30-Hz presynaptic APs are shown. (D) Two different synaptic connections selected to demonstrate that while the initial responses (low frequency) were markedly different, the stationary EPSPs (high frequency) were the same. The differences are due to different utilizations of efficacies (USE values) and not due to differences in absolute efficacies. Average responses (40 sweeps) to 23-Hz presynaptic APs are shown. (E) Redistribution of synaptic efficacy caused by acetylcholine (ACh). Bath application of 50 μM ACh reduced the initial (low frequency) responses (by 50–80%) and reduced the rate of depression for consecutive EPSPs, but had no effect on stationary EPSPs. This effect has been recorded in all 11 synaptic connections and reverses on washout of ACh (n = 9) or washing of a muscarinic receptor antagonist, atropine (n = 2). Average responses (30 sweeps) to 40-Hz presynaptic APs are shown. Concentrations as low as 10 μM were effective in reducing the low frequency EPSP by more than 10% (n = 3). Higher concentrations (above 200 μM) almost block transmission completely (n = 3). Maximum responses from A to E are normalized.
The second mechanism to regulate the neural code could be via neuromodulators. Indeed, ACh, a neuromodulator, which is known to inhibit neurotransmitter release (18), reduced the rate of synaptic depression without affecting stationary EPSPs (Fig. 5E). ACh therefore attenuates temporal coding and could underlie the desynchronization of the cortical electroencephalogram during forebrain stimulation and attentiveness (19).
DISCUSSION
In conclusion, we demonstrated the existence of a continuum of rate and temporal coding between neocortical pyramidal neurons. This continuum exists because utilizations of synaptic efficacies by presynaptic APs differ over the population of synaptic contacts. Synapses are likely to be positioned on this continuum according to the degree of temporal coherence of pre- and postsynaptic APs, and neuromodulators that regulate neurotransmitter release may transiently change the position set by activity. For a given set of absolute synaptic efficacies and individual neuronal spiking, the way in which synapses utilize their efficacies determines which features of the presynaptic population activity are effective in producing the postsynaptic response that drives the neuron. Synapses therefore perform complex computational tasks and therefore partake in decoding network activity.
Acknowledgments
We thank Ehud Ahissar, Amiram Grinvald, Menahem Segal, Idan Segev, Sebastian Seung, Dov Sagi, Bill Skaggs, and Haim Sompolinsky for their critical comments on the manuscript. The study was supported by a research grant from the Henry S. and Ann S. Reich Research Fund for Mental Health, and grants from the Binational Science Foundation and the Office of Naval Research. H.M. is incumbent of the Joseph D. Shane career development chair.
Footnotes
Abbreviations: AP, action potential; EPSP, excitatory postsynaptic potential; EPSC, excitatory postsynaptic current; ACh, acetylcholine.
References
- 1.Abeles M. Corticonics. New York: Cambridge Univ. Press; 1991. [Google Scholar]
- 2.Shadlen M N, Newsome W T. Curr Opin Neurobiol. 1994;4:569–579. doi: 10.1016/0959-4388(94)90059-0. [DOI] [PubMed] [Google Scholar]
- 3.Softky W R. Curr Opin Neurobiol. 1995;5:239–247. doi: 10.1016/0959-4388(95)80032-8. [DOI] [PubMed] [Google Scholar]
- 4.Thomson A M, Deuchars J. Trends Neurosci. 1994;17:119–126. doi: 10.1016/0166-2236(94)90121-x. [DOI] [PubMed] [Google Scholar]
- 5.Tsodyks M V, Markram H. Lect Notes Comput Sci. 1996;1112:445–450. [Google Scholar]
- 6.Abbott, L. F., Varela, J. A., Kamal, S. & Nelson, S. B. Science, in press.
- 7.Markram H, Tsodyks M V. Nature (London) 1996;382:807–810. doi: 10.1038/382807a0. [DOI] [PubMed] [Google Scholar]
- 8.Stuart G J, Dodt H-U, Sakmann B. Pflügers Arch. 1992;423:511–518. doi: 10.1007/BF00374949. [DOI] [PubMed] [Google Scholar]
- 9.Destexhe A, Mainen Z F, Sejnowski T J. J Comput Neurosci. 1994;1:195–230. doi: 10.1007/BF00961734. [DOI] [PubMed] [Google Scholar]
- 10.McNaughton B L. In: Neural Connections, Mental Computation. Nadel L, Cooper L A, Culicover P, Harnish R M, editors. Cambridge, MA: MIT Press; 1989. pp. 285–350. [Google Scholar]
- 11.Betz W. J Physiol (London) 1970;206:629–644. doi: 10.1113/jphysiol.1970.sp009034. [DOI] [PMC free article] [PubMed] [Google Scholar]
- 12.Korn H, Faber D S, Burnod Y, Triller A. J Neurosci. 1984;4:125–130. doi: 10.1523/JNEUROSCI.04-01-00125.1984. [DOI] [PMC free article] [PubMed] [Google Scholar]
- 13.Allen C, Stevens C F. Proc Natl Acad Sci USA. 1994;91:10380–10383. doi: 10.1073/pnas.91.22.10380. [DOI] [PMC free article] [PubMed] [Google Scholar]
- 14.Softky W R, Koch C. J Neurosci. 1993;13:334–350. doi: 10.1523/JNEUROSCI.13-01-00334.1993. [DOI] [PMC free article] [PubMed] [Google Scholar]
- 15.Mainen Z F, Sejnowski T J. Science. 1995;268:1503–1506. doi: 10.1126/science.7770778. [DOI] [PubMed] [Google Scholar]
- 16.Singer W. Int Rev Neurobiol. 1994;37:153–183. doi: 10.1016/s0074-7742(08)60245-7. [DOI] [PubMed] [Google Scholar]
- 17.Hopfield J J. Nature (London) 1995;376:33–36. doi: 10.1038/376033a0. [DOI] [PubMed] [Google Scholar]
- 18.Valentino R J, Dingledine R. J Neurosci. 1981;1:784–792. doi: 10.1523/JNEUROSCI.01-07-00784.1981. [DOI] [PMC free article] [PubMed] [Google Scholar]
- 19.Metherate R, Coc C L, Ashe J H. J Neurosci. 1992;12:14701–14711. [Google Scholar]


