

Abstract
Iron is a trace metal essential for normal brain development but toxic in excess as it is capable of generating highly reactive radicals that damage cells and tissue. Iron is stringently regulated by the iron regulatory proteins, IRP1 and IRP2, which regulate proteins involved in iron homeostasis at the posttranscriptional level. In this study, 12 distinct regions were microdissected from the mouse brain and regional changes in the levels of loosely bound and non-heme iron that occur with development were measured. We examined 6, 12, and 24 week old wildtype C57BL/6 mice and mice with a targeted deletion of iron regulatory protein 2 (IRP2-/-) that have been reported to develop neurodegenerative symptoms in adulthood. In wildtype mice, levels of loosely bound iron decreased while non-heme iron increased with development. In contrast, an increase in loosely bound and a more pronounced increase in non-heme iron was seen in IRP2-/- mice between 6 and 12 weeks of age, stemming from lower levels at 6 weeks (the youngest age examined) compared to wildtype. These results have implications for understanding the increase in regional brain iron that is associated with normal aging and is postulated to be exacerbated in neurodegenerative disorders.
Keywords: iron regulatory protein 2, neurodegeneration, microdissection, iron
1. Introduction
Iron is essential for many cellular functions but must be stringently regulated as it is one of the most abundant redox-active metals, capable of catalyzing the production of reactive oxygen species (ROS). In fact, most ROS are generated from the reaction between molecular oxygen and Fe (II) or Cu (I) (Perry et al., 2002; Barnham et al., 2004). It is well known that brain iron is important in development and normal neurologic function (Beard et al., 2002). Neurons and glial cells require iron for electron transport, NADPH reductase activity, myelination of axons, and as a cofactor for enzymes involved in the synthesis of neurotransmitters (Hu and Connor, 1996). However, while iron deficiency impairs cell growth in culture, iron overload can cause cellular damage. Thus, the maintenance of iron homeostasis is critical for the cell (Hentze et al., 2004; Rouault, 2006; Wallander et al., 2006).
Approximately two thirds of total iron in the human body is found in the hemoglobin of red blood cells, which functions in oxygen transport, and 10% is in myoglobin (Halliwell and Gutteridge, 1984). Other heme iron containing proteins include cytochrome P450, a, b, and c in the electron transport chain. Non-heme iron consists of iron tightly bound to proteins such as the iron transport proteins transferrin and lactoferrin and enzymes such as cytochrome oxidase, prolylhydroxylase, and tyrosine hydroxylase. The remaining non-heme iron is found in the intracellular storage protein ferritin and hemosiderin (Halliwell and Gutteridge, 1984; Gutteridge, 1992; Levenson and Tassabehji, 2004). Ferritin is the main iron storage protein in the brain, binding about one third of total brain iron (Bradbury, 1997; Koeppen, 2003), and iron stored in ferritin is not catalytically active under normal conditions (Kagan et al., 2001). Loosely bound iron is a labile, chelatable pool of non-heme iron that mediates the transfer of iron from ferritin storage sites to where it is needed for enzymatic and biosynthetic activity. It consists of iron attached to phosphate esters, carbohydrates, organic acids, DNA, and membrane lipids (Gutteridge, 1992; Kala et al., 1996) and is thought to be responsible for catalyzing the formation of ROS, such as the highly reactive hydroxyl radical from hydrogen peroxide, a normal metabolic byproduct, via the Fenton reaction (Gutteridge et al., 1981; Halliwell and Gutteridge, 1984; Jacobs, 1977). Therefore, dysregulation of loosely bound iron would lead to increased oxidative damage which is implicated in aging and neurodegenerative disorders such as Alzheimer‘s and Parkinson’s disease (Doraiswamy and Finefrock, 2004).
An imbalance in brain iron has been associated with normal aging and neurodegenerative disorders (Smith et al., 1997; Sayre et al., 1999; Perry et al., 2002; Huang et al., 2004; Todorich and Connor, 2004) and perturbation of iron homeostasis proteins can lead to neuropathology in mouse models (LaVaute et al., 2001; Jeong and David, 2006). Studies on rat and mouse brain have shown that iron increases with development (Roskams and Connor, 1994; Maynard et al., 2002; Tarohda et al., 2004), and brain non-heme iron increases with normal aging in humans (Hallgren and Sourander, 1958). However, little is known about the regional distribution of loosely bound iron in development. An understanding of the distribution of loosely bound iron is important as this pool of iron is thought to be responsible for catalyzing the reactive radicals that damage DNA and membrane lipids in the cell (Hentze et al., 2004).
To study changes in regional brain levels of loosely bound and non-heme iron with development, we measured their concentrations in 12 distinct brain regions of two substrains of C57BL/6 mice, C57BL/6NTac from Taconic Laboratories and C57BL/6J from the Jackson Laboratory, at the ages of 6, 12, and 24 weeks. Brains were fixed with focused microwave irradiation (MWR) which preserves labile brain metabolites (Schneider et al., 1981) and was shown to be an optimal method of preserving loosely bound iron in this study. We also measured iron concentrations in transgenic mice with a targeted deletion of iron regulatory protein 2 (IRP2) generated by LaVaute et al. (2001) and reported to accumulate iron in certain brain regions and exhibit neurodegenerative symptoms that worsen with age.
2. Results
2.1. Loosely bound iron in wildtype and IRP2-/- mice
Brain loosely bound iron concentrations in C57BL/6NTac and C57BL/6J mice were highly similar so that the two substrains were combined in subsequent analyses (Tables 1 and 2). In wildtype mice, loosely bound iron levels did not change with age either regionally or in whole brain (Figures 1, 2 and 3) except for a decrease at 24 weeks compared to 6 weeks in the ventral striatum and cerebellum (Figure 3) and also in the frontal cortex (data not shown).
Table 1.
Regional concentrations of loosely bound iron (presented as mean ± SD) with development in two non-transgenic mouse lines, C57BL/6NTac and C57BL/6J, and IRP2-/- mice at 6, 12 and 24 weeks.
| Brain region | C57BL/6NTac (μg Fe/g wet weight) | C57BL/6J (μg Fe/g wet weight) | IRP2-/- (μg Fe/g wet weight) | ||||||||||||
|---|---|---|---|---|---|---|---|---|---|---|---|---|---|---|---|
| 6 wk | 12 wk | 24 wk | 6 wk | 12 wk | 24 wk | 6 wk | 12 wk | 24 wk | |||||||
| (n = 8) | % Δ | (n = 8) | % Δ | (n = 9) | (n = 8) | % Δ | (n = 8) | % Δ | (n = 8) | (n = 8) | % Δ | (n = 8) | % Δ | (n = 7) | |
|
| |||||||||||||||
| OB | 4.4±0.8 | 34 | 5.9±1.9 | -28 | 4.3±1.0 | 3.9±0.6 | 0.2 | 3.9±0.6 | 11 | 4.4±1.1 | 3.4±0.9 | 23 | 4.2±0.8 | 11 | 4.6±1.5 |
| FC | 3.1±1.2 | -20 | 2.5±0.3 | -4 | 2.4±0.7 | 2.4±0.4 | 10 | 2.6±0.4 | -24 | 2.0±0.2b | 2.1±0.6 | 35 | 2.9±0.7 | -15 | 2.5±0.8 |
| PC | 4.7±2.4 | -38 | 2.9±0.6 | -5 | 2.8±0.5 | 2.6±0.6 | 18 | 3.1±0.5 | -12 | 2.7±0.5 | 2.6±0.5 | 18 | 3.0±0.3 | 19 | 3.6±2.2 |
| CB | 3.6±0.6 | -7 | 3.4±0.5 | -13 | 2.9±0.4 | 3.2±0.4 | 22 | 3.9±0.8 | -27 | 2.8±0.4b | 2.7±0.3 | 2 | 2.8±0.3 | -10 | 2.5±0.5 |
| HP | 4.1±0.6 | -5 | 3.9±0.5 | -6 | 3.6±0.7 | 3.4±0.7 | 6 | 3.6±0.4 | -16 | 3.0±0.4 | 3.3±0.7 | 13 | 3.7±0.3 | -15 | 3.1±0.7 |
| DS | 7.9±1.8 | -26 | 5.9±0.9a | -8 | 5.4±0.9a | 5.0±1.2* | 16 | 5.8±1.1 | -16 | 4.9±1.2 | 4.8±1.5 | 21 | 5.8±1.5 | -10 | 4.8±1.5 |
| VS | 4.5±0.9 | -26 | 3.3±0.7a | 10 | 3.7±0.7 | 3.8±0.9 | -3 | 3.7±0.8 | -13 | 3.3±0.2 | 2.8±0.4 | 39 | 3.9±1.2a | 17 | 4.5±0.8a |
| SP | 6.2±1.3 | -21 | 4.9±1.0 | -11 | 4.4±1.3a | 4.1±1.2 | 19 | 4.9±0.9 | -13 | 4.3±0.8 | 4.0±1.3 | 21 | 4.8±0.8 | 1.7 | 4.9±0.7 |
| TH | 5.0±1.7 | -29 | 3.6±0.6a | 6 | 3.8±0.6 | 3.3±0.8* | 4 | 3.4±0.4 | -11 | 3.0±0.4 | 2.9±0.3 | 10 | 3.2±0.3 | 20 | 3.9±1.1 |
| HY | 4.0±0.9 | -18 | 3.3±0.3 | 11 | 3.7±1.1 | 3.5±1.1 | -12 | 3.0±0.5 | -18 | 2.5±0.5*,a | 2.6±0.3 | 17 | 3.0±0.7 | -12 | 2.7±0.4 |
| EC | 4.4±0.5 | -14 | 3.8±0.7 | -2 | 3.8±0.7 | 3.7±1.5 | 0.4 | 3.7±0.7 | 2 | 3.7±0.8 | 3.1±0.6 | 27 | 3.9±1.2 | -7 | 3.6±0.7 |
| BS | 3.4±0.5 | -17 | 2.8±0.5 | 6 | 3.0±0.7 | 2.8±0.6* | 0.7 | 2.8±0.5 | -12 | 2.5±0.4 | 2.4±0.1 | 3 | 2.5±0.3 | -3 | 2.4±0.5 |
|
| |||||||||||||||
| Whole brain | 3.8±0.2 | -10 | 3.5±0.4 | -4 | 3.3±0.4 | 3.1±0.1* | 10 | 3.4±0.3 | -12 | 3.0±0.3 | 2.7±0.2 | 23 | 3.3±0.3a | 6 | 3.4±0.6a |
OB, olfactory bulb; FC, frontal cortex; PC, parietal cortex; CB, cerebellum; HP, hippocampus; DS, dorsal striatum; VS, ventral striatum; SP, septum; TH, thalamus; HY, hypothalamus; EC, entorhinal cortex, BS, brainstem. %Δ, percentage difference in iron concentration between 6 wk and 12 wk or 12 wk and 24 wk.
p< 0.05 vs 6 wk,
p < 0.05 vs 12 wk,
p < 0.05 vs BL/6J.
Table 2.
Regional concentrations of non-heme iron (presented as mean ± SD) with development in two non-transgenic mouse lines, C57BL/6NTac and C57BL/6J, and IRP2-/- mice at 6, 12 and 24 weeks.
| Brain region | C57BL/6NTac (μg Fe/g wet weight) | C57BL/6J (μg Fe/g wet weight) | IRP2-/- (μg Fe/g wet weight) | ||||||||||||
|---|---|---|---|---|---|---|---|---|---|---|---|---|---|---|---|
| 6 wk | 12 wk | 24 wk | 6 wk | 12 wk | 24 wk | 6 wk | 12 wk | 24 wk | |||||||
| (n = 9) | %Δ | (n = 8) | %Δ | (n = 9) | (n = 8) | %Δ | (n = 8) | %Δ | (n = 8) | (n = 8) | %Δ | (n = 7) | %Δ | (n = 5) | |
|
| |||||||||||||||
| OB | 19.4±2.5 | 39 | 27.0±4.2a | 6 | 28.6±3.6a | 21.8±3.6 | 4 | 22.7±2.0* | 23 | 28.0±1.6a,b | 18.5±2.8 | 12 | 20.8±2.2 | 28 | 26.6±2.7a,b |
| FC | 10.9±0.9 | 15 | 12.6±1.4a | 10 | 13.8±0.8a | 11.0±0.6 | 18 | 13.0±1.9a | 6 | 13.8±1.2a | 10.3±0.7 | 21 | 12.5±1.3a | 14 | 14.2±1.7a,b |
| PC | 12.4±0.8 | 13 | 14.0±2.5 | 7 | 14.9±1.1 | 12.0±0.9 | 18 | 14.2±1.4a | 6 | 15.0±1.4a | 11.8±0.7 | 17 | 13.8±1.4a | 26 | 17.4±2.5a,b |
| CB | 13.3±1.2 | 6 | 14.2±1.9 | 18 | 16.8±0.6a,b | 13.9±1.3 | 4 | 14.5±1.3 | 10 | 15.9±1.3a | 11.5±1.4 | 5 | 12.1±1.3 | 21 | 14.6±1.6a,b |
| HP | 12.1±1.9 | 20 | 14.5±2.6 | 1 | 14.6±2.0 | 13.4±0.8 | -2 | 13.2±1.9 | 20 | 15.8±2.6b | 10.3±1.3 | 18 | 12.2±0.8a | 9 | 13.3±1.4a |
| DS | 17.5±4.1 | 4 | 18.2±3.8 | 11 | 20.1±2.5 | 15.5±1.6 | 9 | 16.9±1.6 | 9 | 18.5±1.4a | 13.8±2.9 | 29 | 17.8±1.6 | 5 | 18.7±5.0a |
| VS | 12.0±1.3 | 34 | 16.0±2.4a | -5 | 15.2±0.8a | 13.4±1.4 | 4 | 14.0±1.9 | 14 | 16.0±0.9a | 12.0±2.5 | 5 | 12.6±1.1 | 24 | 15.6±1.7a,b |
| SP | 16.4±2.2 | 11 | 18.1±2.3 | 9 | 19.7±2.7a | 17.0±4.0 | -6 | 16.0±2.8 | 11 | 17.8±1.5 | 13.5±2.0 | 19 | 16.0±1.8a | 20 | 19.3±2.7a,b |
| TH | 15.4±2.1 | 8 | 16.6±1.6 | 3 | 17.0±0.7 | 14.3±1.3 | 4 | 14.9±1.2 | 13 | 16.9±1.5a | 14.6±1.6 | 4 | 15.1±1.1 | 23 | 18.6±2.9a,b |
| HY | 13.2±1.1 | 11 | 14.6±1.5 | 9 | 15.9±1.5a | 13.5±1.0 | 5 | 14.1±1.4 | 3 | 14.6±0.9 | 12.0±1.7 | 7 | 12.8±0.9 | 8 | 13.8±1.6 |
| EC | 12.2±2.3 | 24 | 15.1±1.7a | 0.5 | 15.1±2.0a | 12.9±2.5 | 8 | 13.9±3.0 | -4 | 13.3±0.9 | 11.1±1.0 | 17 | 13.0±2.1 | 11 | 14.5±4.2 |
| BS | 13.1±1.5 | 5 | 13.7±2.0 | -4 | 13.1±1.1 | 13.3±1.0 | -4 | 12.7±1.5 | 0.4 | 12.8±1.3 | 10.3±2.1 | 9 | 11.1±0.7 | 3 | 11.5±1.9 |
|
| |||||||||||||||
| Whole brain | 13.1±0.8 | 16 | 15.1±1.7a | 7 | 16.2±0.6a | 13.5±0.5 | 7 | 14.5±1.2 | 9 | 15.7±0.9a | 11.8±0.6 | 14 | 13.4±0.6a | 15 | 15.5±1.6a,b |
OB, olfactory bulb; FC, frontal cortex; PC, parietal cortex; CB, cerebellum; HP, hippocampus; DS, dorsal striatum; VS, ventral striatum; SP, septum; TH, thalamus; HY, hypothalamus; EC, entorhinal cortex, BS, brainstem. %Δ, percentage difference in iron concentration between 6 wk and 12 wk or 12 wk and 24 wk.
p < 0.05 vs 6 wk,
p < 0.05 vs 12 wk,
p < 0.05 vs BL/6J
Figure 1.
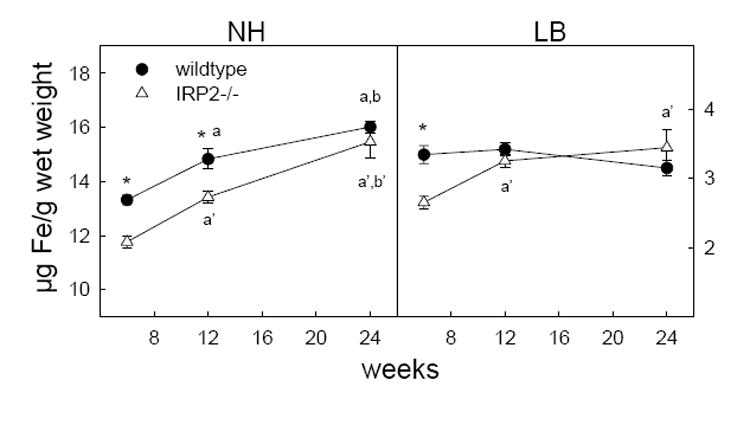
Changes in levels of non-heme and loosely bound iron in whole brain at 6, 12 and 24 weeks between wildtype and IRP2-/- mice. Error bars represent S.E. of the mean. *p < 0.05 IRP2-/- vs wildtype, ap < 0.05 vs 6 wk in wildtype, bp < 0.05 vs 12 wk in wildtype, a’p < 0.05 vs 6 wk in IRP2-/-, b’p < 0.05 vs 12 wk in IRP2-/-
Figure 2.
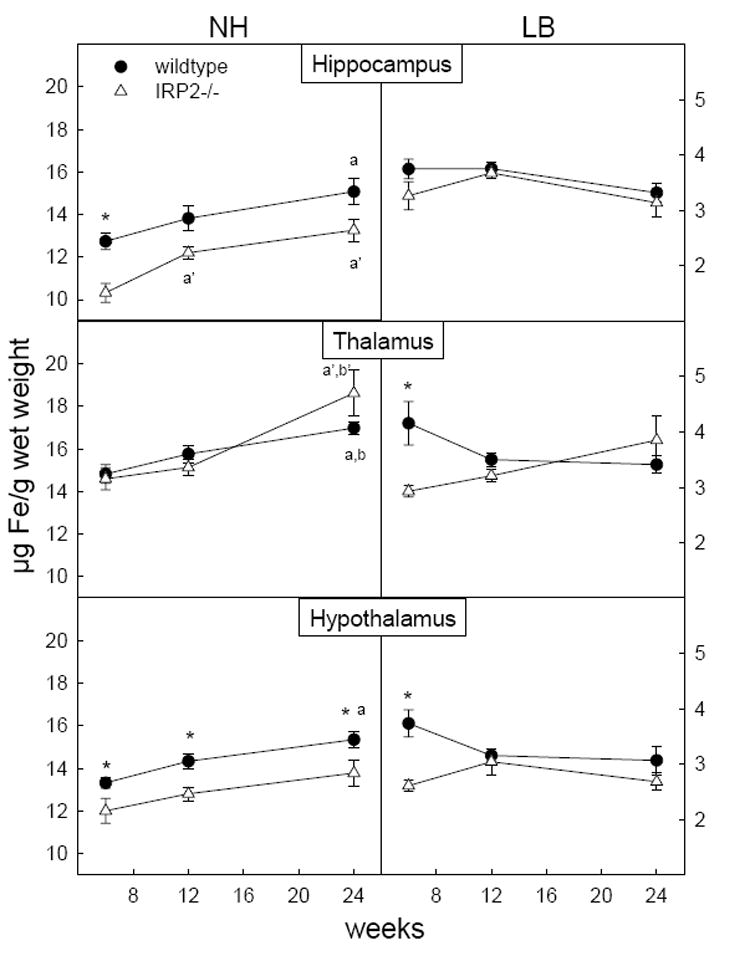
Changes in levels of non-heme and loosely bound iron in limbic structures at 6, 12, and 24 weeks between wildtype and IRP2-/- mice. Error bars represent S.E. of the mean. *p < 0.05 IRP2-/- vs wildtype, ap < 0.05 vs 6 wk in wildtype, bp < 0.05 vs 12 wk in wildtype, a’p < 0.05 vs 6 wk in IRP2-/-, b’p < 0.05 vs 12 wk in IRP2-/-
Figure 3.
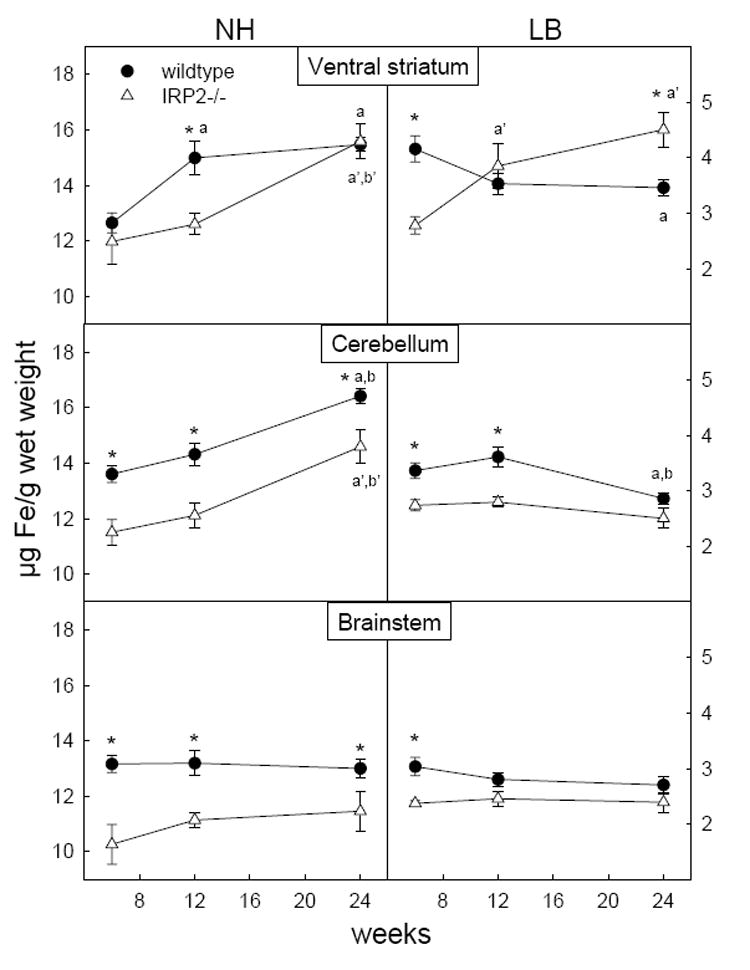
Changes in levels of non-heme and loosely bound iron in basal ganglia and motor structures at 6, 12, and 24 weeks between wildtype and IRP2-/- mice. Error bars represent S.E. of the mean. *p < 0.05 IRP2-/- vs wildtype, ap < 0.05 vs 6 wk in wildtype, bp < 0.05 vs 12 wk in wildtype, a’p < 0.05 vs 6 wk in IRP2-/-, b’p < 0.05 vs 12 wk in IRP2-/-
Additionally, we measured iron levels in the brains of transgenic mice with a targeted deletion of IRP2 generated by LaVaute et al. (2001). Intracellular iron is tightly regulated by the iron regulatory proteins, IRP1 and IRP2, which regulate the translation of proteins involved in iron homeostasis, such as the transferrin receptor and ferritin, in response to cytosolic “free” iron concentrations (Glickstein et al., 2005; Wallander et al., 2006). IRP2-/- mice have been reported to exhibit misregulation of iron in the brain, accumulate increased ferritin iron, and develop neurodegenerative symptoms in adulthood between 24 to 48 weeks of age (LaVaute et al., 2001; Grabill et al., 2003; Smith et al., 2004). Thus, mice were examined at 6, 12, and 24 weeks of age to determine if changes in iron levels could be observed before the appearance of symptoms.
Similar to wildtype mice, loosely bound iron remained constant with development in most brain regions of IRP2-/- mice (Table 1). However, IRP2-/- mice demonstrated significantly reduced levels of loosely bound iron compared to wildtype at 6 weeks of age in whole brain and several regions including the thalamus, hypothalamus, ventral striatum, cerebellum and brainstem (Figure 1, 2 and 3) as well as the parietal and entorhinal cortex (data not shown). Any difference between IRP2-/- and wildtype mice disappeared by 12 weeks in all regions except the cerebellum and ventral striatum. In the cerebellum, the difference between IRP2-/- and wildtype mice was abolished by 24 weeks due to a reduction of loosely bound iron in wildtypes. However, loosely bound iron in the ventral striatum of IRP2-/- mice increased from levels significantly lower than wildtype at 6 weeks to higher than wildtype by 24 weeks. (Figure 3) This accompanied a significant reduction of loosely bound iron in the ventral striatum of wildtype mice, and these changes are reflected in loosely bound iron increasing in whole brain of IRP2-/- mice but decreasing in wildtypes with age (Figure 1).
2.2. Non-heme iron in wildtype and IRP2-/- mice
In contrast to loosely bound iron, non-heme iron in whole brain increased with development in wildtype mice (Figure 1). This reflects significant increases in non-heme iron with age in all regions except the septum (data not shown) and brainstem (Figure 3). Non-heme iron also increased with age in IRP2-/- mice but levels were generally lower compared to wildtype. In whole brain, non-heme iron was significantly lower in IRP2-/- mice at 6 and 12 weeks and became comparable with wildtypes at 24 weeks of age, resulting in a more pronounced increase of non-heme iron between 12 and 24 weeks (Figure 1). When examining limbic structures, lower concentrations of non-heme iron were seen in IRP2-/- mice at 6 weeks in the hippocampus and all ages in the hypothalamus, as well as a transient reduction in the ventral striatum of the basal ganglia at 12 weeks (Figures 2 and 3). Motor regions, the cerebellum and brainstem, also demonstrated lower concentrations of non-heme iron at all ages in IRP2-/- mice. Additionally, lower non-heme iron levels in IRP2-/- were seen at the youngest age examined (6 weeks) in the frontal cortex, septum and entorhinal cortex; however, higher levels of non-heme iron were observed in the IRP2-/- parietal cortex at 24 weeks (data not shown).
3. Discussion
This study examined regional levels of loosely bound and non-heme iron in the brains of wildtype C57BL/6 mice and IRP2-/- mice at 6, 12, and 24 weeks of age. To our knowledge, this is the first examination of regional levels of distinct iron pools in the mouse brain using the MWR technique for preserving labile intermediates. Brain iron levels during development between the substrains of inbred C57BL/6 wildtype mice were very similar. The minor regional differences found may be attributed to several factors including housing conditions, food, and minor genetic differences between true substrains due to genetic drift in the form of different point mutations over many generations described between these two wildtype substrains (Silver, 1995; Bothe et al., 2004).
We found that loosely bound iron levels either remained constant or decreased with age in wildtype mice. It was lowest in the frontal cortex and brainstem and highest in the septum and dorsal striatum. This is consistent with Nelson et al. (2000) who found the highest levels of loosely bound iron in the caudate nucleus of rats. The regions found to contain high levels of loosely bound iron also correlate with regions reported as having little or no IRP2 staining in the brain (Leibold et al., 2001). They suggest that the little immunoreactivity for IRP2 in regions reported to be high in iron may be due to the more rapid turnover of IRP2. In contrast to loosely bound iron, we observed a general regional and age-dependent increase in non-heme iron in wildtype mice in agreement with reports of increasing levels of iron with development in rats (Roskams and Connor, 1994;Tarohda et a., 2004). This is reflected in the increase of non-heme iron in whole brain with age. The highest concentrations of non-heme iron were seen in the olfactory bulb, followed by the ventral striatum and septum.
Loosely bound iron levels were significantly lower in IRP2-/- mice compared to wildtype in the majority of brain regions at 6 weeks. However, due to mostly non-significant increases in IRP2-/-mice and decreases in wildtype mice, this difference largely disappears by 12 or 24 weeks. Yet, whereas loosely bound iron in the ventral striatum decreased with age in wildtype mice, it increased in IRP2-/- mice, and in whole brain remained constant in wildtypes while increasing in IRP2-/- mice. This is in support of previous findings by LaVaute et al. (2001), who describe axonal degeneration following ferric iron and ferritin accumulation in white matter tracts of the striatum and thalamus and a decrease in transferrin receptor 1 in IRP2-/- mice concomitant with a progressive neurodegenerative movement disorder. They postulate that this neurodegeneration may be due to iron deficiency from increased iron sequestration into overexpressed ferritin. However, since they examined mice older than that used in our study, future studies on older mice are needed to confirm whether the concentration of loosely bound continues to increase or levels off with age. Furthermore, while reporting a milder clinical phenotype without pathological signs of neurodegeneration in a different mouse model of IRP2 deficiency, Galy et al. (2006) also show decreased transferrin receptor 1 and increased ferritin expression in the brain. As it is generally accepted that there is an association between iron deficiency during early age and poor cognitive and motor development (Grantham-McGregor, et al., 2001) the observed deficiency in loosely bound iron in younger mice could set the stage for the described clinical symptoms in both strains of IRP2-/- mice.
The increase in non-heme iron seen in wildtype mice with age was also seen in IRP2-/- mice. However, the increase was slightly more pronounced due to lower levels of non-heme iron at younger ages in IRP2-/- mice. Levels become comparable by 24 weeks of age, which is best seen in whole brain analysis. Therefore, this is not in contrast to findings by Galy et al. (2006) who report no difference in non-heme iron levels in whole brain and cerebellum in their IRP2-/-mice at approximately twice the age of mice used in this study.
In this study, significant differences, although not dramatic, in iron levels and distribution were observed between wildtype and IRP2-/- mice with age. These results suggest that the redundancy in function in IRP1 serves to partly compensate for the absence of IRP2, which is consistent with mice lacking both IRP1 and IRP2 being embryonic lethal (Smith et al., 2006). We examined younger IRP2-/- mice to determine if changes in iron metabolism could be observed prior to the development of neurodegenerative symptoms and our findings are consistent with the report that IRP2-/- mice develop normally and symptoms are not seen until later in life (LaVaute et al., 2001). Little is known about the role of IRP2 on the regional homeostasis of the different pools of iron in the mouse brain. We were able to show that normal distribution of iron with development is at least in part dependent on functional IRP2.
We have further shown that loosely bound iron is regionally decreased in normal aging. This may be due to the higher utilization of iron during growth which gradually slows with further maturation. In contrast to non-transgenic mice, IRP2-/- mice demonstrated an increase in loosely bound and a more marked increase in non-heme iron with age in several brain regions which may be attributed to lower levels of iron at younger ages. These changes could indicate early alterations in iron metabolism that may possibly lead to neuronal dysfunction later in life. The results of this study have implications in elucidating the role of iron in normal neurological maturation and neurodegeneration.
4. Experimental Procedure
4.1. Mice
Transgenic mice with a targeted deletion of IRP2 (IRP2-/-) were bred at Taconic from the IRP2-/-strain generated at the NIH (LaVaute et al., 2001 - kindly provided by TA Rouault) and have a mixed genetic background of C57BL/6J and B129S4/SVJae mice in undefined proportions. As non-transgenic littermates were not available, we used C57BL/6 mice from Jackson Laboratories (BL/6J, Bar Harbor, ME). To address potential variations due to mouse origin and husbandry early in development we included C57BL/6 mice from Taconic Laboratories, BL/6NTac (BL/6NTac, Germantown, NY). Animals were bred at the respective company and then shipped to our local animal care facility where they were maintained until use. The 6 week old mice were shipped at 5.5 ± 0.5 (SD) weeks of age, 12 week old mice at 8.9 ± 0.3 weeks and 24 week old mice at 11 ± 2.7 weeks. All mice were housed and fed laboratory chow and tap water ad libitum according to standard animal care procedures. The iron content of chow at Taconic, Jackson Laboratories and our local animal care facility are 206, 345 and 345 mg/kg of food, respectively, and the iron content in the diet of dams prior to weaning was the same as that fed to the progeny. Experimental protocols were approved by the Institutional Animal Care and Use Committee of Loma Linda University in accordance with the National Institutes of Health Guide for the Care and Use of Laboratory Animals. Mice were analyzed at 6, 12, and 24 weeks, and all mice were male to eliminate effects of gender.
4.2. Preparation of brain tissue
Mice were anesthetized with Nembutal and the brains fixed with focused microwave irradiation (MWR) for 1s at 5 kW using the Muromachi Microwave Fixation System, Model TMW-6402C (Tokyo, Japan). Fixing brains with MWR preserves labile neurochemical compounds (Schneider et al., 1981). Metal measurements of mouse brains, quartered into right/left and rostral/caudal segments, comparing MWR with the methods of cardiac perfusion, cervical dislocation, decapitation, and drug overdose showed that MWR was best able to preserve brain loosely bound iron (Figure 4). After fixation, brains were rapidly dissected according to a novel microdissection protocol developed in our laboratory that allowed us to dissect 12 regions each from the right and left hemispheres including: olfactory bulb (OB), frontal cortex (FC), parietal cortex (PC), cerebellum (CB), hippocampus (HP), dorsal striatum (DS), ventral striatum (VS), septum (SP), thalamus (TM), hypothalamus (HY, which also included the substantia nigra), entorhinal cortex (EC), and brainstem (BS). Each region was identified according to the mouse brain atlas of Paxinos and Franklin (2000). Regions were weighed and processed immediately for the extraction of loosely bound and non-heme iron.
Figure 4.
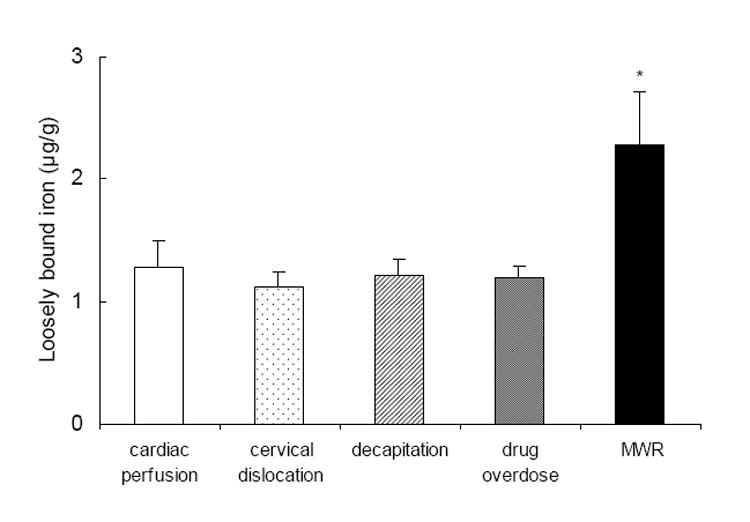
Concentrations of loosely bound iron (presented as mean ± SD) in whole brains of C57BL/6 mice sacrificed by cardiac perfusion, cervical dislocation, decapitation, drug overdose, and MWR (n = 5 for each method). *p < 0.001 MWR vs all other methods.
4.3. Iron extraction and analysis
We extracted loosely bound and non-heme iron according to the method of Nelson et al. (2000) with slight modifications. To minimize trace metal contamination, polypropylene mortars and pestles (Kontes, Vineland, NJ) were used instead of glassware, and MilliQ water was used for all buffers. For loosely bound iron, tissues were homogenized in 180 μl of 0.5 mM EDTA, centrifuged at 13,000 × g for 10 min, and 34 μL of 20% trichloroacetic acid (TCA) in 0.5 mM EDTA was added to 120 μL of the supernatant. Then samples were vortexed, centrifuged again at 13,000 × g for 10 min, and the supernatant collected and stored at -20 °C. For non-heme iron, tissues were homogenized in 360 μL of 6% TCA /0.5 mM EDTA and incubated at 90 °C for 30 min. Then 0.7 ml of 0.5 mM EDTA was added, and samples were vortexed, centrifuged at 13,000 × g for 10 min and the supernatant collected and stored at -20 °C. Iron concentrations were measured in duplicate by graphite furnace atomic absorption spectrometry (GFAAS) with a SpectrAA 220Z (Varian, Victoria, Australia).
4.4. Statistical analysis
Data are presented as means ± SD or means ± S.E.M. Statistical analysis was performed using one-way ANOVA for each brain region and corrected for multiple comparisons using the Bonferroni post hoc test with SPSS 12.0.1 software. A p value of < 0.05 was chosen to indicate significance. “Whole brain” values in Tables 1 and 2 and Figure 1 were obtained by summing the individual regional values. This was possible as our regional dissection included all of the brain.
Because there were no significant differences in the levels of non-heme iron at any of the ages examined between the C57BL/6NTac and C57BL/6J mice with the exception of the olfactory bulb at 12 weeks of age and in loosely bound iron except for 4 out of 12 regions, mostly at 6 weeks of age, the two substrains were combined in subsequent analyses (Tables 1 and 2).
Acknowledgments
We want to thank Dr. TA Rouault, Dr. RL Levine, Dr. EA Leibold, Dr. MW Hentze and colleagues for suggestions on the manuscript. This work was supported by the National Institute on Aging, NIH, AG20948.
ABBREVIATIONS
- IRP1
iron regulatory protein 1
- IRP2
iron regulatory protein 2
- ROS
reactive oxygen species
- EDTA
ethylenediaminetetraacetic acid
- TCA
tricholoroacetic acid
- MWR
microwave irradiation
References
- Barnham KJ, Masters CL, Bush AI. Neurodegenerative diseases and oxidative stress. Nat Rev Drug Discov. 2004;3:205–214. doi: 10.1038/nrd1330. [DOI] [PubMed] [Google Scholar]
- Beard JL, Erikson KM, Jones BC. Neurobehavioral analysis of developmental iron deficiency in rats. Behav Brain Res. 2002;134:517–524. doi: 10.1016/s0166-4328(02)00092-x. [DOI] [PubMed] [Google Scholar]
- Bothe GWM, Bolivar VJ, Vedder MJ, Geistfeld JG. Genetic and behavioral differences among five inbred mouse strains commonly used in the production of transgenic and knockout mice. Genes Brain Behav. 2004;3:149–157. doi: 10.1111/j.1601-183x.2004.00064.x. [DOI] [PubMed] [Google Scholar]
- Bradbury MW. Transport of iron in the blood-brain-cerebrospinal fluid system. J Neurochem. 1997;69:443–454. doi: 10.1046/j.1471-4159.1997.69020443.x. [DOI] [PubMed] [Google Scholar]
- Doraiswamy PM, Finefrock AE. Metals in our minds: therapeutic implications for neurodegenerative disorders. Lancet Neurol. 2004;3:431–434. doi: 10.1016/S1474-4422(04)00809-9. [DOI] [PubMed] [Google Scholar]
- Galy B, Holter SM, Klopstock T, Ferring D, Becker L, Kaden S, Wurst W, Grone HJ, Hentze MW. Iron homeostasis in the brain: complete iron regulatory protein 2 deficiency without symptomatic neurodegeneration in the mouse. Nat Genet. 2006;38:967–969. doi: 10.1038/ng0906-967. [DOI] [PubMed] [Google Scholar]
- Glickstein H, El RB, Shvartsman M, Cabantchik ZI. Intracellular labile iron pools as direct targets of iron chelators: a fluorescence study of chelator action in living cells. Blood. 2005;106:3242–3250. doi: 10.1182/blood-2005-02-0460. [DOI] [PubMed] [Google Scholar]
- Grabill C, Silva AC, Smith SS, Koretsky AP, Rouault TA. MRI detection of ferritin iron overload and associated neuronal pathology in iron regulatory protein-2 knockout mice. Brain Res. 2003;971:95–106. doi: 10.1016/s0006-8993(03)02366-7. [DOI] [PubMed] [Google Scholar]
- Grantham-McGregor S, Ani C. A review of studies on the effect of iron deficiency on cognitive development in children. J Nutr. 2001;131:649–666. doi: 10.1093/jn/131.2.649S. [DOI] [PubMed] [Google Scholar]
- Gutteridge JM. Iron and oxygen radicals in brain. Ann Neurol. 1992;32:S16–21. doi: 10.1002/ana.410320705. [DOI] [PubMed] [Google Scholar]
- Gutteridge JM, Rowley DA, Halliwell B. Superoxide-dependent formation of hydroxyl radicals in the presence of iron salts. Detection of ’free’ iron in biological systems by using bleomycin-dependent degradation of DNA. Biochem J. 1981;199:263–265. doi: 10.1042/bj1990263. [DOI] [PMC free article] [PubMed] [Google Scholar]
- Hallgren B, Sourander P. The effect of age on the non-haemin iron in the human brain. J Neurochem. 1958;3:41–51. doi: 10.1111/j.1471-4159.1958.tb12607.x. [DOI] [PubMed] [Google Scholar]
- Halliwell B, Gutteridge JM. Oxygen toxicity, oxygen radicals, transition metals and disease. Biochem J. 1984;219:1–14. doi: 10.1042/bj2190001. [DOI] [PMC free article] [PubMed] [Google Scholar]
- Hentze MW, Muckenthaler MU, Andrews NC. Balancing acts: molecular control of mammalian iron metabolism. Cell. 2004;117:285–297. doi: 10.1016/s0092-8674(04)00343-5. [DOI] [PubMed] [Google Scholar]
- Hu J, Connor JR. Demonstration and characterization of the iron regulatory protein in human brain. J Neurochem. 1996;67:838–844. doi: 10.1046/j.1471-4159.1996.67020838.x. [DOI] [PubMed] [Google Scholar]
- Huang X, Moir RD, Tanzi RE, Bush AI, Rogers JT. Redox-active metals, oxidative stress, and Alzheimer’s disease pathology. Ann N Y Acad Sci. 2004;1012:153–163. doi: 10.1196/annals.1306.012. [DOI] [PubMed] [Google Scholar]
- Jacobs A. Low molecular weight intracellular iron transport compounds. Blood. 1977;50:433–439. [PubMed] [Google Scholar]
- Jeong SY, David S. Age-related changes in iron homeostasis and cell death in the cerebellum of ceruloplasmin-deficient mice. J Neurosci. 2006;26:9810–9819. doi: 10.1523/JNEUROSCI.2922-06.2006. [DOI] [PMC free article] [PubMed] [Google Scholar]
- Kagan VE, Kozlov AV, Tyurina YY, Shvedova AA, Yalowich JC. Antioxidant mechanisms of nitric oxide against iron-catalyzed oxidative stress in cells. Antioxid Redox Signal. 2001;3:189–202. doi: 10.1089/152308601300185160. [DOI] [PubMed] [Google Scholar]
- Kala SV, Hasinoff BB, Richardson JS. Brain samples from Alzheimer’s patients have elevated levels of loosely bound iron. Int J Neurosci. 1996;86:263–269. doi: 10.3109/00207459608986717. [DOI] [PubMed] [Google Scholar]
- Koeppen AH. A brief history of brain iron research. J Neurol Sci. 2003;207:95–97. doi: 10.1016/s0022-510x(02)00429-x. [DOI] [PubMed] [Google Scholar]
- LaVaute T, Smith S, Cooperman S, Iwai K, Land W, Meyron-Holtz E, Drake SK, Miller G, Abu-Asab M, Tsokos M, Switzer R, 3, Grinberg A, Love P, Tresser N, Rouault TA. Targeted deletion of the gene encoding iron regulatory protein-2 causes misregulation of iron metabolism and neurodegenerative disease in mice. Nat Genet. 2001;27:209–214. doi: 10.1038/84859. [DOI] [PubMed] [Google Scholar]
- Leibold EA, Gahring LC, Rogers SW. Immunolocalization of iron regulatory protein expression in the murine central nervous system. Histochem Cell Biol. 2001;115:195–203. doi: 10.1007/s004180000246. [DOI] [PubMed] [Google Scholar]
- Levenson CW, Tassabehji NM. Iron and ageing: an introduction to iron regulatory mechanisms. Ageing Res Rev. 2004;3:251–263. doi: 10.1016/j.arr.2004.03.001. [DOI] [PubMed] [Google Scholar]
- Maynard CJ, Cappai R, Volitakis I, Cherny RA, White AR, Beyreuther K, Masters CL, Bush AI, Li QX. Overexpression of Alzheimer’s disease amyloid-beta opposes the age-dependent elevations of brain copper and iron. J Biol Chem. 2002;277:44670–44676. doi: 10.1074/jbc.M204379200. [DOI] [PubMed] [Google Scholar]
- Nelson SR, Pazdernik TL, Samson FE. Measurement of loosely bound iron in brain regions using redox cycling and salicylate. Cell Mol Biol (Noisy-le-grand) 2000;46:649–655. [PubMed] [Google Scholar]
- Paxinos G, Franklin KBJ. The Mouse Brain in Stereotaxic Coordinates. 2. Academic Press; San Diego: 2000. [Google Scholar]
- Perry G, Sayre LM, Atwood CS, Castellani RJ, Cash AD, Rottkamp CA, Smith MA. The role of iron and copper in the aetiology of neurodegenerative disorders: therapeutic implications. CNS Drugs. 2002;16:339–352. doi: 10.2165/00023210-200216050-00006. [DOI] [PubMed] [Google Scholar]
- Roskams AJ, Connor JR. Iron, transferrin, and ferritin in the rat brain during development and aging. J Neurochem. 1994;63:709–716. doi: 10.1046/j.1471-4159.1994.63020709.x. [DOI] [PubMed] [Google Scholar]
- Rouault TA. The role of iron regulatory proteins in mammalian iron homeostasis and disease. Nat Chem Biol. 2006;2:406–414. doi: 10.1038/nchembio807. [DOI] [PubMed] [Google Scholar]
- Sayre LM, Perry G, Smith MA. Redox metals and neurodegenerative disease. Curr Opin Chem Biol. 1999;3:220–225. doi: 10.1016/S1367-5931(99)80035-0. [DOI] [PubMed] [Google Scholar]
- Schneider DR, Felt BT, Goldman H. Microwave radiation energy: a probe for the neurobiologist. Life Sci. 1981;29:643–653. doi: 10.1016/0024-3205(81)90016-3. [DOI] [PubMed] [Google Scholar]
- Silver LM. Mouse Genetics; Concepts and Applications. Oxford University Press; Oxford: 1995. [Google Scholar]
- Smith MA, Harris PL, Sayre LM, Perry G. Iron accumulation in Alzheimer disease is a source of redox-generated free radicals. Proc Natl Acad Sci U S A. 1997;94:9866–9868. doi: 10.1073/pnas.94.18.9866. [DOI] [PMC free article] [PubMed] [Google Scholar]
- Smith SR, Ghosh MC, Ollivierre-Wilson H, Tong WH, Rouault TA. Complete loss of iron regulatory proteins 1 and 2 prevents viability of murine zygotes beyond the blastocyst stage of embryonic development. Blood Cells Mol Dis. 2006;36:283–287. doi: 10.1016/j.bcmd.2005.12.006. [DOI] [PubMed] [Google Scholar]
- Smith SR, Cooperman S, Lavaute T, Tresser N, Ghosh M, Meyron-Holtz E, Land W, Ollivierre H, Jortner B, Switzer R, 3, Messing A, Rouault TA. Severity of neurodegeneration correlates with compromise of iron metabolism in mice with iron regulatory protein deficiencies. Ann N Y Acad Sci. 2004;1012:65–83. doi: 10.1196/annals.1306.006. [DOI] [PubMed] [Google Scholar]
- Tarohda T, Yamamoto M, Amamo R. Regional distribution of manganese, iron, copper, and zinc in the rat brain during development. Anal Bioanal Chem. 2004;380:240–246. doi: 10.1007/s00216-004-2697-8. [DOI] [PubMed] [Google Scholar]
- Todorich BM, Connor JR. Redox metals in Alzheimer’s disease. Ann N Y Acad Sci. 2004;1012:171–178. doi: 10.1196/annals.1306.014. [DOI] [PubMed] [Google Scholar]
- Wallander ML, Leibold EA, Eisenstein RS. Molecular control of vertebrate iron homeostasis by iron regulatory proteins. Biochim Biophys Acta. 2006;1763:668–689. doi: 10.1016/j.bbamcr.2006.05.004. [DOI] [PMC free article] [PubMed] [Google Scholar]