Abstract
We investigated the use of fluorescence lifetime imaging microscopy (FLIM) of a fluorescently labeled ATP analog (3′-O-{N-[3-(7-diethylaminocoumarin-3-carboxamido)propyl]carbamoyl}ATP) to probe in permeabilized muscle fibers the changes in the environment of the nucleotide binding pocket caused by interaction with actin. Spatial averaging of FLIM data of muscle sarcomeres reduces photon noise, permitting detailed analysis of the fluorescence decay profiles. FLIM reveals that the lifetime of the nucleotide, in its ADP form because of the low concentration of nucleotide present, changes depending on whether the nucleotide is free in solution or bound to myosin, and on whether the myosin is bound to actin in an actomyosin complex. Characterization of the fluorescence decays by a multiexponential function allowed us to resolve the lifetimes and amplitudes of each of these populations, namely, the fluorophore bound to myosin, bound to actin, in an actomyosin complex, and free in the filament lattice. This novel application of FLIM to muscle fibers shows that with spatial averaging, detailed information about the nature of nucleotide complexes can be derived.
INTRODUCTION
Muscle contraction is driven by molecular motors that adapt their energy utilization according to the demands made on them. At the molecular level, the rate constants controlling the biochemical steps in the actomyosin ATPase change according to the force exerted on, or by, the muscle (1).
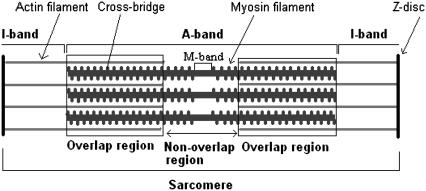
The repeating structures along the length of the muscle cells, the sarcomeres (Fig. 1), consist of interdigitating filaments of myosin and actin (2). In the region of overlap between myosin and actin filaments, which varies in length depending on the overall degree of stretch of the muscle (3), the globular protrusions of myosin molecules, the cross-bridges, interact cyclically with actin filaments during periods of muscle activity (4).
FIGURE 1.
Schematic representation of the sarcomere. The sarcomere is the repeating contractile unit delimited by the Z-disks; the I-band is formed by actin filaments which extend toward the middle of the sarcomere. Within the A-band, formed mainly by myosin filaments, we can distinguish the overlap region (delimited by a rectangle) where actin filaments interdigitate with myosin filaments and the nonoverlap region where actin is not present. As the sarcomere length increases, actin and myosin filaments slide over each other, and the degree of overlap decreases. The filaments' lengths are drawn approximately to scale, with myosin and actin filaments of 1.63 and 1.12 μm, respectively (13). At the drawn sarcomere length of 2.6 μm, 80% of the myosin filament length overlaps with the actin filaments.
Because the arrangement of proteins in the sarcomeres is highly regular, we were able to average the fluorescence signals emanating from specific regions of the sarcomeres and show that the environment of nucleotides, substrates, and products of the molecular motor ATPase is characteristic of the position of the nucleotide in the sarcomeres. By utilizing fluorescence lifetime imaging microscopy (FLIM) of fluorescently-labeled ADP analogs rather than intensity measurements, we were able to obtain novel information about the interaction of ADP with muscle proteins. Here we resolve nucleotide populations with lifetimes that are specific for myosin or actomyosin cross-bridges. The spatial distribution of nucleotide complexes, as judged by their fluorescence lifetimes, is sarcomere length dependent, as expected from the degree of overlap between thick and thin filaments.
The fluorescence lifetime reports the rate of decay of a fluorescent species from its excited state and in aqueous systems is usually in the range of pico- to microseconds. The lifetime can vary according to the local environment of the fluorophore (5), generally being longer when the fluorophore is bound to surfaces than when it is free in aqueous solution. The recent availability of convenient ultrafast lasers and measurement electronics for fluorescence lifetime imaging has given rise to a new spectroscopic tool that complements the more usual modalities, which are based on intensity or on excitation and emission spectra. Fluorescence lifetime measurement has an important advantage over the measurement of intensity, namely, that it is largely independent of fluorophore concentration. This means that the lifetime provides information about the fluorescence mechanism of the fluorophore and not about the number of molecules present in the field of measurement.
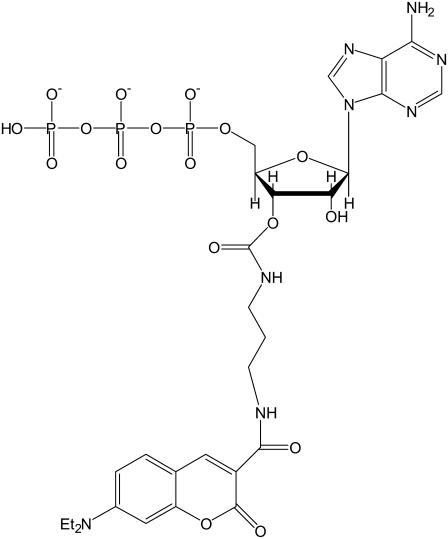
Here, we take advantage of this feature to probe the mode of binding of a fluorophore to myosin or actomyosin. The fluorescent molecule DEAC-pda-ATP (3′-O-{N-[3-(7-diethylaminocoumarin-3-carboxamido)propyl]carbamoyl}ATP) (Fig. 2) has association and dissociation rate constants comparable to those found for natural ATP in the presence of myosin S1 (6,7). The fluorescent moiety is linked to the 3′ position of the ribose ring via a three-carbon flexible linker, and we show that it has a slow interconversion rate between the 2′ and 3′ isomers. Crystal structures of different ATP analogs show that the 2′ and 3′ hydroxyl groups of the nucleotide project from the catalytic domain. Fluorophores attached to these positions are likely to lie on the surface of the protein, near the nucleotide-binding pocket (8). The pda linker appears to allow sufficient flexibility to the molecule not to interfere with its function. It is also likely that the fluorophore interacts with the surface of the myosin cross-bridge. Surface interactions as well as interactions with the solvent will affect the fluorescence lifetime of the molecule. We expect a change in the conformation of the nucleotide pocket to affect the local protein surface and therefore its interaction with the fluorophore. The longer-term aim of this work is to determine whether varying strain on the muscle affects the fluorescence lifetime of the bound nucleotide analog, which would indicate that strain directly affects the nucleotide binding site. This would demonstrate that there is a molecular mechanism for strain sensitivity of the actomyosin ATPase.
FIGURE 2.
Structure of DEAC-pda-ATP (3′-O-{N-[3-(7-diethylaminocoumarin-3-carboxamido)propyl]carbamoyl}ATP).
METHODS
Muscle fibers and experimental solutions
Bundles of muscle fiber segments were isolated from rabbit psoas muscle. New Zealand ex-breeder rabbits (>5 kg) were killed by an intravenous overdose of sodium pentobarbital (100–200 mg·kg−1), followed by dislocation of the spinal cord. The fibers were tied to wooden applicator sticks at in vivo rest length and permeabilized with glycerol as described previously (9). Muscle fiber bundles were stored at −22° in 50% glycerol for up to 8 weeks until use.
Before the experiments, an 8- to 10-mm-long single fiber segment was dissected from the bundles in relaxing solution (see Table 1 for solution composition) on a cooled stage (5°C) of a dissecting microscope. The fiber was mounted using aluminum T-clips on a stage consisting of a glass coverslip held in a stainless steel holder. One T-clip was hooked over a stainless steel wire hook attached to a screw manipulator, which was used to change sarcomere length. The other T-clip was glued to the coverslip. The sarcomere length of the fibers was adjusted to the desired value in relaxing solution. Next, the relaxing solution was changed for a low-tension calcium- and magnesium-free rigor solution in which the fiber was incubated for 2 min to remove ATP. The low-tension solution also contained 10 mM 2,3-butanedione 2-monoxime (BDM), which lowers rigor tension and maintains sarcomere order. Fluorescence measurements were carried out in a rigor solution containing 10 μM DEAC-pda-ATP and no other nucleotide in the absence of BDM. In this solution, the fiber was essentially in rigor, and actomyosin cross-bridges formed in the overlap region. As a negative control, a nonlabeled fiber in rigor solution was imaged to ensure that autofluorescence was not detected.
TABLE 1.
Solution composition
| Relaxing | Low-tension rigor | Rigor | |
|---|---|---|---|
| TES | 60 | 60 | 60 |
| ATP | 5 | – | – |
| Free Mg2+ | 2 | – | 2 |
 EGTA EGTA |
30 | 20 | 30 |
 EDTA EDTA |
– | 3 | – |
| KHPO4 | – | 20 | – |
| BDM | – | 10 | – |
Concentrations are in mM. The ionic strength was adjusted to 150 mM using potassium propionate; pH was adjusted to 7.1 using 5 M HCl and 5 M KOH. Abbreviations: ATP, adenosine triphosphate; BDM, 2,3-butanedione 2-monoxime; EDTA, ethylenediamine tetraacetic acid; EGTA, ethylene glycol-bis-(β-aminoethylether)-N,N,N′,N′-tetraacetic acid; TES, (N-tris[hydroxymethyl]methyl-2-aminoethanesulfonic acid.
Microscope and FLIM
An inverted Leica confocal TCS SP2 microscope (Leica Microsystems, Milton Keynes, UK) was used in these experiments together with a frequency-doubled, mode-locked Ti:sapphire laser (Spectra Physics, Mountain View, CA, model Mai-Tai) as the excitation source, delivering 120-fs pulses at a repetition rate of 80 MHz. The laser was tuned to provide a single-photon excitation wavelength of 428 nm, and the pulses were stretched to 10 ps in a glass block to reduce nonlinear photobleaching. Fluorescence lifetime imaging was implemented in the time domain using a Becker & Hickl time-correlated single-photon counting (TCSPC) module (SPC-730, Becker & Hickl GmbH, Berlin, Germany). A FLIM acquisition time of 3 min was typically used to obtain data sets of 256 × 256 pixels with 64 time bins. With an HCX PL APO CS 63× 1.20 n.a. water immersion objective and a zoom factor of 16, the image pixel size was 0.058 μm2, and the field of view contained six sarcomeres for a fiber with a sarcomere length of 2.41 μm. Images were acquired at 400 lines per second using a yellow glass long-pass 450-nm filter. All measurements were carried out at room temperature (22°C).
Data analysis
FLIM data were analyzed using SPCImage (Becker & Hickl GmbH), Excel Solver (Microsoft Office, Microsoft, Redmond, WA) and DISCRETE (10). DISCRETE is a Fortran program that analyzes exponential decays. The program provides statistical evaluation of the number of exponential components that can be measured in a decay curve. The fluorescence decay data were fitted by least-squares analysis (11) to a multiexponential decay
 |
(1) |
where I(t) is the intensity at time t, Ibaseline fits the background intensity, αi is the preexponential term or amplitude, and τi the fluorescence lifetime for the ith exponential component. In the first instance, to obtain the average lifetime change along the sarcomere, data were analyzed with SPCImage and fitted to a single exponential decay. For more detailed analysis, Excel Solver was used to fit up to three exponential terms to describe the fluorescence decay, and DISCRETE was used to estimate the number of components in each fluorescence decay.
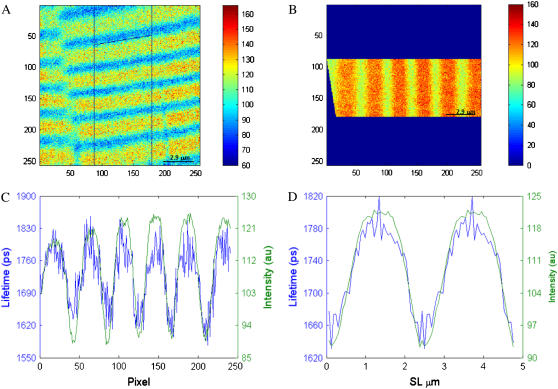
For a multiexponential fit, a large number of photons in each pixel is crucial; generally for a single exponential fit, the peak value of the exponential decay should have at least 100 photons, ∼1000 photons for a double, and 10,000 for a triple exponential decay (12), particularly if all lifetimes and amplitudes are unknown. To improve the statistical accuracy of the fitting process and increase the photon counts, spatial binning is usually increased with a concomitant degradation in the spatial resolution of the image. Acquisition times of 3 min yield fluorescence lifetime data with 200–800 photons at the peak of the decay, using an SPCImage binning factor (n) of 1 (n indicates the total number of surrounding pixels, [(2n + 1) × (2n + 1)], that are added to form the decay), which is inadequate to accurately fit a double or triple exponential decay. To overcome this problem, we took advantage of the spatially regular and repetitive structure of the fluorescence lifetime maps of sarcomeres. A region of interest from the raw data was chosen, taking special care to select an area in which all sarcomeres were well aligned. Then the photons for pixels in equivalent sarcomeric positions were added for every time gate, resulting in a series of time-gated one-dimensional images using a custom-written Matlab program. With this spatial averaging, many more pixels were binned (decays had over 3000 photons at the peak) than with the SPCImage binning, without loss of spatial resolution (Fig. 3).
FIGURE 3.
Data binning and lifetime averaging over one sarcomere. (A) An area of the raw data (formed by 256 × 256 pixels × 64 time gates) is selected, with care taken to select straight sarcomeres. (B) The region of interest is rotated so that the bands are vertical. The pixels for each column are added for every time gate resulting in a series of time-gated one-dimensional images. This enhanced data file is imported into SPCImage, and the fluorescence decay for each pixel is fitted to a single exponential decay to obtain the averaged lifetime value. The pseudocolor bars in images A and B represent intensity. (C) Variation in lifetime (blue line) and intensity (green line) with pixel number. These data can be further averaged over one sarcomere. (D) Lifetime and intensity variation over one sarcomere. The graphs correspond to the average of the sarcomeres shown in C. For ease of visualization two sarcomeres have been plotted.
To obtain the average lifetime, this enhanced data file was analyzed with SPCImage software fitting the pixels to a single exponential decay. Thus, the lifetime and intensity profiles were obtained by averaging lifetime and intensity data over one sarcomere.
For multiexponential fitting, the spatially averaged data were analyzed with Excel Solver considering several distinct ATP analog populations, each with a characteristic lifetime. A multiexponential function was fitted for each sarcomeric region to obtain the lifetime and amplitude of each ATP analog species. In the I-band, the sarcomeric region occupied by actin filaments alone, we considered two populations: free ATP analog (popF) and actin-, or nonspecifically bound analog (popA). Thus, the fluorescence decay times for pixels in the I-band were fitted to a double exponential function. Pixels in the nonoverlap region in the A-band were also fitted to a double exponential where we considered a population of free ATP analog (popF) and a myosin-bound population (popM). In the overlap region, we expected three populations: ATP analog bound to actomyosin (popAM), popF, and popA. Pixels in the overlap region were fitted to a triple exponential decay. DISCRETE was used to statistically evaluate the number of exponential components present in each sarcomeric region and compare it with the number of ATP populations assigned in each region as described above. The contribution of each species to the fluorescence was obtained from the normalized amplitude values.
Sarcomere length was measured from the intensity images with an image analysis program (MATLAB, The MathWorks, Natick, MA) using Fast Fourier Transform (FFT) to extract sarcomere length from the repeating sarcomeric structures. Filament overlap was calculated using a thin-filament length of 1.12 μm, a thick filament length of 1.63 μm, and a bare zone length of 0.16 μm (13).
RESULTS
Isomerization of the DEAC-pda-ATP
In the experiments described here, it is important that a single species of nucleotide is present because other species may well have different fluorescent properties. The 3′ isomer used may isomerize to the 2′ isomer, and the rate and extent of this were investigated using HPLC as previously described (6,7). At pH 8.0 (100 mM Tris/HCl) and 20°C, the observed rate was 0.03 h−1, and the equilibrium constant is ≥4 in favor of the 3′ isomer. At pH 7.0 (100 mM PIPES), the rate was 0.004 h−1 (9.6% conversion over 24 h). Thus, under the experimental conditions used here, there is unlikely to be any significant formation of 2′ isomer. Nevertheless, these rates are ∼7 times faster than those for the related ATP analog DEAC-eda-ATP (with eda being a linker one carbon atom shorter than pda). Webb and Corrie (7) reported rate constants for DEAC-eda-ATP of 0.004 h−1 at pH 8.0 (100 mM Tris/HCl), and 0.0006 h−1 at pH 7.0 (100 mM PIPES).
Fluorescence intensity and fluorescence lifetime
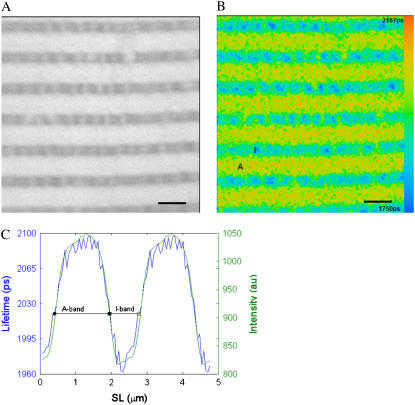
Muscle fiber segments incubated in rigor solution containing 10 μM DEAC-pda-ATP remained in rigor, and myosin- and actomyosin-bound DEAC-pda-ATP was hydrolyzed to DEAC-pda-ADP. Fig. 4 A shows the fluorescence intensity of a segment of muscle fiber incubated at room temperature (22°C) at a sarcomere length of 2.41 μm in a calcium-free rigor solution containing 10 μM DEAC-pda-ATP. Striations are seen, indicating that the fluorophore concentration in the I-bands of the sarcomeres (low-intensity bands) is lower than that in the A-bands (high-intensity bands). This is caused by nucleotide binding to actomyosin or myosin sites in the A-bands. Quantitative analysis of the intensity profiles showed that the I-band fluorescence was 63% that in the A-band and that A- and I-band fluorescence intensity did not depend on sarcomere length. The width of the high-intensity bands did not change with sarcomere length and had an average FWHM (full width at half-maximum) of 1.57 ± 0.11 μm (mean ± SD, n = 54 fibers). The nominal length of the myosin filaments in rabbit skeletal muscle is 1.63 μm.
FIGURE 4.
Fluorescence lifetime image of a muscle fiber incubated with 10 μM 3′-O-DEAC-pda-ATP. (A) Intensity image. (B) FLIM image, where the fluorescence decay for each pixel was fit to a single exponential decay. The color represents the decay lifetime according to the pseudocolor scale on the right side of the image. The I-band has an average lifetime of 1.98 ± 0.02 ns (mean ± SD, n = 13 pixels), and the A-band has an average lifetime of 2.07 ± 0.03 ns (n = 34 pixels). (C) Lifetime (blue line) and intensity (green line) profiles averaged over one sarcomere but displayed for two sarcomeres. The fiber has a sarcomere length (SL) of 2.41 μm (myosin filament overlap 90% with actin). A, A-band; I, I-band; scale bar, 2 μm.
The relative fluorescence intensity of the A- and I-bands is a function of the fluorescence quantum yield of the ATP analog and the fraction of nucleotide bound to actin, myosin, or actomyosin. In general, any factor that favors nonradiative processes (knr), such as collisional quenching or energy transfer, versus fluorescence emission (kr) decreases the quantum yield (Q) and consequently the lifetime (τ) (Eqs. 2 and 3). To accurately measure the amount of ATP bound to myosin or actomyosin it will be necessary to measure the quantum yield of the fluorescent ATP analog in muscle fibers, as the quantum yield of the chromophore is sensitive to its environment and could be different from that measured in solution experiments:
 |
(2) |
 |
(3) |
In the corresponding fluorescence lifetime map (Fig. 4 B), I- and A-bands of sarcomeres are seen, indicating that the averaged fluorophore lifetime of the I-band differs from that of the A-bands. For visualization purposes, the fluorescence lifetime maps were obtained by fitting the data assuming a single exponential decay, using a binning of 1 and assigning a color to each pixel according to its lifetime, using the color scale shown on the right side of the image.
Because of the repeating sarcomeric structure in the two-dimensional image, the sarcomeres were averaged as explained in the data analysis section to give a one-dimensional representation of fluorescence amplitude variation along the muscle fiber segment. The data were then fitted to a single exponential decay, with a SPCImage binning of zero (i.e., no spatial binning), to produce the averaged lifetime distribution for one sarcomere. The results of the averaging procedure are shown in Fig. 4 C. For ease of visualization, Fig. 4 C shows the lifetime and amplitude variation along two sarcomeres using a single exponential decay. The fluorescence lifetime varies along the sarcomere. The lifetime in the I-band is 1.98 ± 0.02 ns (mean lifetime of the I-band formed by 13 pixels), whereas it is longer in the A-band, 2.07 ± 0.03 ns (mean lifetime value of the A-band formed by 34 pixels), suggesting that fluorophore binding to myosin or actomyosin modifies its local environment and affects the fluorescence kinetics.
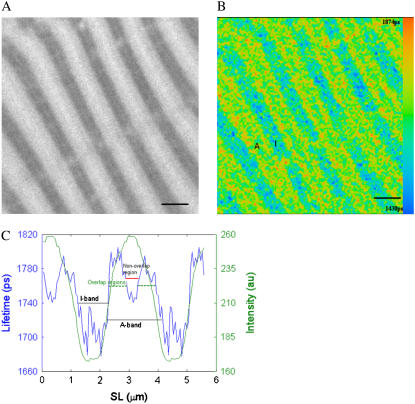
For stretched muscle fibers with sarcomere lengths in the range 2.6 to 3.5 μm, the profile in the A-band showed a zone of shorter lifetime in the center of the A-bands (Fig. 5), resulting in an M-shaped profile for the A-band lifetime. This central A-band region denotes the nonoverlap region at this sarcomere length. The shorter lifetime in the nonoverlap region of the A-bands compared to that in the overlap region indicates the characteristic lifetime of myosin-bound nucleotide compared to actomyosin-bound nucleotide. A closer look at the intensity profile of stretched muscle fibers revealed a slight increase in fluorescence in the center of the A-band (Fig. 5, A and C), which may account for the increased affinity of ATP for myosin binding rather than actomyosin.
FIGURE 5.
As for Fig. 4, but for a fiber with a SL = 2.80 μm (myosin filaments overlap of 65% with actin). (A) Intensity image; (B) FLIM image, assuming a single exponential decay; and (C) lifetime (blue line) and intensity (green line) profiles averaged over one sarcomere but displayed for two sarcomeres. The average lifetimes are: for the I-band 1.71 ± 0.02 ns (mean ± SD, n = 20 pixels), for the overlap region (green dashed line) in the A-band 1.78 ± 0.02 ns (n = 19 pixels), and for the nonoverlap region (red line) 1.75 ± 0.01 ns (n = 10 pixels). Scale bar, 2 μm.
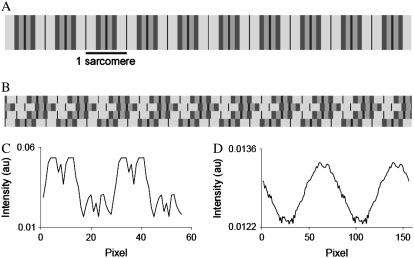
The M-shaped fluorescence lifetime profile of Fig. 5 C (blue line) was not seen in every fiber in the sarcomere length range 2.6 to 3.5 μm, and instead, a profile similar to Fig. 4 C for nonstretched fibers was obtained. This was attributed to misalignment or tilting of sarcomeres in the optical thickness of the fiber section, considering a z resolution for the TCS SP2 microscope of 290 nm (as indicated by the microscope manufacturers). To test this explanation, images of sets of “model” myofibrils were drawn (Fig. 6) and analyzed using the same procedure as that used for muscle fiber analysis. When myofibril images were well aligned, the “M” profile was seen (Fig. 6, A and C). When stagger between the myofibrils was introduced, the “M”-profile disappeared (Fig. 6, B and D). Stagger did not change the measured sarcomere length but did result in apparently shorter A- and I-band lengths. Stagger also decreased the lifetime difference between A- and I-bands. Care was taken to select fibers with no evidence of stagger and to limit stretching to <3.8 μm. The absence of stagger was established by ascertaining the length of the I- and A-bands from the fluorescence lifetime profiles.
FIGURE 6.
Diagram of myofibril bundles where the myofibrils are aligned or staggered. Different gray values were assigned to the I-bands and to the overlap and nonoverlap regions of the A-bands. (A) Fiber model where the myofibrils are aligned. (B) Fiber model in which the myofibrils are misaligned. (C) Average intensity profile of image A; the sarcomeres are well aligned within the region of interest, and the A-band shows a “M”-shaped profile. (D) Average intensity profile of image B; the “M” shape profile disappears as a consequence of the introduction of stagger between myofibrils.
The length of the nonoverlap region matches the length of the region of decreased lifetime. We evaluated the resolution of the imaging system used in these experiments by means of the Rayleigh criterion (14), which estimates the minimum resolvable distance between two points
 |
(4) |
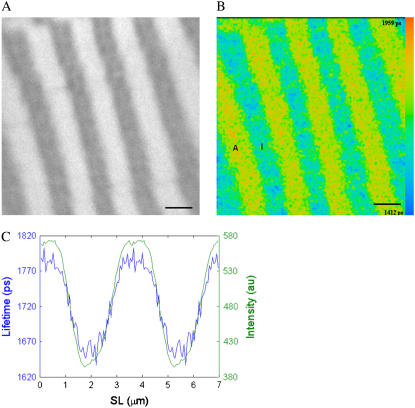
where d is Rayleigh criterion and λ is the wavelength of emitted light (475 nm for the fluorophore used in these experiments); with n.a., the numerical aperture of the objective, equal to 1.2 for our 63× water immersion objective. Under these conditions the minimum resolvable distance is 0.24 μm, and therefore, the nonoverlap and overlap regions in the A-bands could be resolved for sarcomeres between 2.47 μm and 3.39 μm. In our experiments we detected changes in lifetime between the overlap and nonoverlap region for sarcomere lengths between 2.65 μm (nonoverlap region of 0.42 μm) and 3.55 μm (overlap region in half of the A-band of 0.16 μm). For sarcomeres between 2.65 and 3.3 μm, the error measuring the nonoverlap region is within the Rayleigh criterion (±0.2 μm, n = 40 fibers), although for sarcomeres longer than 3.3 μm, the error in the computation of the nonoverlap region increases as a result of the small overlap (0.28 μm) between actin and myosin filaments. At sarcomere lengths >3.55 μm (Fig. 7), where little or no overlap exists between the thick and thin filaments, the “M” profile was not detected.
FIGURE 7.
Fluorescence lifetime image of a muscle fiber incubated with 10 μM 3′-O-DEAC-pda-ATP. Muscle fiber stretched to nearly beyond overlap between the thick and thin filaments (SL = 3.51 μm, 0.179 μm overlap for half of the A-band). (A) Intensity image; (B) FLIM image, assuming a single exponential decay; (C) lifetime (blue line) and intensity (green line) profiles averaged over one sarcomere. The I-band has an average lifetime of 1.68 ± 0.03 ns (mean ± SD lifetime value for the I-band formed by n = 33 pixels), and the A-band has an average lifetime of 1.77 ± 0.01 ns (n = 30 pixels). A, A-band; I, I-band; scale bar, 2 μm.
Analysis of individual lifetime and amplitudes for each population
Lifetime values presented above were obtained by fitting a single exponential function. This mode of analysis is useful because it can be used to provide a graphic representation of lifetime changes along the sarcomere (Figs. 3, 4, 5, and 7). General observation of the FLIM maps revealed differences in lifetime between the overlap and nonoverlap regions in the A-band and the I-band. However, the fit to the time course of fluorescence decay with a single exponential function was generally a compromise. Semilogarithmic plots of fluorescence decay were not linear (Fig. 8). Hence, the data were further analyzed in terms of a model in which we considered four distinct populations of fluorophore, each with a distinct fluorescence lifetime. These are 1), free fluorophore (popF); 2), nonspecifically bound fluorophore, perhaps actin-bound (popA); 3), myosin-bound fluorophore (popM); and 4), actomyosin-bound fluorophore (popAM). The choice of these populations is a compromise between the expected mix of fluorophore states and limiting their number to allow a quantitative treatment of the data, bearing in mind the limited number of photons available for reliable fitting of multiexponential decays.
FIGURE 8.
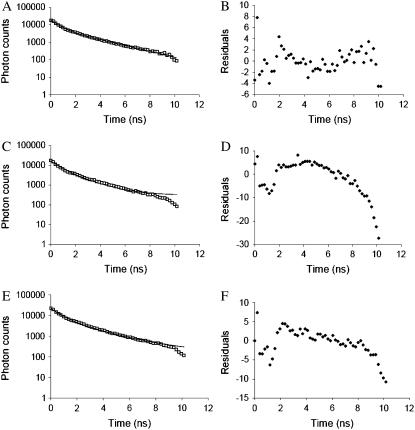
Multiexponential fitting for the different sarcomere regions of a fiber with SL of 2.80 μm. Data were obtained by the addition of several pixels from different sarcomeres to obtain decay lifetimes that are representative of the corresponding sarcomeric area. (A) I-band decay (□) and double exponential fit (solid line); τ (popF) = 0.64 ns, τ (popA) = 2.69 ns, R2 = 0.995. (B) I-band residuals. (C) Decay for the nonoverlap region (□), and double exponential fit (solid line); τ (popF) = 0.64 ns and τ (popM) = 1.72 ns, R2 = 0.994. (D) Residuals for the nonoverlap region. (E) Decay for the overlap region (□) and triple exponential fitting (solid line), with the lifetimes and amplitudes of popA and popF fixed to the values obtained in the fit shown in A; τ (popF) = 0.64 ns, τ (popA) = 2.69 ns, τ (popAM) = 1.41 ns, R2 = 0.994. (F) Residual for the overlap region. Data points from fiber segment shown in Fig. 5. Residuals were calculated as the difference between the data points and the fit divided by the standard deviation of each data point. These decays do not include correction for the IRF. The nonrandom residuals are attributed to the IRF.
Fig. 8 depicts the best-fit analysis for each sarcomeric region for a fiber at a sarcomere length of 2.8 μm; the quality of fits was evaluated by observation of the residuals (difference between experimental and fitted value divided by the standard deviation of each data point) representing deviations between measured and calculated data and by the reduced correlation factor (R2) values.
In the I-band only two ATP analog populations were considered: free fluorophore (popF) and actin-, or nonspecifically bound fluorophore (popA), as the absence of myosin means that popM and popAM do not exist in the I-band. The fluorescence decay for the I-band pixels was therefore fit to a double exponential (Fig. 8 A). To improve the statistics as well as the signal/noise ratio of the fitting, for each fiber the I-band decay was obtained after averaging data from several sarcomeres. The pixels included in the analysis were selected to avoid including those forming the edges of the I-band, which could contain fluorophore populations from neighboring sarcomeric region as a result of the PSF (point spread function) of the microscope. The decay obtained in this way was analyzed with DISCRETE. DISCRETE fitted the I-band to a double-exponential decay, supporting a model with two fluorophore populations in the I-band. The shorter lifetime was assigned to popF. This I-band analysis was repeated for 11 fibers, with sarcomere lengths in the range 2.6 to 3.5 μm. The average lifetimes for popF and popA were 0.64 ± 0.03 and 3.10 ± 0.21 ns (mean ± SE, n = 11 fibers), respectively. From the amplitude values, and considering a total fluorescence of 63% in the I-band compared to that in the A-band, the relative contributions of popF and popA to the I-band fluorescence were calculated. This revealed that 45% of the probe is free and 18% is bound to actin, related to 63% total intensity of the I-band versus a total intensity of 100% in the A-band. Analysis with Excel Solver where we specified two exponential decays and four degrees of freedom yielded the same lifetime and amplitude values.
Next, we considered the nonoverlap region in the center of the A-band, found at sarcomere lengths >2.6 μm. As in the case of the I-band, the fluorescence decay for the nonoverlap region was obtained by averaging several pixels from different sarcomeres. The best fit determined by DISCRETE was a double exponential. We arbitrarily assigned these two components to fluorophore populations: popF and a popM. The fluorescence lifetime of popF was already calculated, and its amplitude was expected to be similar to that found in the I-band. Therefore, the lifetime and amplitude of popF were assumed to be the same as those obtained for the I-band, thus reducing the number of free parameters to two, namely the lifetime and the amplitude of popM. Because DISCRETE does not allow fixing of parameters, the nonoverlap decay was analyzed with Excel Solver. The fitting procedure thus determined a lifetime for popM of 1.59 ± 0.06 ns (mean ± SE, n = 11 fibers), where 55% of the intensity was caused by the ATP analog bound to myosin, and 45% was caused by popF.
Finally, we considered the overlap region, where we considered three populations of fluorophores: popAM for fluorophores bound to actomyosin cross-bridges, popF, and popA. We considered that the contribution of popM to the decay in this region would be negligible, as virtually all myosin cross-bridges in the overlap region bind to actin at low nucleotide concentration. The averaged decay for the overlap region was obtained as mentioned previously for the I-band and nonoverlap regions. DISCRETE fitted this decay to a double exponential; however, after subtracting the popF component from the decay, DISCRETE fitted the remaining decay to a double exponential, thus providing some statistical rationale for fitting the decay in the overlap region to a triple exponential process, albeit with only two free parameters: amplitude and lifetime of popAM. Using the same procedure, when popF component was subtracted from the I-band region, DISCRETE fitted the remaining decay to a single exponential. The decay was analyzed with Excel Solver and fitted to a triple exponential, fixing the lifetime and amplitude values for popF and popA to those previously calculated. This yielded a lifetime value for popAM of 1.20 ± 0.05 ns (mean ± SE, n = 11 fibers) with a relative amplitude of 37%; popF and popA had a contribution of 45% and 18% respectively.
The residuals shown in Fig. 8, B, D, and F show a systematic deviation from random, characterized principally by a peak at ∼2 ns. This peak is attributed to the instrumental response function (IRF) of the FLIM microscope and TCSPC electronics assembly, which results in a deviation from exponential decay, seen in all experiments and controls. This peak becomes visible above the noise only when the image is spatially averaged and the increased photon counts provides a corresponding reduction in noise.
Attempts at correcting the decay curves for the IRF were only partially successful because the currently available fitting software cannot simultaneously incorporate the IRF and constrain the necessary fitting parameters. This more in-depth analysis will be the subject of further research; however, the assignment of values to distinct fluorophore populations is useful because it provides a testable model. The tailing off seen in the decay curves at times >9 ns is caused by the TCSPC electronics.
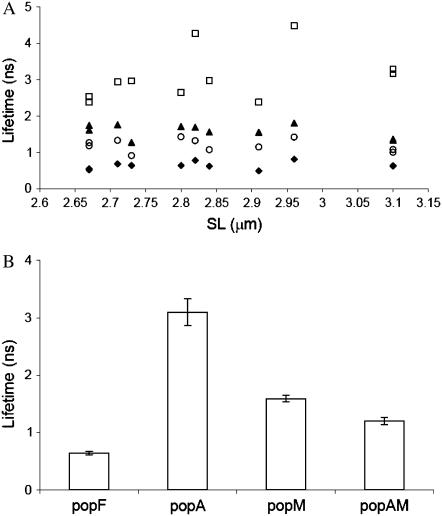
Fig. 9 shows the lifetime values for each population in each compartment, calculated for fibers of different sarcomere length. The fluorescence lifetime values were independent of sarcomere length (Fig. 9 A), as would be expected considering that the lifetime of the fluorophore reflects its interaction with the local environment. The mean lifetime values and the contribution of each species to the fluorescence for popF, popM, popA, and popAM are given in Table 2. The free analog in solution has a short lifetime, 0.64 ± 0.03 ns, and on binding to actin or myosin its lifetime increases. The lifetime of 1.20 ns when it is bound to the actomyosin complex increases to 1.59 ns or 3.10 ns when it is bound to myosin or actin, respectively. The longer lifetime of popM compared to the lifetime of popAM probably indicates that the quantum yield of the analog decreases when it is bound to actomyosin compared to when it is only bound to myosin. This could account for the slight increase in fluorescence intensity in the nonoverlap region (Fig. 5 C); however, solution experiments with acto-S1 will be necessary to test this hypothesis. Formation of the actomyosin complex induces conformational changes (15) in both myosin and actin proteins that could be responsible for the lifetime changes between the popM and popAM populations.
FIGURE 9.
(A) Lifetime variation with sarcomere length for the species popF (♦), popA (□), popM (▴), and popAM (○). (B) Lifetimes and standard errors values are: for free DEAC-pda-ATP, popF, 0.64 ± 0.03 ns; for actin-bound popA, 3.10 ± 0.21 ns; for myosin-bound popM, 1.59 ± 0.06 ns; and for actomyosin-bound popAM, 1.20 ± 0.06 ns. Lifetime values were measured for 11 different muscle fibers with sarcomere lengths between 2.6 and 3.1 μm.
TABLE 2.
Fluorescence lifetimes for fluorophore populations in three subsarcomeric compartments and contribution of each species to the total fluorescence in each band, considering that the fluorescence of the I-band is 63% of that found in the A-band
| I-band
|
Nonoverlap A-band
|
Overlap A-band
|
||||||
|---|---|---|---|---|---|---|---|---|
| DEAC-pda-ADP complex | % ATP analog | Lifetime (ns) | % ATP analog | Lifetime (ns) | % ATP analog | Lifetime (ns) | Solution experiment lifetime (ns) | |
| popF | Free | 45 | 0.64 ± 0.03 | 45 | 0.64 ± 0.10 | 45 | 0.64 ± 0.03 | 0.505 ± 0.004 |
| popA | Actin-bound | 18 | 3.10 ± 0.21 | – | – | 18 | 3.10 ± 0.21 | 1.11 ± 0.10 |
| popM | Myosin-bound | – | – | 55 | 1.59 ± 0.06 | – | – | 1.35 ± 0.09 |
| popAM | Actomyosin-bound | – | – | – | – | 37 | 1.20 ± 0.05 | – |
Values calculated for 20 fibers (mean ± SE).
Experiments with DEAC-pda-ATP free in solution or bound to actin or myosin S1 were carried out, and the fluorescence decays were analyzed with DISCRETE. The decay of the free DEAC-pda-ATP was fitted by DISCRETE to a single exponential decay with a lifetime of 0.505 ± 0.004 ns (mean ± SE). When the analog was in the presence of skeletal myosin S1, DISCRETE fitted the decay to a double exponential, where τ1 = 0.34 ± 0.01 ns and τ2 = 1.35 ± 0.09 ns (mean ± SE). These lifetime values are in relatively good agreement with the lifetimes found for the species popF (0.64 ns) and popM in muscle fibers (1.59 ns), in light of the fact that the local environment of the analog will be different in muscle fibers than it is in solution. For the solution experiment of DEAC-pda-ATP in the presence of actin, actin was first polymerized in the presence of normal ATP and then incubated in the presence of the ATP analog. DISCRETE fitted the decay to a double exponential decay with lifetime values of τ1 = 0.40 ± 0.01 ns and τ2 = 1.11 ± 0.10 ns (mean ± SE). τ2 is significantly smaller than the lifetime of popA (3.10 ns), which indicates that the analog may also bind to other I-band proteins such as titin or the Z-disk.
Solution experiments by Webb et al. and Webb and Corrie (6,7) showed a decrease in the quantum yield of DEAC-pda-ATP and DEAC-eda-ATP on binding of the analog to skeletal myosin S1 and an increase in quantum yield of DEAC-eda-ATP when bound to smooth myosin S1. In these experiments, the longer lifetime of DEAC-pda-ATP bound to myosin or actomyosin suggests an increase in quantum yield compared to when it is free in solution. How the quantum yield is affected by binding to myosin is not clear. However, it is affected by the experimental conditions and type of myosin used.
DISCUSSION
The experiments presented above are the first application of fluorescence lifetime imaging to investigate biochemical and functional properties of the actomyosin ATP binding site in skeletal muscle.
After incubation of the fibers with DEAC-pda-ATP, fluorescence intensity images revealed a striated pattern characteristic of the regular arrangement of sarcomeres along the fiber. Because of selective binding of the nucleotide to the myosin heads, where ATP is hydrolyzed, the A-band showed higher fluorescence intensity than the I-band. Fluorescence lifetime maps show that there are sufficient differences in the environment of the nucleotide analog when free in solution or bound to actin, myosin, or to the actomyosin complex to induce measurable changes in fluorescence lifetime. Thus, for sarcomeres between 2.6 and 3.5 μm long (Fig. 5), the nonoverlap region was distinguishable from the overlap region of the A-band by a zone of decreased lifetime in the middle of the A-band. The averaged intensity and lifetime profiles in Fig. 5 C reveal that this region was detectable only in the lifetime images and not in the intensity images, thus demonstrating the sensitivity of the FLIM method. The shorter lifetimes for the nonoverlap region of the A-band compared to that of the overlap region may reveal the different interaction of the ADP analog when bound to the actomyosin complex compared to when it is bound to myosin. However, misalignment of the sarcomeres within the imaged volume can mask the nonoverlap signal. To minimize this effect, muscle fiber segments with small cross-section area were chosen, and changes in muscle fiber length were applied slowly and with great care while in relaxing solution.
Multiexponential fitting allowed us to interpret our data speculatively in terms of the lifetimes of the different nucleotide analog populations present in our system, namely, free (popF), bound to actin (popA) or to other I-band components, bound to myosin (popM), and bound to the actomyosin complex (popAM; Table 2).
We describe a data analysis protocol for fluorescence lifetime measurements of skeletal muscle fibers in which the fluorescence lifetime decay in the I-band is fitted to a double exponential, based on a model that considers two fluorophore populations, namely popF and popA. On the same basis, the fluorescence decay in the nonoverlap region of the A-band was fitted to a double exponential based on the probability of finding two species: popF and popM. Theses decays were also analyzed by DISCRETE, which fitted these two decays to double exponentials, thus providing statistical justification for the use of double exponential fit.
The overlap region of the A-band was well described by a triple exponential (R2 = 0.997, two free parameters) but also by a double exponential decay (R2 = 0.998, four free parameters). A plausible framework for understanding of the lifetime decays is proposed in a model for which three potential distinct fluorophore populations are considered in the actin-myosin overlap region of the sarcomeres: popF, popA, and popAM. Analysis was thus presented for a triple exponential fit. When the overlap decay was analyzed with DISCRETE, the program fitted the data to a double exponential; however, subtraction of the fast component (popF) resulted in fluorescence decay that was best fit to a double exponential decay, according to DISCRETE statistical parameters, but higher-quality data are probably required for unequivocal fit to a triple exponential. Double exponential fitting for the decay in the overlap region produces a lifetime for the slow component that is different from that found in the nonoverlap region.
Although we have chosen a particular model and corresponding protocol to analyze the fluorescence decays and to explain lifetime changes, we do not exclude the possibility of describing the fluorescence lifetime changes by other methods such as a continuous distribution of lifetimes along the sarcomere rather than discrete lifetime values. However, the assignment of values to distinct fluorophore populations is useful because it provides a testable model. Here, we tested the sarcomere length distribution of the rate constants and found the model to be robust by this test. The attribution of distinct populations of fluorophores to each phase of the exponential decay is a convenient conceptual tool for further development of the method and for further experimentation. Nevertheless, the reliability of any fit is ultimately dependent on the signal/noise ratio and the number of photons available; therefore, further improvements of interpretation will depend on the availability of higher-quality data. The effect that the IRF may have on the fluorescence lifetime of popF, popA, popM, and popAM remains under investigation and dependent on the development of new software able to deconvolve the IRF from the fluorescence decays and appropriately constrain the fitted parameters for each of the lifetime populations.
The determination of the characteristic fluorescence lifetimes for myosin- and actomyosin-bound nucleotide species present in skeletal muscle fibers leads to the possibility of determining how muscle fiber strain influences the fluorescence lifetime of the actomyosin nucleotide complex, to demonstrate a direct effect of strain on the environment of the nucleotide binding site in the actomyosin cross-bridge. We hypothesize that strain transmitted to myosin cross-bridges bound to actin will directly affect the nucleotide binding site, thereby modifying the ATP analog environments, which will be reflected in changes in lifetime.
This FLIM study explores a new approach for investigating the structure/function relationship in muscle and in other cellular systems. We characterized the fluorescence lifetime properties of the DEAC-pda-ATP analog; however, other parameters such as polarization and wavelength shifts could provide additional spectroscopic dimensions that contain extra information about the biophysical environment of the ATP analog. Other fluorophores with different characteristics and different linker lengths may also provide fruitful investigations.
CONCLUSION
We have described the application of FLIM to the study of actomyosin interactions in skeletal muscle fibers. We characterized the fluorescence decay of DEAC-pda-ATP analog on interaction with rabbit psoas muscle fibers. Results show that FLIM provide contrast between the I-band and the nonoverlap and overlap regions of the A-band. Multiexponential fitting of the fluorescence decay provided a speculative characterization of different nucleotide analog populations; namely free, actin-bound, myosin-bound, and actomyosin-bound ADP. Taking advantage of the repetitive sarcomeric structure along the fiber for spatial averaging, we have been able to significantly increase the number of photons in the analysis of single sarcomeres without sacrificing spatial resolution or increasing sample photodamage or photobleaching. The sensitivity of the ATP analog to changes in the microenvironment provides a potential use of FLIM to study changes in the actomyosin complex during force generation steps in muscle.
Acknowledgments
We thank Gordon Reid (National Institute for Medical Research, London) for synthesizing nucleotides and measuring their isomerization.
Editor: Leepo C. Yu.
References
- 1.Potma, E. J., G. J. M. Stienen, J. P. F. Barends, and G. Elzinga. 1994. Myofibrillar ATPase activity and mechanical performance of skinned fibres from rabbit psoas muscle. J. Physiol. 474:303–317. [DOI] [PMC free article] [PubMed] [Google Scholar]
- 2.Squire, J. M. 1997. Architecture and function in the muscle sarcomere. Curr. Opin. Struct. Biol. 7:247–257. [DOI] [PubMed] [Google Scholar]
- 3.Huxley, H. E., and J. Hanson. 1954. Changes in the cross-striations of muscle during contraction and stretch and their structural interpretation. Nature. 173:973–976. [DOI] [PubMed] [Google Scholar]
- 4.Holmes, K. C. 1996. Muscle proteins—their actions and interactions. Curr. Opin. Struct. Biol. 6:781–789. [DOI] [PubMed] [Google Scholar]
- 5.Shih, W. M., Z. Gryczynski, J. R. Lakowicz, and J. A. Spudich. 2000. A FRET-based sensor reveals large ATP hydrolysis-induced conformational changes and three distinct states of the molecular motor myosin. Cell. 102:683–694. [DOI] [PubMed] [Google Scholar]
- 6.Webb, M. R., G. P. Reid, V. R. N. Munasinghe, and J. E. T. Corrie. 2004. A series of related nucleotide analogues that aids optimization of fluorescence signals in probing the mechanism of P-loop ATPases, such as actomyosin. Biochemistry. 43:14463–14471. [DOI] [PubMed] [Google Scholar]
- 7.Webb, M. R., and J. E. T. Corrie. 2001. Fluorescent coumarin-labeled nucleotides to measure ADP release from actomyosin. Biophys. J. 81:1562–1569. [DOI] [PMC free article] [PubMed] [Google Scholar]
- 8.Bauer, C. B., P. A. Kuhlman, C. R. Bagshaw, and I. Rayment. 1997. X-ray crystal structure and solution fluorescence characterization of Mg·2′(3′)-O-(N-methylanthraniloyl) nucleotides bound to the Dictyostelium discoideum myosin motor domain. J. Mol. Biol. 274:394–407. [DOI] [PubMed] [Google Scholar]
- 9.Thirlwell, H., J. E. T. Corrie, D. R. Trentham, and M. A. Ferenczi. 1994. Kinetics of relaxation from rigor of permeabilized fast-twitch skeletal fibers from the rabbit using a novel caged ATP and apyrase. Biophys. J. 67:2436–2447. [DOI] [PMC free article] [PubMed] [Google Scholar]
- 10.Provencher, S. W. 1976. A Fourier method for the analysis of exponential decay curves. Biophys. J. 16:28–41. [DOI] [PMC free article] [PubMed] [Google Scholar]
- 11.Baeda, M. G., and L. Brand. 1971. Time-resolved fluorescence measurements. Methods Enzymol. 61:378–425. [DOI] [PubMed] [Google Scholar]
- 12.Kollner, M., and J. Wolfrum. 1992. How many photons are necessary for fluorescence-lifetime measurements? Chem. Phys. Lett. 200:199–204. [Google Scholar]
- 13.Higuchi, H., T. Yanagida, and Y. E. Goldman. 1995. Compliance of thin filaments in skinned fibers of rabbit skeletal muscle. Biophys. J. 69:1000–1010. [DOI] [PMC free article] [PubMed] [Google Scholar]
- 14.Inoue, S. 1995. Foundations of confocal scanned imaging in light microscopy. In Handbook of Biological Confocal Microscopy. J.B. Pawley, editor. Plenum Press, New York. 1–18.
- 15.Cooke, R. 1997. Actomyosin interaction in striated muscle. Physiol. Rev. 77:671–697. [DOI] [PubMed] [Google Scholar]


