

Abstract
CD4+ T helper and CD8+ cytotoxic T lymphocyte responses are believed to play an important role in the control of primary HIV and SIV infection. However, the role of these cells in macaques acutely infected with SHIVsf162p3 has not been well characterized. In this study, ten adult rhesus macaques were intravaginally infected with SHIVsf162p3, and antigen specific cytokine responses to SHIV-Tat, Nef, Gag and Env peptide pools were examined through 70 days post inoculation (p.i.) using ELISPOT and/or cytokine flow cytometry (CFC). Peak plasma viral replication occurred between 14 and 21 days p.i., followed by low to undetectable plasma viremia by 70 days of infection in most macaques. Although some animals had strong virus-specific cellular immune responses, many had weak or minimal responses that did not correlate with the post peak decline in plasma viremia.
Keywords: Antigen specific T cells, cytokine flow cytometry, cell mediated immune responses, primary infection, SIV, SHIV, T cell, cytokines, ELISPOT, Rhesus macaque
INTRODUCTION
Control of plasma viremia in the acute stage of human immunodeficiency virus (HIV) and simian immunodeficiency virus (SIV) infection is temporally associated with the emergence of CD8+ cytotoxic T cell (CTL) responses (Borrow et al., 1994; Koup et al., 1994; Kuroda et al., 1999; Reimann et al., 1994). Moreover, depletion of CD8+ cells in macaques in primary SIV infection results in prolonged peak viremia, and CD8+ cell depletion in chronic SIV infection results in increased levels of plasma viremia, both of which are reversed coincident with the reappearance of circulating CD8+ cells (Schmitz et al., 1999). Thus, it is currently believed that virus specific CD8+ T cells are responsible for the initial control of peak plasma viremia in primary HIV and SIV infection.
SHIVsf162p3 has been reported to mimic natural HIV-1 infection in terms of CCR5 utilization, sustained viral replication and gradual CD4+ loss in peripheral blood followed in some cases, by development of simian AIDS, especially in animals inoculated with high doses (Harouse et al., 2001). However, following mucosal inoculation with a low intravaginal dose (300 TCID50) of SHIVsf162p3, most animals appear to “control” the infection, with peak viremia occurring between 14 to 21 days after infection followed by low to undetectable (<125 RNA copies/ml) viral loads in blood within 90 days of infection (Veazey et al., 2003a; Veazey et al., 2003c). Whether cell mediated immune responses are associated with this control as they appear to be in SIV or HIV infection, is not well defined. The present study was designed to determine whether the emergence or magnitude of SHIV-specific cytokine responses as detected by ELISPOT or cytokine flow cytometry (CFC) correlated with the reduction in viral loads in individual macaques infected with SHIVsf162p3.
RESULTS
Viremia
In two separate experiments, ten rhesus macaques were vaginally infected with 300 TCID50 SHIVsf162p3. All but one (AK46, of Indian origin) were Chinese-origin macaques. Three additional Chinese macaques were similarly intravaginally inoculated, but did not get infected as evidenced by consistently undetectable plasma viremia and absence of virus specific cellular immune responses, and these animals were used as concurrent controls for subsequent samplings. In infected animals, peak plasma viral replication (log10 5.5–8.0) was detected between 14 and 21 days post inoculation (p.i.). Viral loads declined in all infected animals thereafter except for FA87, whose viral load was maintained at higher levels (log10 6.0) through day 70 p.i. The remaining 9 infected macaques controlled viral replication to undetectable levels (<125 RNA copies/ml) at least transiently, between by 42 to 84 days p.i. (Fig. 1).
Figure 1.
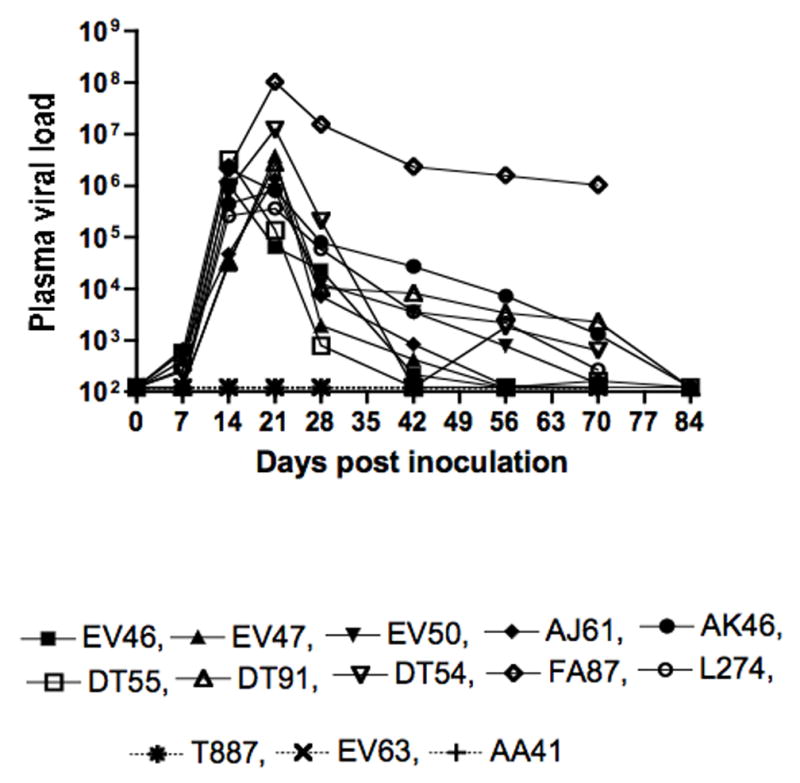
Plasma viral RNA levels from all SHIVsf162p3 inoculated animals. Ten animals became infected while three (T887, EV63 and AA41) did not. Data shown is from the day of inoculation (day 0) through 84 days post inoculation (p.i.). Note that viral loads were undetectable in 9 out of 10 animals by 84 days p.i.
Changes in CD4+ and CD8+ T cells in peripheral blood
All infected animals experienced transient lymphopenia corresponding with the onset of viremia. The absolute number of CD4+ and CD8+ T lymphocytes decreased significantly during the first two weeks of infection in infected macaques with a mean value of 1106 (day 0) vs 629 (day 14 p.i.) CD4+ cells/ul of blood, and 827 (day 0) vs 452 (day 14 p.i.) CD8+ cells/ul blood (p=0.012 and 0.014 for CD4 and CD8 respectively) (Fig. 2A). However, absolute numbers of CD4+ and CD8+ T cells rebounded to near (CD4+) or slightly above (CD8+) pre-infection levels by 21 days of infection and remained fairly stable thereafter (Fig. 2A). Persistently percentages of CD4+ cells resulted in increased percentages of CD8+ T cells after day 14 p.i., which remained at higher levels compared to baseline thereafter (Fig. 2B). The uninfected animals maintained relatively stable numbers and percentages of both CD4+ and CD8+ T cells throughout 70 days of follow-up (Fig. 2C and D).
Figure 2.
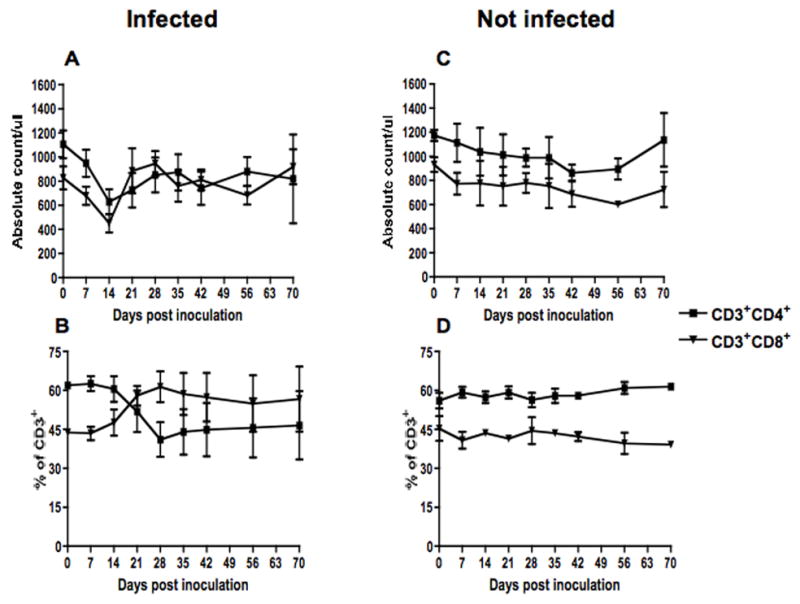
Absolute counts (top) and percentages (bottom) of CD4 and CD8 lymphocytes in peripheral blood of SHIVsf162p3 infected (A & B) (n=10) and uninfected (C & D) (n=3) macaques. Data presented are means ± standard errors of CD4 and CD8 T cells at different time points of infection.
Impact of SHIV infection on distribution of naïve and memory CD4+ T cell populations
Dynamics of naïve and memory CD4+ T cell populations were followed in three SHIVsf162p3 infected (DT54, L274 and FA87) and two uninfected (AA41 and T887) macaques. In infected macaques, there was a modest, selective depletion of absolute numbers of central memory (CD28+CD95+) CD4+ T cells from day 0 (484) to day 14 (278) which persisted through day 21 p.i.. Absolute counts of central memory increased after 21 p.i., but remained lower compared to baseline. In contrast, mean numbers of effector memory (CD28−CD95+) CD4+ T cells remained stable from day 0 (146/ul of blood) to day 28 p.i. (131/ul of blood) but decreased in later time points. (Fig. 3A). Naïve (CD28+CD95−) CD4+ T cells remained stable with mean values ranging from 182 to 320/ul of blood.
Figure 3.
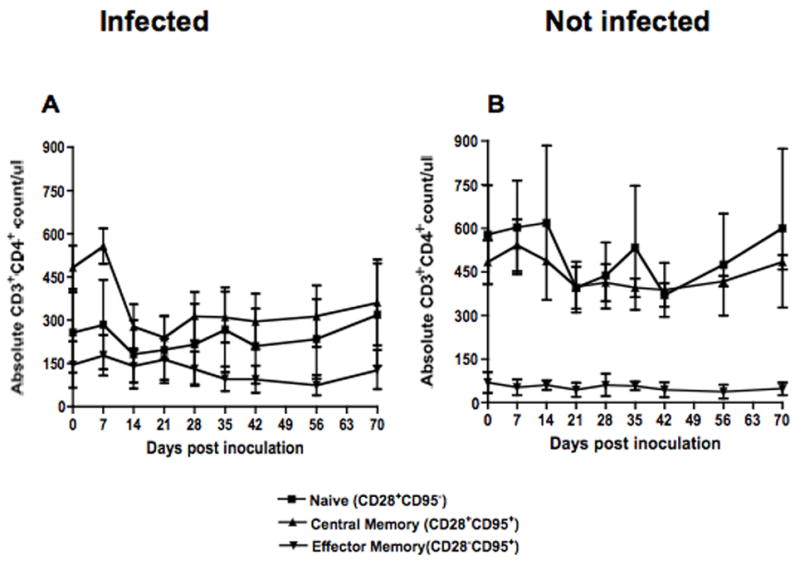
Absolute counts of naïve (CD28+CD95−), central memory (CD28+CD95+) and effector memory (CD28−CD95+) CD3+ CD4+ T cells in peripheral blood of SHIVsf162p3 infected (A) and uninfected (B) macaques after inoculation. Six-color flow cytometry was performed to define the cell populations as described in Table 1.
In contrast, uninfected macaques (n=2) maintained consistent levels of memory cell populations throughout this study (Fig. 3B). The mean counts of central memory and effector memory ranged from 388 to 591 and 39 to 70/ul of blood respectively. Interestingly, the animals that did not get infected also had higher absolute counts of naïve CD4+ T cells before infection compared to animals that became infected (Fig. 3), but with so few animals followed, the significance of this finding is uncertain.
T cell proliferation
The same 5 macaques (3 infected and 2 uninfected) were examined for Ki67 (proliferation antigen) expression. Increased proportions of CD4+CD95+ and CD8+CD95+ T cells expressing Ki67 were detected in SHIVsf162p3 infected macaques compared to uninfected macaques (Figs. 4A). An increased level of T cell proliferation was detected in both memory CD4 and CD8 T cells (5.5 vs 11% and 4.8 vs. 21.8% for CD4 and CD8 T cells respectively for day 0 to day 21 p.i.) from all three infected macaques (DT54, L274 and FA87) examined. By day 70 p.i., the expression of Ki67 by memory T cells returned to baseline levels. Mean increases in Ki67 expression were significantly increased in infected animals compared with uninfected controls at day 21 p.i. (Fig. 4A and B).
Figure 4.
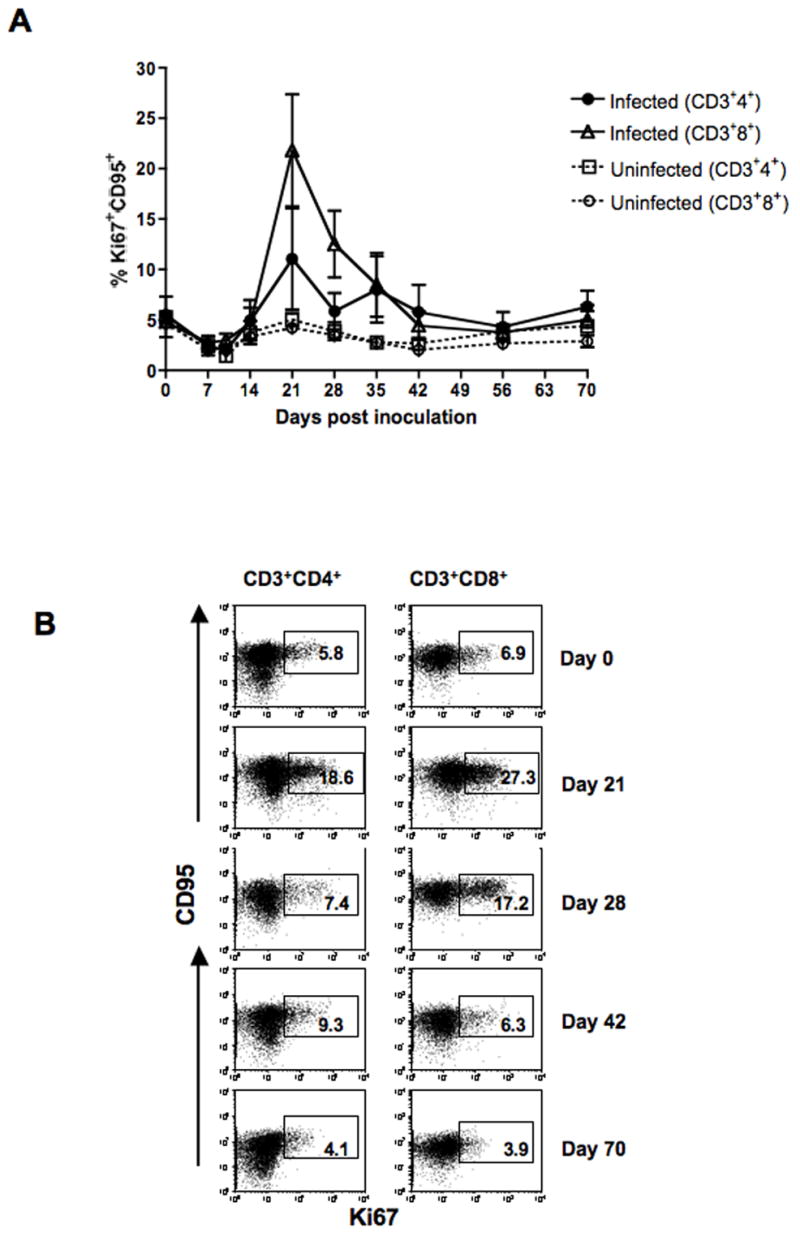
(A). T cell proliferation assessed by %Ki67 expression is shown for CD4+ and CD8+ T cells. Both CD4+ and CD8+ T cell proliferation increased following SHIVsf162p3 infection between 14 to 35 days post inoculation, but returned to baseline levels thereafter. (B). Representative expression of CD95 and Ki67 in CD4+ and CD8+ T cells in blood from a SHIVsf162p3 infected macaque (DT54). Percentages of Ki67+ CD95+ T cells in either CD4+ or CD8+ T cells are shown in the box of each dot plot. Six-color flow cytometry staining was performed to define proliferating T cells as described in Table 1.
To correlate CD4/CD8 T cell proliferation with plasma viral load, a linear regression analysis was performed. In all 3 SHIVsf162p3 infected macaques, CD8 proliferation positively correlated with plasma viremia (r2 ranged from 0.58–0.75, P value 0.005–0.029). However, CD4+ T cell proliferation correlated with viral load in only one macaque (DT54; r2=0.85, p=0.001). The other two (FA87 and L274) had either low (r2=0.31) or no correlation with CD4 T cell proliferation and viral load.
Antigen specific cytokine responses
We investigated the potential association between plasma viral load and antigen specific cytokine responses in all SHIVsf162p3 inoculated macaques. Representative CFC results for TNF-α and IFN-γ production by peptide specific CD8+ T cells are shown from a SHIVsf162p3 infected macaque (L274) in Fig. 5. In the first set of experiments, 7 macaques were infected, and virus –specific T cell responses were followed using ELISPOT for IFN-γ responses and CFC for TNF-α responses to Tat, Gag, and Env were examined (Fig. 6). One macaque (EV63) did not become infected as determined by consistent inability to detect plasma viremia and antigen specific T cell responses throughout the study period (data not shown). Individual virus-specific cytokine responses in relation to plasma viral load in each macaque are shown in Fig. 6.
Figure 5.
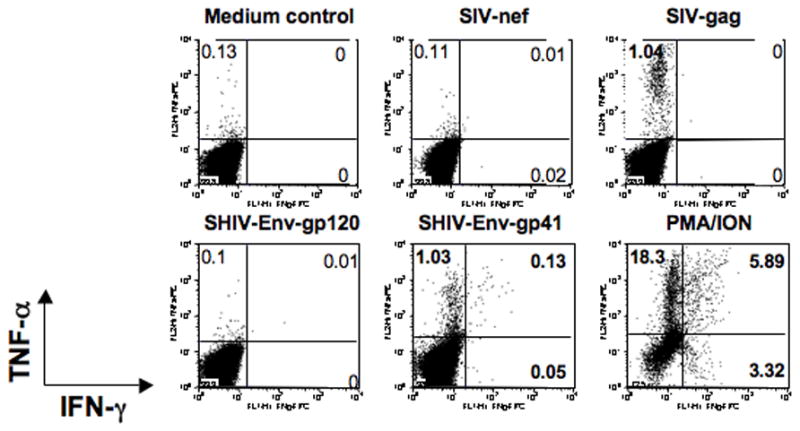
Intracellular cytokine flow cytometry for IFN-γ and TNF-α responses from a representative SHIVsf162p3 infected macaque (L274). PBMC were unstimulated (medium control), or stimulated for 6 h with different peptide pools at day 56 post inoculation. Cells were gated first on lymphocytes followed by CD3+ and then on CD8+ T cells. The percentages of IFN-γ and/or TNF-α positive cells are shown in each quadrant. Bold numbers represent positive responses. Four color CFC staining was performed to define antigen specific cytokine responses as described in Table 1.
Figure 6.
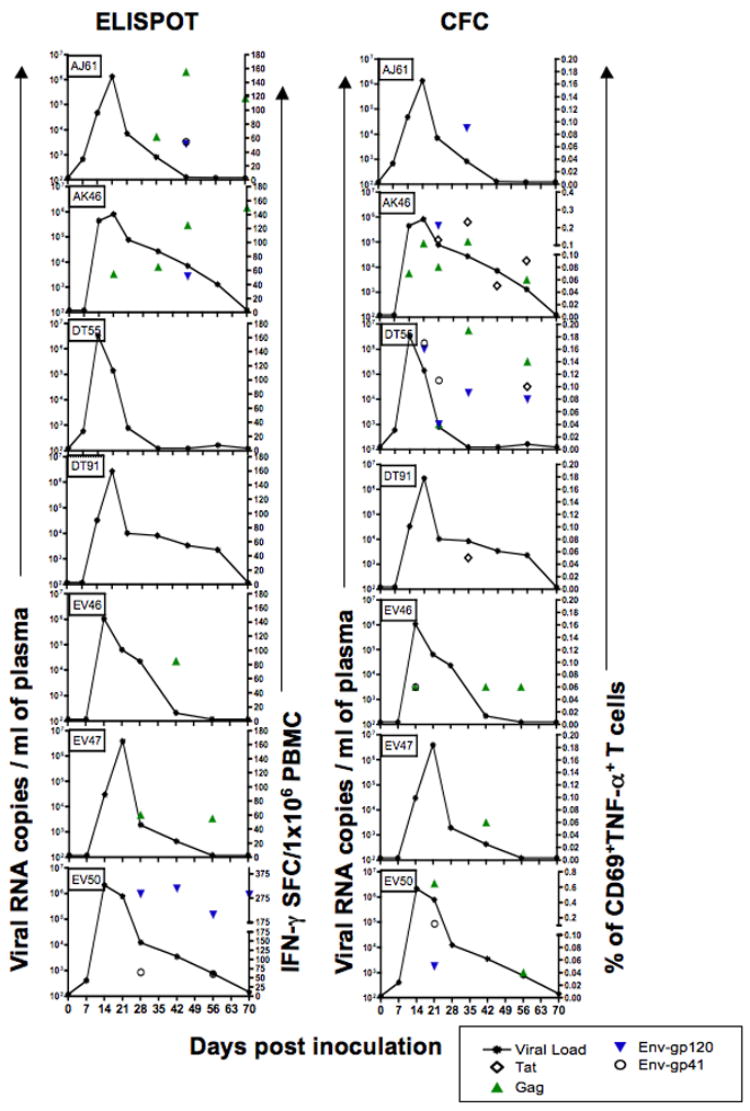
Plasma viral loads (line graphs) compared with SHIV-peptide specific T cell responses in seven SHIVsf162p3 infected macaques following intravaginal infection. ELISPOT responses (IFN-γ-SFC/1×106 cells) are shown on the left after stimulation with Tat, Gag and Env peptide stimulation (symbols). CFC data showing percentages of different antigen specific TNF-α+ T cells responding to peptide pools are shown in the right panels. Although all peptides were tested at each time point, only positive responses are shown. Note that while some animals (AK46, EV50) have persistent cellular responses to multiple peptides, other animals (DT91) have minimal responses, yet most animals have marked reductions in viral loads by 21 days of infection, regardless of the frequency or magnitude of cytokine responses tested.
In the second experiment, virus-specific combined IFN-γ and TNF-α responses to Tat, Gag, Env and Nef were examined by CFC alone in a group of 3 vaginally infected macaques (DT54, L274, and FA87). The individual CFC responses to all peptide pools in relation to plasma viremia for these animals are shown in Fig 7. Two macaques simultaneously challenged with this group (AA41 and T887) did not become infected and never had detectable antigen specific cytokine responses throughout the course of the study (data not shown).
Figure 7.
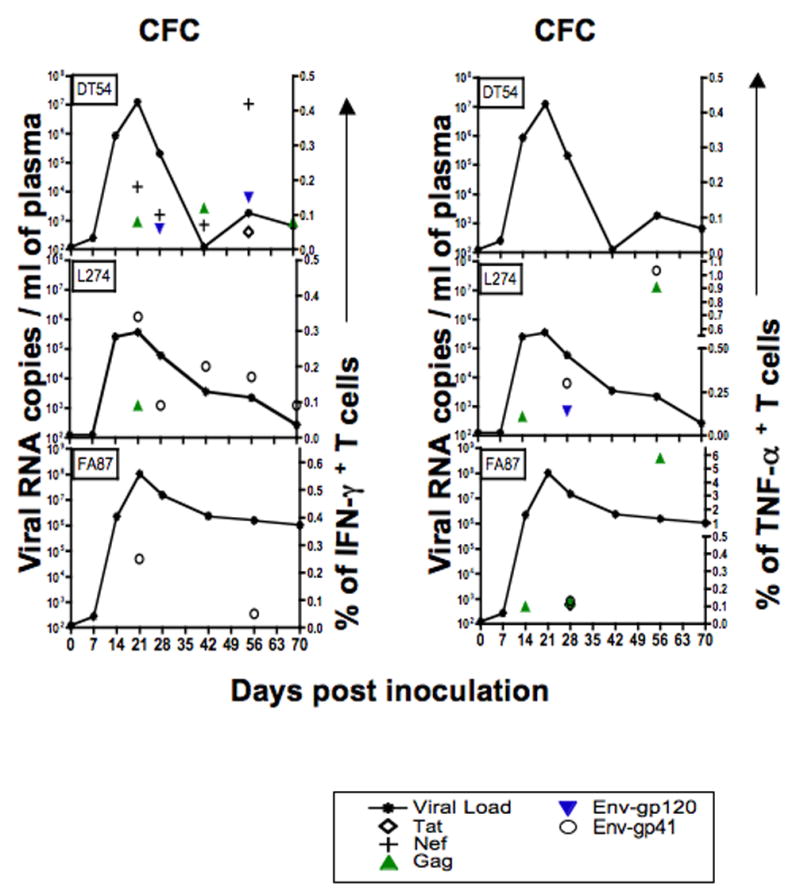
Plasma viral loads in relation to SHIV-specific T cell responses in three SHIVsf162p3 infected macaques after intravaginal infection. Panels were generated using CFC data and show plasma viral load (lines) compared with IFN-γ and TNF-α+ T cell responses after Tat, Nef, Gag and Env peptide stimulation (symbols). Although all peptides were tested at each time point, only positive responses are shown.
Overall, positive CFC responses were detected in 9 out of 10 infected animals examined using a CFC assay (Figs. 6 and 7) whereas two of seven infected macaques (DT55, DT91) never had a positive response by the ELISPOT IFN-γ assay (Fig. 6). Interestingly, positive responses were consistently detected earlier by the CFC assay as compared to the ELISPOT technique, as four of the 10 infected macaques (AK46, EV46, L274, and FA87) had TNF-α responses to Gag peptide pools 14 days after infection, and another two (DT55, EV50) had positive responses by 21 days of infection (Figs. 6 and 7). In contrast, of the seven infected animals examined by the ELISPOT IFN-γ assay, only one (DK46) had a detectable response prior to 28 days of infection (Fig. 6). In fact, the apparent greater sensitivity of the CFC assay was one reason why the ELISPOT technique was replaced by a two-cytokine CFC assay in the second series of experiments.
In all, nine of ten infected macaques (all except DT54) had detectable TNF-α responses by either CD4+ or CD8+ T cells at some time point (Table 2). The percentage of TNF-α+ responses ranged from 0.05–0.23, 0.04–5.79, 0.04–0.21 and 0.06–1.03 for Tat, Gag, gp120 and gp41 Env peptide pools respectively. In general, most of the TNF-α responses were from CD8+ T cells, but in two macaques (AK46 and EV46), the earliest TNF-α responses were detected in CD4+ T cells (Table 2). Two macaques (AK46, DT55) demonstrated strong or persistent TNF-α responses at multiple time points after infection. However, three macaques (AJ61, DT91 and EV47) only had a single detectable TNF-α response after infection. These animals had only one positive response to either gp120 (AJ61), Tat (DT91) or Gag (EV47) at day 42 p.i. with no positive responses to any other peptide throughout the course of infection. Gag peptides were found to be the dominant antigen in inducing TNF-α responses, followed by Env and Tat peptides (Table 3). Assays for testing Nef responses were only performed in the second group of animals, but one (DT54) of the three macaques tested had strong and persistent anti-Nef responses from day 14 through day 56 p.i. (Fig. 7). Finally, double positive (TNF-α+ and IFN-γ+ CD8 + T cell responses were detected in one off these three animals (L274) at day 28 and 56 post infection, but no double positive responses were detected in the other two animals at any timepoint (data not shown).
Table 2.
SHIV-specific TNF-α+ T cell responses of SHIVsf162p3 infected rhesus macaques *.
| Days post inoculation
|
||||||||||
|---|---|---|---|---|---|---|---|---|---|---|
| Monkey | Peptide pools | T cell phenotype | 0 | 7 | 14 | 21 | 28 | 42 | 56 | 70 |
| AJ61 | gp120 | CD8 | 0.09 | |||||||
|
| ||||||||||
| AK46 | Tat | CD8 | 0.13 | 0.23 | 0.05 | 0.09 | ||||
| Gag | CD4 | 0.07 | ||||||||
| CD8 | 0.11 | 0.08 | 0.12 | 0.06 | ||||||
| gp120 | CD8 | 0.21 | ||||||||
|
| ||||||||||
| DT55 | Tat | CD4 | 0.1 | |||||||
| Gag | CD4 | 0.09 | 0.14 | |||||||
| CD8 | 0.04 | 0.1 | ||||||||
| gp120 | CD4 | 0.08 | ||||||||
| CD8 | 0.16 | 0.04 | 0.09 | |||||||
| gp41 | CD4 | 0.08 | ||||||||
| CD8 | 0.09 | 0.11 | ||||||||
|
| ||||||||||
| DT91 | Tat | CD4 | 0.05 | |||||||
|
| ||||||||||
| EV46 | Gag | CD4 | 0.06 | |||||||
| CD8 | 0.06 | 0.06 | ||||||||
| gp41 | CD8 | 0.06 | ||||||||
|
| ||||||||||
| EV47 | Gag | CD4 | 0.06 | |||||||
|
| ||||||||||
| EV50 | Tat | CD4 | 0.04 | |||||||
| Gag | CD8 | 0.65 | ||||||||
| gp120 | CD8 | 0.05 | ||||||||
| gp41 | CD8 | 0.12 | ||||||||
|
| ||||||||||
| L274 | Gag | CD8 | 0.11 | 0.91 | ||||||
| gp120 | CD8 | 0.14 | ||||||||
| gp41 | CD8 | 0.3 | 1.03 | |||||||
|
| ||||||||||
| FA87 | Tat | CD8 | 0.11 | |||||||
| Gag | CD8 | 0.10 | 0.13 | 5.79 | ||||||
| gp41 | CD8 | 0.13 | ||||||||
Peptide–specific responses are reported for CD3+/CD4+ or CD3+/CD4− (CD8+) T cell subsets. Although all peptide pools (tat, nef, gag and env) were tested, only positive responses are shown.
Table 3.
Total number of SHIVsf162p3 infected animals with detectable SIV/HIV cytokine responses in the blood based with either ELISPOT or CFC assays
| Cytokines | Tat | Nef | Gag | gp120 | gp41 |
|---|---|---|---|---|---|
| IFN-γ | 1/10 | 1/3 | 6/10 | 4/10 | 4/10 |
| TNF-α | 4/10 | 0/3 | 7/10 | 5/10 | 5/10 |
IFN-γ ELISPOT responses in the 7 infected macaques tested using this technique ranged from 55–155 and 52–315 SFC/106 PBMC for Gag and Env peptide pools respectively (Fig. 6). No Tat specific IFN-γ responses were detected by ELISPOT in any animal at any time point. In 4 macaques (AJ61, AK46, EV46, and EV47), Gag peptides were the dominant antigens responsible for eliciting virus specific IFN-γ responses by ELISPOT (Table 3). In two macaques (EV46 and EV47), anti-Gag responses were detectable only at one (d 42) or two (d 28 and 56) time points (Fig. 6) by ELISPOT.
One macaque (DT55) that never had a positive IFN-γ ELISPOT response had strong and persistent TNF-α responses by CFC (Fig. 6). Conversely, macaque DT54 had no TNF-α responses, yet strong and persistent IFN-γ responses by CFC analysis (Fig. 6). Despite these exceptions, macaques with strong ELISPOT responses often had strong CFC responses (AK46, EV50) and weak responders by ELISPOT were also often weak by the CFC assay (DT91, EV47). However, note that macaque (AK46) had both strong and persistent IFN-γ and TNF-α responses, yet this was the animal with the highest viremia through 84 days of infection (Fig. 6). Using a Spearman rank correlation test, there was a positive correlation between viral load and Gag antigen specific TNF-α responses (p=0.01, r=0.79) in this macaque. Conversely, macaque DT91 had no positive ELISPOT responses and only a single weak Tat response at day 42 p.i., yet this animal effectively controlled viremia by 84 days p.i. Statistical analyses comparing the breadth and magnitude for all individual peptides as well as Tat, Nef, Gag and Env responses combined, failed to detect a statistically significant correlation with plasma viral loads and antigen specific cytokine responses in infected macaques.
DISCUSSION
In our experience, rhesus macaques of Chinese origin vaginally infected with relatively low doses (300 TCID50) of SHIVsf162p3 initially have high viral loads in primary infection, but in approximately 90% of animals, this is followed by low to intermittently undetectable plasma viremia within 70–90 days after infection. The purpose of this study was to determine if there was a correlation between this early decline in plasma viremia and the emergence or magnitude of virus-specific TNF-α or IFN-γ responses to Tat, Nef, Gag, or Env peptide pools using either ELISPOT or CFC techniques. Our hypothesis was that the emergence of antigen specific cytokine responses would correlate with the control of virus in the blood in this model. However, no such correlation could be detected in this study, at least with the techniques used.
Although a positive correlation between viral load and peptide specific cytokine responses were detectable in one animal, the frequency or magnitude of antigen specific responses did not positively correlate with control of viral loads in any animal (Fig. 6). Nine out of 10 infected macaques were able to effectively control plasma viral loads within 70 days of infection as evidenced by very low or undetectable (<125 copies/ml) plasma viral loads by this time point, yet this control was not associated with a clear pattern of virus specific immune responses (Figs 6 and 7). Moreover, the single Indian origin macaque had the most prominent immune responses of all animals, yet had higher viral loads post peak than all but one other animal through at least 56 days after infection (Fig. 6).
The comprehensive approach in this study showed that peptides from all the major SHIV proteins may serve as targets for SHIV specific CD8+/CD4+ T cells, and that infected animals had a remarkable breadth and magnitude of virus specific T cell responses. This data clearly emphasize that the response to a single epitope is not predictive of the total T cell responses in an infected animal, at least in this model system.. Clearly the ELISPOT IFN-γ assay alone was not predictive of the decline in viral loads, as at least two animals (DT55 and DT91) were completely negative for virus specific responses at all time points by ELISPOT, despite comparable reductions in viral loads to other macaques with responses (Fig. 6). Although the emergence of cytokine responses correlated with the decline in viral load in some macaques, overall, neither the breadth, specificity, nor the magnitude of virus specific T cell responses correlated with reductions in plasma viral loads. Although it could be argued that 6 animals (AK46, DT55, EV50, DT54, FA87 and L274) had strong and persistent cytokine responses by either ELISPOT or CFC assay, four animals (AJ61, DT91, EV46 and EV47) had minimal or delayed antigen specific cytokine responses that were not detectable until after the decline in viremia. These findings are in agreement with a recent study in HIV-1 infected individuals (Addo et al., 2003). A similar lack of correlation has also been described between control of viral loads in HIV-1 infected patients and HIV-specific CD4+ and CD8+ T cell responses (Betts et al., 2001; Dalod et al., 1999). However, others have reported inverse correlations between HIV-1 specific CD8+ T cell responses and viral loads (Betts et al., 1999; Ogg et al., 1998; van Baalen et al., 1997). In the current study, antigen specific cytokine responses were detected as early as day 14 (4/10 macaques) and in the majority by day 21 (7/10 macaques) in SHIVsf162p3 infected Chinese rhesus macaques, which is in agreement with a recent study of SHIVsf162p3 infection in pig tail macaques (Macaca nemestrina) using similar assays for detecting cytokine responses to peptides (Batten et al., 2006). However, in the latter study, peak responses were detected at 2.5 weeks post-infection, a timepoint that was not examined in the current study. In addition, only 3 of 8 pigtailed macaques cleared SHIVsf162p3 infection whereas 9 of 10 Chinese macaques controlled infection in the current study. However, the differences in viral persistence could be attributed to the differences in the species of animal used and/or in the higher dose of the inoculum used in the pigtail macaques, so these results are difficult to directly compare.
Another recent study by Trunova et al compared cellular immune responses (by ELISPOT) in Indian origin rhesus macaques intravaginally inoculated with combinations of both SHIVSF162P3 (an R5 virus) and SHIVSF33A (an X4 virus) between animals inoculated with and without Depo-provera pre-treatment (Trunova et al., 2006). This study demonstrated higher peak and early viral loads, as well as delayed antiviral cellular immune responses in Depo-provera treated macaques as compared to animals inoculated with higher doses of the same viruses without pre-treatment with Depo-provera. The results suggested that this progestin-based contraceptive suppressed cellular immune responses resulting in the increased peak and acute viral loads (Trunova et al., 2006). Although the macaques in the current study were administered Depo-provera to increase rates of transmission, again, these data are difficult to compare directly, particularly since animals in the previous study were of Indian origin and dual infected. Regardless, it may be argued that the use of depo-provera in the current study delayed or suppressed cellular immune responses in these animals. However, the fact that viral loads still significantly declined post peak viremia, despite weak to absent immune responses in most animals at these timepoints further supports the absence of a correlation between the post peak decline and emergence of cellular immune responses, at least as measured in this study. The data presented here indicate that on an individual basis, no specific correlation could be detected between the decline in plasma viremia and emergence or magnitude of a specific cellular immune response in the blood of Chinese origin macaques.
In our study, the most frequent responses detected were to SIV-Gag, with up to 70% of macaques recognizing this peptide pool, followed by responses to gp120, gp41, and lastly, Tat peptides. The major antigen specific cytokine producing cells were CD8+ with significantly fewer virus specific responses by CD4+ T cells. However, the variability and weak nature of the specific cytokine responses detected in most macaques showed no obvious correlation with the post peak decline in plasma viral load.
An analysis of peripheral blood T cell subsets in 3 macaques in this study revealed that the virus was selectively targeting central memory CD4+ T cells resulting in modest depletion of this subset. Like HIV and SIV, SHIVsf162p3 clearly utilizes CCR5 as its major coreceptor for infection of cells. It is now known that CCR5-tropic SIVs selectively deplete memory CD4+ T cells as CCR5 expression is largely restricted to memory T cells (Cromwell et al., 2000; Mattapallil et al., 2005; Picker et al., 2004; Veazey et al., 2003b). In contrast, naïve CD4+ T cells, which lack CCR5 expression, appear to escape destruction in acute/early CCR5-tropic SIV infection, even in animals with high viral loads that progress rapidly to AIDS (Picker et al., 2004).
An increase of CD4+ and/or CD8+ T cell proliferation (Ki67 expression) was also detected beginning ~2–3 weeks after infection, which is in agreement with the observations of others (Kaur et al., 2000; Monceaux et al., 2003; Picker et al., 2004; Rosenzweig et al., 1998). Increased Ki67 expression was higher in memory subsets of CD4+ and/or CD8+ T cells and since there was no depletion of CD8+ T cells, this suggests that this response was induced by infection-mediated immune stimulation, rather than a homeostatic response to T cell depletion. Proliferating memory CD8+ T cells might be playing an important role in controlling viral replication regardless of the loss of CD4+ T cells. However, using ELISPOT and CFC methods to detect TNF-α and/or IFN-γ responses to Tat, Nef, Gag, and Env peptide pools alone, we could not identify a correlation between virus specific cytokine responses and the post peak decline in plasma viremia in this animal model.
We have previously hypothesized that the peak viremia and subsequent decline in plasma viral loads following primary SIV/HIV infection is the result of initial infection of, and subsequent depletion of the large numbers of optimal viral target cells (memory CD4+CCR5+ T cells) that reside in the mucosal tissues of normal, uninfected patients (Veazey, Marx, and Lackner, 2001). Like HIV (Brenchley et al., 2004; Mehandru et al., 2004) and SIV (Li et al., 2005; Mattapallil et al., 2005; Veazey et al., 2000), infection with SHIVsf162p3 has been shown to rapidly deplete intestinal CD4+CCR5+ T cells in macaques (Harouse et al., 1999) which may also result in the post peak decline in viral loads in blood.
However, although we did not detect a direct correlation between declining plasma viremia and cytokine responses in this study, this does not rule out the possibility that CTL responses play a role in the post peak decline in plasma viremia. We only examined a limited number of virus specific immune responses and also did not examine responses to accessory proteins such as Vif, Pol, or Rev. This could be important particularly in the case of Chinese origin macaques, because unlike Indian origin macaques, the dominant MHC responses for Chinese macaques are still unknown. However, these data suggest that at least in this race of macaques, IFN-γ and TNF-α responses to Tat, Nef, Gag, and Env do not correlate with the early reduction in plasma viremia.
Additional other explanations for the reduction in post peak viral loads include the development of cellular immune responses in tissues other than the peripheral blood, particularly the intestine and other mucosal sites. In fact, a recent vaccination study demonstrated a better correlation with protection with mucosal rather than systemic CTL responses (Belyakov et al., 2006). Still other possible explanations for the early reductions in viremia in this model include induction of immune responses by effector cells not detected in these assays, such as perforin expressing cells, IL-2 responses, MIP-1β responses, or others. For example, recent studies of HIV-infected nonprogressors suggest that polyfunctional T cell responses (i.e., simultaneously measuring degranulation, IL-2, TNF-α, IFN-γ, and MIP-1β) provide a better correlation with decreased viremia and protection from disease progression (Betts et al., 2006). However, using the assays described here (ELISPOT and/or 1–2 cytokine flow cytometry) on peripheral blood lymphocytes, the results clearly demonstrate that neither IFN-γ nor TNF-α production by CD4 or CD8+ T cells alone correlates with control of viremia in early SHIVsf162p3 infection of rhesus macaques of Chinese origin.
MATERIALS AND METHODS
Animals and virus
Twelve adult female Chinese and one Indian (AK46) origin rhesus macaques (Macaca mulatta) between 5–15 years of age were examined in this study. Blood from additional naïve, uninfected macaques were often collected from other animals for controls. All animals were housed at the Tulane National Primate Research Center in accordance with the guidelines from the American Association for Accreditation of Laboratory Animal Care. All experiments were reviewed and approved by the Tulane University Institutional Animal Care and Use Committee. These animals were healthy and free from SIV, STLV and Type D retrovirus at the time of inoculation. In two separate experiments, all thirteen adult macaques were treated with Depo Provera (30 mg intramuscularly) and 4 weeks later inoculated vaginally with 300 TCID50 SHIVsf162p3 virus as previously described (Veazey et al., 2003a). All macaques used in this study were sham-inoculated controls for microbicide studies. Virus was obtained through the AIDS Research and Reference Reagent Program, NIAID, thawed, and diluted in RPMI with 10% fetal calf serum immediately prior to inoculation.
Eight 8 macaques were initially challenged with virus (7 of which became infected) and followed using 4-color flow cytometry and ELISPOT and CFC assays for detecting antigen specific IFN-γ and TNF-α T cell responses respectively. Heparinized and EDTA anticoagulated blood were collected at days 0, 7, 14, 21, 28, 35, 42, 56, 70 and 84 post viral inoculation.
The remaining five macaques (three of which became infected) were followed by 6-color flow cytometry for immunophenotyping and cytokine flow cytometry (CFC) for simultaneously detecting antigen specific IFN-γ and TNF-α cytokine responses.
Preparation of PBMC
For ELISPOT and cytokine flow cytometry assays, PBMC were isolated from heparinized whole blood by density gradient centrifugation (Lymphocyte Separation Medium, ICN Biomedicals, Ohio) as described elsewhere (Pahar et al., 2003).
Quantitation of plasma viral RNA
Viral RNA in plasma was quantified by a bDNA signal amplification assay, version 4.0, specific for SIV, from Bayer Inc., which has a threshold detection limit of 125 viral copies per ml plasma (Veazey et al., 2003a).
T cell phenotyping by four and six-color flow cytometry
For cell surface staining, 150 ul of EDTA whole blood was stained with directly-conjugated mAbs (listed in Table 1), using a whole blood lysis staining protocol (Veazey et al., 2003a). After staining, cells were fixed with 1% paraformaldehyde (Sigma) in PBS.
Table 1.
Antibodies and fluorochromes used for immunophenotyping T cells and intracellular cytokine flow cytometry.
| Panel | FITC1 | PE | PerCP/PE-Cy5 | PE-TR | APC | Alexa 405 |
|---|---|---|---|---|---|---|
| Immunophenotyping | ||||||
| A | CD20 | CD3 | CD8 | - | CD4 | - |
| Clone | (L27) | (SP34) | (SK1) | (L200) | ||
| B | CD3 | Ki67 | CD95 | CD8 | CD28 | CD4 |
| Clone | (SP34) | (B56) | (DX2) | (MHCD0817) | (28.2) | (L200) |
|
| ||||||
| CFC staining | ||||||
| C | IFN-γ | TNF-α | CD3 | - | CD4 | - |
| Clone | (4S.B3) | (Mab11) | (SP34) | (L200) | ||
| D | TNF-α | CD69 | CD3 | - | CD4 | - |
| Clone | (Mab11) | (FN50) | (SP34) | (L200) | ||
All monoclonal antibodies except CD8 PE-Texas Red (Caltag Lab, CA) were commercially obtained from BD Biosciences, CA. CD4-Alexa-405 was custom conjugated from BD Biosciences.
For Ki67 (intracellular) staining, cells were surface stained, washed, fixed and permeabilized with 1X fixation/permeabilization solution (BD Biosciences) for 10 min (Pahar, Lackner, and Veazey, 2006; Pitcher et al., 2002). Following two washes with Dulbecco’s PBS containing 0.1% BSA (dPBS/BSA) buffer, the cells were stained with anti-Ki67 mAb for 30 min at room temperature and finally resuspended in 1% paraformaldehyde solution.
Acquisition of data was performed using either a FACS Calibur or FACSAria Flow Cytometer using Cell Quest and FACSDiva software (BD Biosciences) respectively. Cells were gated through CD3+ “bright” T lymphocytes and at least 20,000 total events were collected from each sample. Data were analyzed using FlowJo software v. 6.0 (TreeStar). Absolute count of different phenotypic cell population was calculated based on CBC count and flow cytometry data.
Cytokine flow cytometry (CFC) assay
A CFC assay was employed to detect either CD3+/CD4+ or CD3+/CD4− (CD8+) T lymphocytes that produce either IFN-γ and/or TNF-α in response to antigen specific stimulation as discussed previously (Pahar et al., 2003; Waldrop et al., 1997). Briefly, fresh heparinized PBMC were resuspended at 1×10⁶ cells/ml and stimulated with different peptide pools (HIV-Tat, SIV-Nef, Gag and Env of SHIV) at a final concentration of 1ug/ml of each peptide. Peptides (15-mers with 11 amino acids overlap) derived from the HIV Tat, SIV-Nef, Gag and SHIVsf162p3 Env were obtained from NIH AIDS Research & Reference Reagent Program. Peptide pools were prepared so that each protein was equally represented in the pool. One peptide pool was made for each HIV Tat (peptide 1-23) and SIV-Nef (peptide 1-64) peptides. Three peptide pools (GagA: peptide 1-33; GagB: peptide 34-69; GagC: peptide 70-125) were made to encompass the entire Gag region of SIV. Similarly four peptide pools (EnvA: peptide 1-60; EnvB; peptide 61-124; EnvC: peptide 125-168; EnvD: peptide 169-211) were prepared to encompass the entire Env region of SHIVsf162p3. For positive controls PMA (50ng/ml) and Ionomycin (1ug/ml) were used. Negative controls had no antigen/mitogen stimulation. Co-stimulatory antibodies anti-CD28 (clone CD28.2, Pharmingen) and anti-CD49d (clone 9F10, Pharmingen), were added at 1 ug/ml in all the tubes including positive and negative controls. Brefeldin A (10 ug/ml, Sigma) was added to cultures after the first hour, in a 6 h incubation period. Following stimulation, the cells were stained first for surface staining and then for intracellular markers (listed in table 1) and finally resuspended in 1% paraformaldehyde as described earlier (Pahar, Lackner, and Veazey, 2006; Pahar, Li, and McChesney, 2005).
Data were acquired using a FACS Calibur flow cytometer and Cell Quest software (BD Immunocytometry Systems). 5 × 10⁴ CD3+/CD4+ events were acquired for each sample and data analysis was performed using FlowJo software (TreeStar Inc.) version 6.0. Gated CD3+ cells were analyzed as CD4+ and CD4− (CD8+) T cells, and the percentage of CD69+/TNF-α+ or TNF-α+/IFN-γ+ cells were calculated for both. Criteria for positive responses were determined based on the percentage of cytokine responses obtained from SIV seronegative animals, which were included in each experiment. For IFN-γ, the criteria for a positive response was determined when the frequency was at least twice that of the media control culture and greater than 0.05% or the presence of a distinct population cluster of IFN-γ+ bright cells. Since high frequencies of TNF-α positive cells were occasionally observed in media control cultures, a positive response for TNF-α was defined as a two-fold increase in antigen stimulated cultures above the control.
ELISPOT assay
The number of antigen-specific IFN-γ spot forming cells (SFC) in rhesus monkeys was measured with a commercial ELISPOT assay specific for rhesus IFN-γ (U-Cytech, Utrecht, The Netherlands). This assay was performed using fresh heparinized PBMC as previously described (Pahar et al., 2003; Van Rompay et al., 2004). Peptide pools of overlapping peptides (as described for CFC assay) from HIV-Tat, SIV-Gag and Env region of SHIVsf162p3 were also used for this study. Pooled peptides were added to cells at a final concentration of 1ug/ml for each individual peptide.
The numbers of spot forming cells were counted using the KS Elispot system (Zellnet Consulting Inc.). The mean number of spots per duplicate or triplicate well was calculated and the results were considered positive if the number of SFC for 2 × 10⁵ cells was ≥ 10 per well and greater than two-fold that of the negative control (medium only) wells plus 2 standard deviations.
Statistical analysis
Graphical presentation and statistical analysis of the results were performed by using the GraphPad Prism 4.0 (GraphPad Software Inc., SanDiego, CA). Correlation between viral loads and antigen specific cytokine responses were determined using Spearman rank correlation test and an analysis of variance (ANOVA) using prism software. Statistical comparison of viral load and peptide responses were performed for both individual peptides as well as the combined peptide responses in each animal. Difference in CD4 counts, phenotype etc were compared by Student’s t test. For all statistical analysis, results were considered significant if probability was <0.05 (i.e. p<0.05).
Acknowledgments
We thank Kelsi Rasmussen, Janell LeBlanc, Linda Green, Maryjane Dodd, and Nancy Parr for their technical assistance and Calvin Lanclos, Edmund Benes and Julie Bruhn for their expertise in operating the FACSAria and FACS Calibur instruments. The work was supported in part by NIH grants AI49080, AI065413, AI051649, RR00164, RR016930, RR019628, RR013466, RR018397 and RR012112.
Footnotes
Publisher's Disclaimer: This is a PDF file of an unedited manuscript that has been accepted for publication. As a service to our customers we are providing this early version of the manuscript. The manuscript will undergo copyediting, typesetting, and review of the resulting proof before it is published in its final citable form. Please note that during the production process errors may be discovered which could affect the content, and all legal disclaimers that apply to the journal pertain.
References
- Addo MM, Yu XG, Rathod A, Cohen D, Eldridge RL, Strick D, Johnston MN, Corcoran C, Wurcel AG, Fitzpatrick CA, Feeney ME, Rodriguez WR, Basgoz N, Draenert R, Stone DR, Brander C, Goulder PJ, Rosenberg ES, Altfeld M, Walker BD. Comprehensive epitope analysis of human immunodeficiency virus type 1 (HIV-1)-specific T-cell responses directed against the entire expressed HIV-1 genome demonstrate broadly directed responses, but no correlation to viral load. J Virol. 2003;77(3):2081–92. doi: 10.1128/JVI.77.3.2081-2092.2003. [DOI] [PMC free article] [PubMed] [Google Scholar]
- Batten CJ, De Rose R, Wilson KM, Agy MB, Chea S, Stratov I, Montefiori DC, Kent SJ. Comparative evaluation of simian, simian-human, and human immunodeficiency virus infections in the pigtail macaque (Macaca nemestrina) model. AIDS Res Hum Retroviruses. 2006;22(6):580–8. doi: 10.1089/aid.2006.22.580. [DOI] [PubMed] [Google Scholar]
- Belyakov IM, Kuznetsov VA, Kelsall B, Klinman D, Moniuszko M, Lemon M, Markham PD, Pal R, Clements JD, Lewis MG, Strober W, Franchini G, Berzofsky JA. Impact of vaccine-induced mucosal high-avidity CD8+ CTLs in delay of AIDS viral dissemination from mucosa. Blood. 2006;107(8):3258–64. doi: 10.1182/blood-2005-11-4374. [DOI] [PMC free article] [PubMed] [Google Scholar]
- Betts MR, Ambrozak DR, Douek DC, Bonhoeffer S, Brenchley JM, Casazza JP, Koup RA, Picker LJ. Analysis of total human immunodeficiency virus (HIV)-specific CD4(+) and CD8(+) T-cell responses: relationship to viral load in untreated HIV infection. J Virol. 2001;75(24):11983–91. doi: 10.1128/JVI.75.24.11983-11991.2001. [DOI] [PMC free article] [PubMed] [Google Scholar]
- Betts MR, Krowka JF, Kepler TB, Davidian M, Christopherson C, Kwok S, Louie L, Eron J, Sheppard H, Frelinger JA. Human immunodeficiency virus type 1-specific cytotoxic T lymphocyte activity is inversely correlated with HIV type 1 viral load in HIV type 1-infected long-term survivors. AIDS Research & Human Retroviruses. 1999;15(13):1219–28. doi: 10.1089/088922299310313. [DOI] [PubMed] [Google Scholar]
- Betts MR, Nason MC, West SM, De Rosa SC, Migueles SA, Abraham J, Lederman MM, Benito JM, Goepfert PA, Connors M, Roederer M, Koup RA. HIV nonprogressors preferentially maintain highly functional HIV-specific CD8+ T-cells. Blood. 2006 doi: 10.1182/blood-2005-12-4818. [DOI] [PMC free article] [PubMed] [Google Scholar]
- Borrow P, Lewicki H, Hahn BH, Shaw GM, Oldstone MB. Virus-specific CD8+ cytotoxic T-lymphocyte activity associated with control of viremia in primary human immunodeficiency virus type 1 infection. J Virol. 1994;68(9):6103–10. doi: 10.1128/jvi.68.9.6103-6110.1994. [DOI] [PMC free article] [PubMed] [Google Scholar]
- Brenchley JM, Schacker TW, Ruff LE, Price DA, Taylor JH, Beilman GJ, Nguyen PL, Khoruts A, Larson M, Haase AT, Douek DC. CD4+ T cell depletion during all stages of HIV disease occurs predominantly in the gastrointestinal tract. J Exp Med. 2004;200(6):749–59. doi: 10.1084/jem.20040874. [DOI] [PMC free article] [PubMed] [Google Scholar]
- Cromwell MA, Veazey RS, Altman JD, Mansfield KG, Glickman R, Allen TM, Watkins DI, Lackner AA, Johnson RP. Induction of mucosal homing virus-specific CD8+ T lymphocytes by attenuated simian immunodeficiency virus. J Virol. 2000;74:8762–8766. doi: 10.1128/jvi.74.18.8762-8766.2000. [DOI] [PMC free article] [PubMed] [Google Scholar]
- Dalod M, Dupuis M, Deschemin JC, Sicard D, Salmon D, Delfraissy JF, Venet A, Sinet M, Guillet JG. Broad, intense anti-human immunodeficiency virus (HIV) ex vivo CD8(+) responses in HIV type 1-infected patients: comparison with anti-Epstein-Barr virus responses and changes during antiretroviral therapy. J Virol. 1999;73(9):7108–16. doi: 10.1128/jvi.73.9.7108-7116.1999. [DOI] [PMC free article] [PubMed] [Google Scholar]
- Harouse JM, Gettie A, Eshetu T, Tan RC, Bohm R, Blanchard J, Baskin G, Cheng-Mayer C. Mucosal transmission and induction of simian AIDS by CCR5-specific simian/human immunodeficiency virus SHIV(SF162P3) J Virol. 2001;75(4):1990–5. doi: 10.1128/JVI.75.4.1990-1995.2001. [DOI] [PMC free article] [PubMed] [Google Scholar]
- Harouse JM, Gettie A, Tan RC, Blanchard J, Cheng-Mayer C. Distinct pathogenic sequela in rhesus macaques infected with CCR5 or CXCR4 utilizing SHIVs. Science. 1999;284:816–9. doi: 10.1126/science.284.5415.816. [DOI] [PubMed] [Google Scholar]
- Kaur A, Hale CL, Ramanujan S, Jain RK, Johnson RP. Differential dynamics of CD4(+) and CD8(+) T-lymphocyte proliferation and activation in acute simian immunodeficiency virus infection. Journal of Virology. 2000;74(18):8413–24. doi: 10.1128/jvi.74.18.8413-8424.2000. [DOI] [PMC free article] [PubMed] [Google Scholar]
- Koup RA, Safrit JT, Cao Y, Andrews CA, McLeod G, Borkowsky W, Farthing C, Ho DD. Temporal association of cellular immune responses with the initial control of viremia in primary human immunodeficiency virus type 1 syndrome. J Virol. 1994;68(7):4650–5. doi: 10.1128/jvi.68.7.4650-4655.1994. [DOI] [PMC free article] [PubMed] [Google Scholar]
- Kuroda MJ, Schmitz JE, Charini WA, Nickerson CE, Lifton MA, Lord CI, Forman MA, Letvin NL. Emergence of CTL coincides with clearance of virus during primary simian immunodeficiency virus infection in rhesus monkeys. J Immunol. 1999;162(9):5127–33. [PubMed] [Google Scholar]
- Li Q, Duan L, Estes JD, Ma ZM, Rourke T, Wang Y, Reilly C, Carlis J, Miller CJ, Haase AT. Peak SIV replication in resting memory CD4+ T cells depletes gut lamina propria CD4+ T cells. Nature. 2005;434(7037):1148–52. doi: 10.1038/nature03513. [DOI] [PubMed] [Google Scholar]
- Mattapallil JJ, Douek DC, Hill B, Nishimura Y, Martin M, Roederer M. Massive infection and loss of memory CD4+ T cells in multiple tissues during acute SIV infection. Nature. 2005;434(7037):1093–7. doi: 10.1038/nature03501. [DOI] [PubMed] [Google Scholar]
- Mehandru S, Poles MA, Tenner-Racz K, Horowitz A, Hurley A, Hogan C, Boden D, Racz P, Markowitz M. Primary HIV-1 infection is associated with preferential depletion of CD4+ T lymphocytes from effector sites in the gastrointestinal tract. J Exp Med. 2004;200(6):761–70. doi: 10.1084/jem.20041196. [DOI] [PMC free article] [PubMed] [Google Scholar]
- Monceaux V, Ho Tsong Fang R, Cumont MC, Hurtrel B, Estaquier J. Distinct cycling CD4(+)- and CD8(+)-T-cell profiles during the asymptomatic phase of simian immunodeficiency virus SIVmac251 infection in rhesus macaques. J Virol. 2003;77(18):10047–59. doi: 10.1128/JVI.77.18.10047-10059.2003. [DOI] [PMC free article] [PubMed] [Google Scholar]
- Ogg GS, Jin X, Bonhoeffer S, Dunbar PR, Nowak MA, Monard S, Segal JP, Cao Y, Rowland-Jones SL, Cerundolo V, Hurley A, Markowitz M, Ho DD, Nixon DF, McMichael AJ. Quantitation of HIV-1-specific cytotoxic T lymphocytes and plasma load of viral RNA. Science. 1998;279(5359):2103–6. doi: 10.1126/science.279.5359.2103. [DOI] [PubMed] [Google Scholar]
- Pahar B, Lackner AA, Veazey RS. Intestinal double-positive CD4+CD8+ T cells are highly activated memory cells with an increased capacity to produce cytokines. Eur J Immunol. 2006;36(3):583–92. doi: 10.1002/eji.200535520. [DOI] [PubMed] [Google Scholar]
- Pahar B, Li J, McChesney MB. Detection of T cell memory to measles virus in experimentally infected rhesus macaques by cytokine flow cytometry. J Immunol Methods. 2005;304(1–2):174–83. doi: 10.1016/j.jim.2005.07.018. [DOI] [PubMed] [Google Scholar]
- Pahar B, Li J, Rourke T, Miller CJ, McChesney MB. Detection of antigen-specific T cell interferon gamma expression by ELISPOT and cytokine flow cytometry assays in rhesus macaques. J Immunol Methods. 2003;282(1–2):103–15. doi: 10.1016/j.jim.2003.08.003. [DOI] [PubMed] [Google Scholar]
- Picker LJ, Hagen SI, Lum R, Reed-Inderbitzin EF, Daly LM, Sylwester AW, Walker JM, Siess DC, Piatak M, Jr, Wang C, Allison DB, Maino VC, Lifson JD, Kodama T, Axthelm MK. Insufficient production and tissue delivery of CD4+ memory T cells in rapidly progressive simian immunodeficiency virus infection. J Exp Med. 2004;200(10):1299–314. doi: 10.1084/jem.20041049. [DOI] [PMC free article] [PubMed] [Google Scholar]
- Pitcher CJ, Hagen SI, Walker JM, Lum R, Mitchell BL, Maino VC, Axthelm MK, Picker LJ. Development and homeostasis of T cell memory in rhesus macaque. J Immunol. 2002;168(1):29–43. doi: 10.4049/jimmunol.168.1.29. [DOI] [PubMed] [Google Scholar]
- Reimann KA, Tenner-Racz K, Racz P, Montefiori DC, Yasutomi Y, Lin W, Ransil BJ, Letvin NL. Immunopathogenic events in acute infection of rhesus monkeys with simian immunodeficiency virus of macaques. J Virol. 1994;68(4):2362–70. doi: 10.1128/jvi.68.4.2362-2370.1994. [DOI] [PMC free article] [PubMed] [Google Scholar]
- Rosenzweig M, DeMaria MA, Harper DM, Friedrich S, Jain RK, Johnson RP. Increased rates of CD4+ and CD8+ T lymphocyte turnover in simian immunodeficiency virus-infected macaques. Proc Natl Acad Sci. 1998;95:6388–6393. doi: 10.1073/pnas.95.11.6388. [DOI] [PMC free article] [PubMed] [Google Scholar]
- Schmitz JE, Kuroda MJ, Santra S, Sasseville VG, Simon MA, Lifton MA, Racz P, Tenner-Racz K, Dalesandro M, Scallon BJ, Ghrayeb J, Forman MA, Montefiori DC, Rieber EP, Letvin NL, Reimann KA. Control of viremia in simian immunodeficiency virus infection by CD8+ lymphocytes. Science. 1999;283(5403):857–60. doi: 10.1126/science.283.5403.857. [DOI] [PubMed] [Google Scholar]
- Trunova N, Tsai L, Tung S, Schneider E, Harouse J, Gettie A, Simon V, Blanchard J, Cheng-Mayer C. Progestin-based contraceptive suppresses cellular immune responses in SHIV-infected rhesus macaques. Virology. 2006;352(1):169–77. doi: 10.1016/j.virol.2006.04.004. [DOI] [PubMed] [Google Scholar]
- van Baalen CA, Pontesilli O, Huisman RC, Geretti AM, Klein MR, de Wolf F, Miedema F, Gruters RA, Osterhaus AD. Human immunodeficiency virus type 1 Rev- and Tat-specific cytotoxic T lymphocyte frequencies inversely correlate with rapid progression to AIDS. J Gen Virol. 1997;78 ( Pt 8):1913–8. doi: 10.1099/0022-1317-78-8-1913. [DOI] [PubMed] [Google Scholar]
- Van Rompay KK, Singh RP, Pahar B, Sodora DL, Wingfield C, Lawson JR, Marthas ML, Bischofberger N. CD8+-cell-mediated suppression of virulent simian immunodeficiency virus during tenofovir treatment. J Virol. 2004;78(10):5324–37. doi: 10.1128/JVI.78.10.5324-5337.2004. [DOI] [PMC free article] [PubMed] [Google Scholar]
- Veazey RS, Klasse PJ, Ketas TJ, Reeves JD, Piatak M, Jr, Kunstman K, Kuhmann SE, Marx PA, Lifson JD, Dufour J, Mefford M, Pandrea I, Wolinsky SM, Doms RW, DeMartino JA, Siciliano SJ, Lyons K, Springer MS, Moore JP. Use of a Small Molecule CCR5 Inhibitor in Macaques to Treat Simian Immunodeficiency Virus Infection or Prevent Simian-Human Immunodeficiency Virus Infection. J Exp Med. 2003a;198(10):1551–1562. doi: 10.1084/jem.20031266. [DOI] [PMC free article] [PubMed] [Google Scholar]
- Veazey RS, Ling B, Pandrea I, McClure H, Lackner AA, Marx PA. Decreased CCR5 expression on CD4+ T cells of SIV-infected sooty mangabeys. AIDS Res & Human Retroviruses. 2003b;19:227–233. doi: 10.1089/088922203763315731. [DOI] [PubMed] [Google Scholar]
- Veazey RS, Mansfield KG, Tham IC, Carville AC, Shvetz DE, Forand AE, Lackner AA. Dynamics of CCR5 expression by CD4(+) T cells in lymphoid tissues during simian immunodeficiency virus infection. J Virol. 2000;74(23):11001–7. doi: 10.1128/jvi.74.23.11001-11007.2000. [DOI] [PMC free article] [PubMed] [Google Scholar]
- Veazey RS, Marx PA, Lackner AA. The mucosal immune system: primary target for HIV infection and AIDS. Trends Immunol. 2001;22:626–633. doi: 10.1016/s1471-4906(01)02039-7. [DOI] [PubMed] [Google Scholar]
- Veazey RS, Shattock RJ, Pope M, Kirijan JC, Jones J, Hu Q, Ketas T, Marx PA, Klaase PJ, Burton DR, Moore JP. Prevention of virus transmission to macaque monkeys by a vaginally applied monoclonal antibody to HIV gp120. Nature Med. 2003c;9:343–346. doi: 10.1038/nm833. [DOI] [PubMed] [Google Scholar]
- Waldrop SL, Pitcher CJ, Peterson DM, Maino VC, Picker LJ. Determination of antigen-specific memory effector CD4+ T cell frequencies by flow cytometry. Journal of Clinical Investigation. 1997;99:1739–1750. doi: 10.1172/JCI119338. [DOI] [PMC free article] [PubMed] [Google Scholar]