

Abstract
A sensitive, reproducible, and robust high-performance liquid chromatography (HPLC) method has been validated for simultaneously determining total concentrations of the aminothiols homocysteine, cysteine, cysteinylglycine, and glutathione in human plasma. Plasma aminothiols are reduced via incubation with tris-(2-carboxyethyl)-phosphine hydrochloride, followed by protein precipitation with trichloroacetic acid and derivatization with ammonium-7-fluorobenzo-2-oxa-1,3-diazole-4-sulfonic acid. Separation of aminothiols and the internal standard mercaptopropionylglycine is achieved using reversed-phase HPLC conditions and fluorescence detection. Excellent linearity is observed for all analytes over their respective concentration ranges with correlation coefficients (r) > 0.99. The intra- and inter-day precision and accuracy were within ±10%. This method utilizes an internal standard, employs phosphate buffered saline-based standards and quality controls, and demonstrates excellent plasma recovery and improved sensitivity. This assay is well suited for high-throughput quantitative determination of aminothiols in clinical studies, and is currently being used to support investigations of oxidative stress in patients with chronic kidney disease.
Keywords: Aminothiols, homocysteine, cysteine, cysteinylglycine, glutathione, oxidative stress
1. Introduction
Low molecular weight thiol-containing amino acids, including the primary biological aminothiols homocysteine (HCY), cysteine (CYS), cysteinylglycine (CysGly), and glutathione (GSH) (Fig. 1) serve numerous vital functions in cellular biology, biochemistry, and pharmacology. Thiol groups (-SH) are critical intracellular and extracellular redox buffers which readily undergo oxidative coupling reactions to form disulfides (-S-S-). Typically, more than 90% of plasma thiols stores are protein bound, and of the remainder the majority are in the form of disulfides [1]. Moreover, thiol oxidation, and thiol-disulfide equilibrium in particular, has an important role in many enzymatic and transport processes, and hence is a significant determinant of protein structure and function [2]. Oxidative stress is considered to be an imbalance between oxidant production and antioxidant defense. An imbalance in favor of oxidant generation may lead to the oxidation of macromolecules and subsequent tissue damage [3]. Intracellular thiols such as GSH are essential in maintaining the highly reduced environment inside the cell, while extracellular thiols such as CYS also constitute an important component in antioxidant defense. Since the response of a cell to oxidative stress typically involves alterations in thiol content [4], plasma aminothiol concentrations are increasingly utilized for clinical and translational research involving oxidative stress [3], and for routine clinical diagnosis and monitoring of various human diseases and metabolic disorders [5,6]. Therefore, there is a need for fully validated, simple, precise and sensitive assays capable of simultaneously determining aminothiols in human plasma.
Fig. 1.
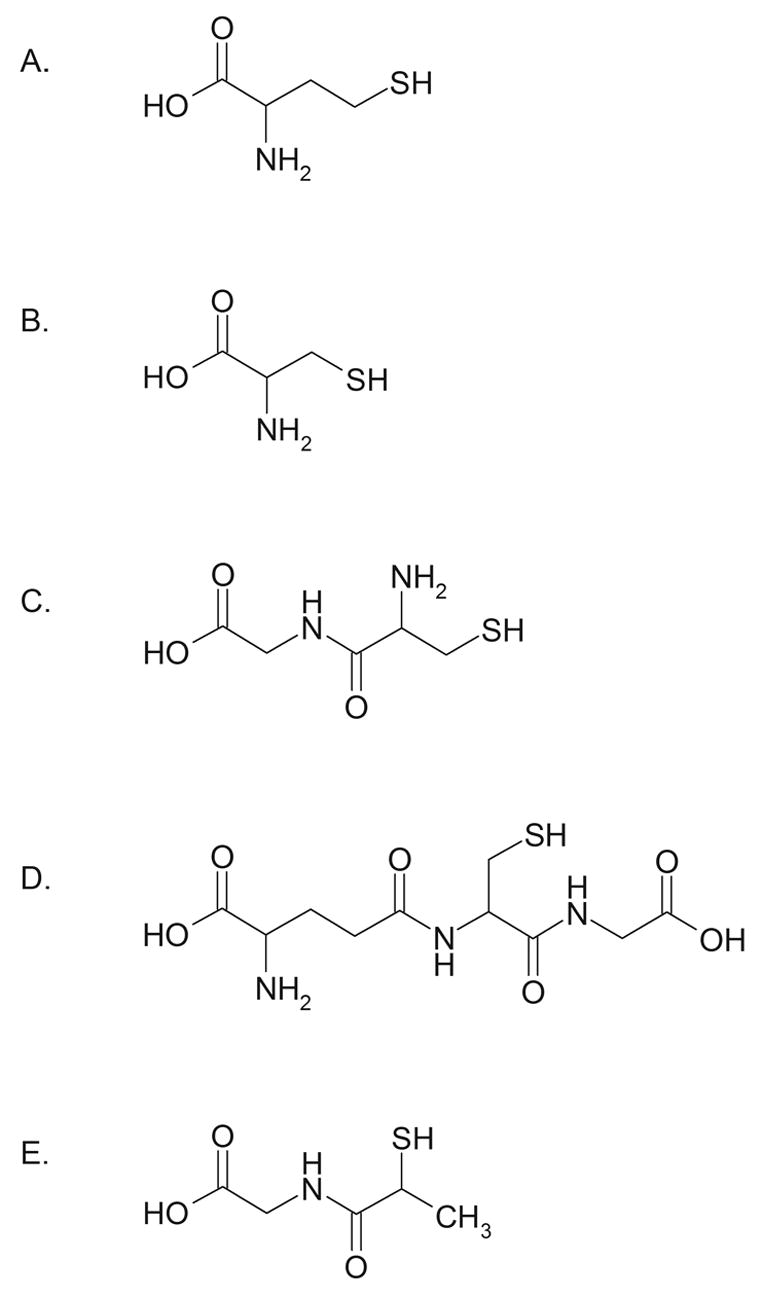
Structures of (A) HCY, (B) CYS, (C) CysGly, (D) GSH, and (E) MPG internal standard.
Numerous methods for the determination of thiols have been reported, including HPLC [7–21], gas chromatography–mass spectrometry [22], ion-exchange chromatography [23], and capillary electrophoresis [24]. Each of these methods has basic limitations in terms of equipment cost, complexity, sample processing and run times, number of thiols simultaneously quantitated, and/or validation parameters assessed which create challenges or render them impractical for high-throughput routine clinical or research purposes. Thus, the goal of this work was to establish, thoroughly validate, and implement a simple, reproducible, and robust method for simultaneously determining total concentrations of HCY (tHCY), CYS (tCYS), CysGly (tCysGly), and GSH (tGSH) in human plasma. The application of the method to a study of oxidative stress in clinical research subjects with chronic kidney disease is described.
2. Experimental
2.1. Chemicals
DL-homocysteine, L-cysteine, cysteinylglycine, L-glutathione, and N-(2-Mercaptopropionyl)-glycine reference standards, and trichloroacetic acid (TCA), ethylenediaminetatraacetic acid (EDTA), potassium tetraborate tetrahydrate, ammonium-7-fluorobenzo-2-oxa-1,3-diazole-4-sulfonic acid (SBD-F), and sodium acetate were purchased from Sigma (St. Louis, MO, USA). Tris-(2-carboxyethyl)-phosphine hydrochloride (TCEP), methanol, and water were obtained from EMD Biosciences (San Diego, CA, USA). Acetic acid was purchased from Fisher Scientific (Pittsburgh, PA, USA). All chemicals were HPLC grade or of the highest purity available.
2.2. Equipment and chromatographic conditions
The HPLC system consisted of a Waters 600S controller, Waters 626 pump, Waters 717 plus autosampler, and a Waters 474 fluorescence detector (Waters Corporation, Milford, MA, USA) with a 150W Xenon lamp. The detector was set at excitation and emission wavelengths of 385 nm and 515 nm, respectively, and a bandwidth of 18 nm. Signal output was captured with the Waters Empower Pro chromatography software (Waters Corporation, Milford, MA, USA). Separation of the analytes was achieved with a Waters Symmetry C18 guard column (3.9 mm × 20 mm; 5 μm particles) connected to a Waters Symmetry C18 analytical column (4.6 × 150 mm; 3.5 μm particles) at 29 °C. The two mobile phases consisted of A: 0.1 M acetate buffer (pH 4.5)-methanol [97:3 (v/v)] and B: methanol. Aminothiols were separated over 8 min with 100% A at a flow rate of 0.8 mL/min, followed by 80%:20% A:B (changed linearly over 1 min) at a flow rate of 1.0 mL/min for 6 min, and 5 min of column re-equilibration for a total run time of 20 min.
2.3. Standard Preparation
Individual stock solutions of HCY, CYS, CysGly, and GSH were prepared from separate weighings of each compound dissolved in water at 50 mM, 400 mM, 100 mM, and 25 mM concentrations, respectively for calibration standards, and 40 mM, 325 mM, 75 mM, and 20 mM concentrations, respectively for QC samples. The 2-mercaptopropionylglycine (MPG) internal standard (IS) was dissolved in HPLC grade water to prepare a 50 mM stock solution. Standards and QC samples containing all four aminothiols were prepared at the beginning of the validation experiment by appropriate dilution with PBS and subsequent mixing of the individual stock solutions. All stock solutions, standards and QC samples were stored at −70 °C to simulate the storage conditions of the study samples.
2.4. Sample Preparation
MPG internal standard working stock solution (50 μM) was prepared by diluting the 50 mM stock 1:1000 in PBS. The internal standard (50 μL) was then added to samples (50 μL) and briefly vortex-mixed. Following addition of TCEP (100 g/L; 10 μL), tubes were capped, briefly vortex-mixed, and incubated at room temperature for 30 min. Trichloroacetic acid 100 g/L with 1 mM EDTA (90 μL) was then added to each sample, briefly vortex-mixed, then centrifuged at 13,000 g for 10 min. Supernatant (50 μL) was added to autosampler vials containing 10 μL of 1.55 M NaOH, 125 μL of 0.125 M borate buffer, pH 9.5, with 4 mM EDTA, and 50 μL of 1 g/L SBD-F in borate buffer (0.125 M with 4 mM EDTA). Samples were capped, briefly vortex-mixed, incubated at 60 °C for 1 hr, placed in the refrigerated autosampler (8 °C), and then a 10 μL aliquot was injected onto the HPLC system for analysis.
2.5. Calibration and linearity
Calibration curves were constructed using six standard concentrations of the four aminothiols (HCY, CYS, CysGly, and GSH) in PBS and were run in duplicate. Curves were obtained daily for three days. Individual standard concentrations in PBS are shown in Tables 1 and 2. Duplicate standard curves for all four aminothiols were analyzed for three runs (lowest standard in triplicate). For each curve, the absolute peak-area ratios of the aminothiol to the IS were calculated and plotted against the nominal aminothiol concentration. Calibration curves for HCY, CYS, CysGly, and GSH were generated by weighted (1/y) linear regression analysis.
Table 1.
Intra- and inter-day precision and accuracy for HCY and CYS
| Concentration (μM)
|
% RSD | % Bias | ||
|---|---|---|---|---|
| Spiked | Measured (mean ± SD) | |||
| Intra-assay reproducibilitya | ||||
| Quality Controls | ||||
| HCY | 4.0 | 3.8 ± 0.1 | 2.9 | −5.5 |
| 16.0 | 16.2 ± 0.4 | 2.5 | 1.4 | |
| 80.0 | 80.5 ± 1.6 | 2.0 | 0.6 | |
| CYS | 32.5 | 31.4 ± 0.4 | 1.4 | −3.2 |
| 130.0 | 132.5 ± 3.2 | 2.4 | 1.9 | |
| 650.0 | 645.3 ± 13.3 | 2.1 | −0.7 | |
| Inter-assay reproducibilityb | ||||
| Quality Controls | ||||
| HCY | 4.0 | 3.8 ± 0.3 | 7.9 | −4.5 |
| 16.0 | 16.1 ± 0.7 | 4.3 | 0.9 | |
| 80.0 | 81.6 ± 3.4 | 4.2 | 2.0 | |
| CYS | 32.5 | 31.8 ± 1.9 | 5.8 | −2.3 |
| 130.0 | 131.7 ± 6.0 | 4.6 | 1.3 | |
| 650.0 | 657.8 ± 31.5 | 4.8 | 1.2 | |
| Standards | ||||
| HCY | 3.13 | 3.2 ± 0.1 | 3.3 | 0.7 |
| 6.25 | 6.4 ± 0.2 | 3.2 | 2.1 | |
| 12.5 | 13.0 ± 0.2 | 1.7 | 3.9 | |
| 25.0 | 22.9 ± 0.5 | 2.4 | −8.3 | |
| 50.0 | 50.9 ± 0.2 | 0.5 | 1.9 | |
| 100.0 | 100.7 ± 0.6 | 0.6 | 0.7 | |
| CYS | 25.0 | 25.8 ± 0.7 | 2.5 | 3.2 |
| 50.0 | 50.0 ± 1.1 | 2.3 | 0.0 | |
| 100.0 | 100.5 ± 1.1 | 1.1 | 0.5 | |
| 200.0 | 186.0 ± 4.7 | 2.5 | −7.0 | |
| 400.0 | 406.0 ± 4.2 | 1.0 | 1.5 | |
| 800.0 | 807.8 ± 5.5 | 0.7 | 1.0 | |
Twelve quality control samples per concentration.
Six to twelve quality control samples or two standards per day per concentration for three days.
Table 2.
Intra- and inter-day precision and accuracy for CysGly and GSH
| Concentration (μM)
|
% RSD | % Bias | ||
|---|---|---|---|---|
| Spiked | Measured (mean ± SD) | |||
| Intra-assay reproducibilitya | ||||
| Quality Controls | ||||
| CysGly | 7.5 | 7.3 ± 0.1 | 1.5 | −3.3 |
| 30.0 | 29.8 ± 0.7 | 2.4 | −0.7 | |
| 150.0 | 164.2 ± 3.1 | 1.9 | 9.5 | |
| GSH | 2.0 | 2.1 ± 0.1 | 4.1 | 7.4 |
| 8.0 | 8.1 ± 0.2 | 2.1 | 1.5 | |
| 40.0 | 38.9 ± 0.7 | 1.7 | −2.9 | |
| Inter-assay reproducibilityb | ||||
| Quality Controls | ||||
| CysGly | 7.5 | 7.4 ± 0.4 | 5.1 | −1.7 |
| 30.0 | 29.9 ± 1.1 | 3.6 | −0.3 | |
| 150.0 | 165.0 ± 5.4 | 3.3 | 10 | |
| GSH | 2.0 | 2.1 ± 0.1 | 4.9 | 5.5 |
| 8.0 | 8.2 ± 0.3 | 3.6 | 2.8 | |
| 40.0 | 39.1 ± 1.2 | 3.1 | −2.3 | |
| Standards | ||||
| CysGly | 6.25 | 6.3 ± 0.2 | 2.7 | 0.6 |
| 12.5 | 12.5 ± 0.2 | 1.9 | 0.1 | |
| 25.0 | 25.2 ± 0.4 | 1.5 | 0.8 | |
| 50.0 | 48.3 ± 1.0 | 2.2 | −3.4 | |
| 100.0 | 102.3 ± 0.3 | 0.3 | 2.3 | |
| 200.0 | 199.3 ± 1.0 | 0.5 | −0.4 | |
| GSH | 1.56 | 1.5 ± 0.1 | 4.6 | −4.4 |
| 3.13 | 3.4 ± 0.1 | 3.0 | 7.4 | |
| 6.25 | 6.5 ± 0.1 | 2.1 | 4.0 | |
| 12.5 | 12.3 ± 0.2 | 1.8 | −1.7 | |
| 25.0 | 24.5 ± 0.3 | 1.1 | −1.9 | |
| 50.0 | 50.4 ± 0.2 | 0.4 | 0.7 | |
Twelve quality control samples per concentration.
Six to twelve quality control samples or two standards per day per concentration for three days.
2.6. Precision and accuracy
Precision and accuracy were determined by the analysis of aminothiol QC samples spiked at three concentrations listed in Tables 1 and 2. Six replicate QC samples at each concentration were analyzed daily for two days, followed by analysis of twelve replicate QC samples at each concentration on the third day, for a total of n = 24 QC samples at each concentration for the determination of inter-day precision and accuracy. Intra-day precision and accuracy were determined from n = 12 replicate QC samples on day 3. The calculated mean concentration relative to the nominal concentration was used to express accuracy (% bias). Means, standard deviations and relative standard deviations (% RSD) were calculated from the QC values and used to estimate the inter- and intra-day precision.
2.7. Stability and carryover
Triplicate high and low QC samples were subjected to three freeze-thaw cycles (−70 °C to room temperature) prior to processing and analysis to evaluate sample stability. In addition, stability of processed samples was assessed. Triplicate high and low QC samples were processed and analyzed, then re-injected and analyzed up to 18 h post-processing. Sample carryover was evaluated by inserting vials of blank mobile phase in several random positions in the analysis set on day 3.
2.8 Recovery
Recovery of total aminothiols from plasma was assessed by analyzing pooled human plasma obtained from normal healthy subjects spiked at the three QC concentration levels listed in Tables 1 and 2. Six replicate ‘control’ (unspiked) plasma samples and six spiked samples of each QC level were analyzed using calibration curves generated from PBS-based standards as described by Tsikas et al. [9]. Recovery was determined by comparing the nominal aminothiol concentration, calculated as the sum of the concentration in unspiked plasma and the spiked QC concentration, to their corresponding measured concentration. Measured concentrations were defined as 100%. Means, standard deviations and relative standard deviations were calculated.
2.9 Application to clinical studies of oxidative stress
The effect of the antioxidant α-lipoic acid on oxidative stress was determined in patients with chronic kidney disease (CKD). The protocol was approved by the Maine Medical Center Institutional Review Board and signed informed consent was obtained. α-lipoic acid 600 mg was administered orally three times daily for two days. Plasma samples were collected at baseline and t = 48 h (after administration of six doses), and were obtained from whole blood which was collected into evacuated EDTA tubes, placed on ice, and centrifuged within 30 min of collection. Samples were stored at −70 °C until analyzed. Total plasma concentrations of all aminothiols (tHCY, tCYS, tCysGly, and tGSH) were determined as described above.
3. Results
3.1. Chromatographic separation
A representative chromatogram of the standard solution at LC concentrations of each aminothiol is shown in Fig. 2. Representative chromatograms of blank (unspiked) pooled human plasma from healthy volunteers without IS and with IS are depicted in Figs. 3A and B, respectively. Retention times for HCY, CYS, CysGly, GSH and IS were approximately 4.3, 5.8, 6.5, 7.8, and 14.0 min, respectively. The peaks of interest were well separated and there was no interference from endogenous compounds.
Fig. 2.
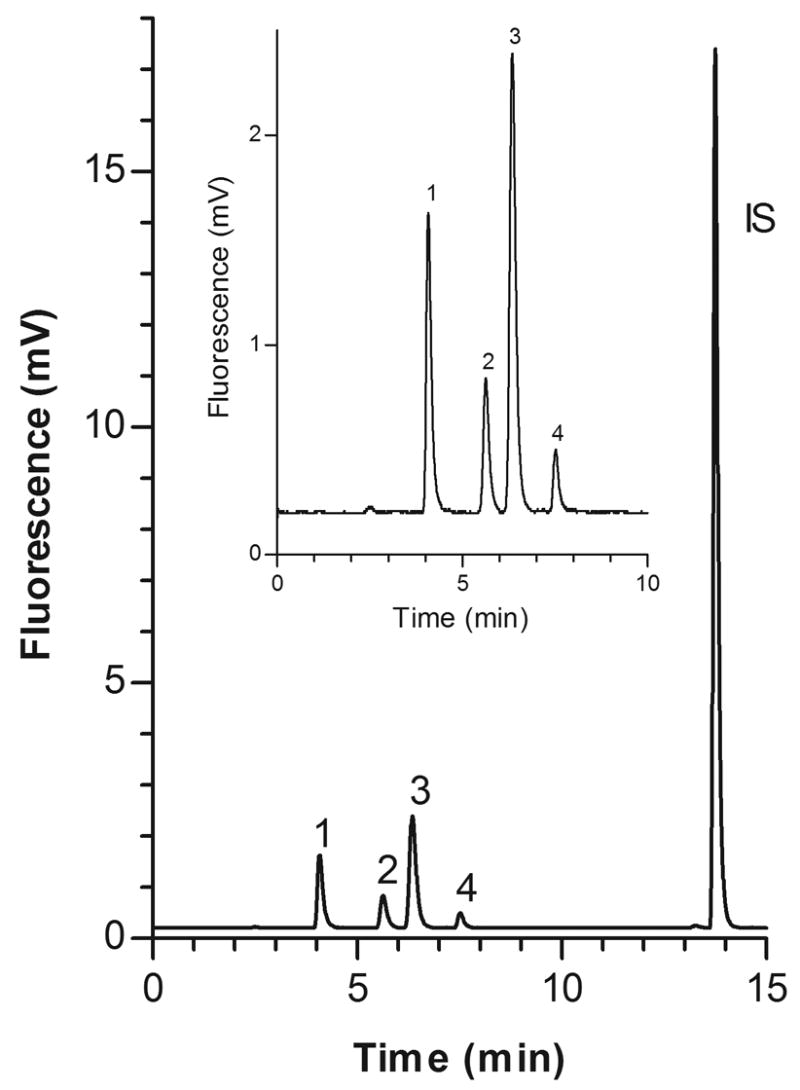
Representative chromatogram of PBS based standard solution at LC concentrations of each aminothiol.
Fig. 3.
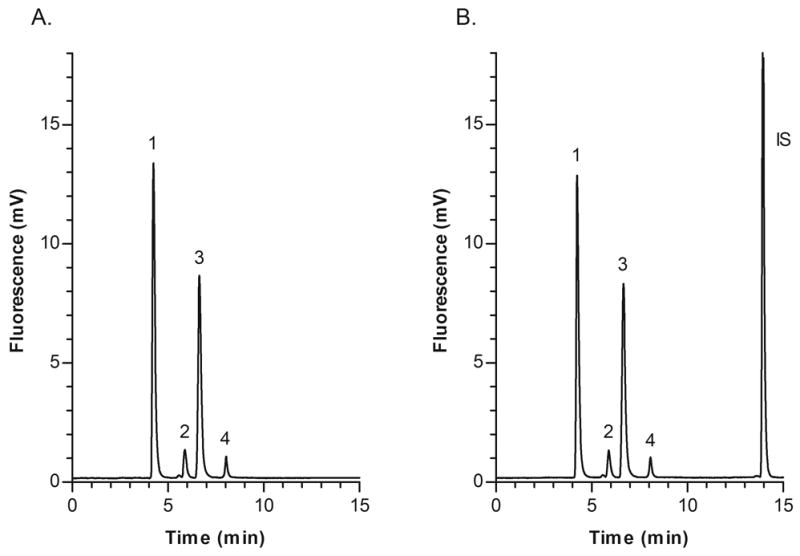
Representative chromatograms of blank (unspiked) pooled human plasma from healthy volunteers; (A) Plasma without IS; (B) Plasma with IS and measured aminothiol concentrations as follows: Peak 1, CYS 277.0 μM; 2, HCY 6.7 μM; 3, CysGly 26.3 μM; 4, GSH 5.2 μM.
3.2. Linearity, precision and accuracy
Linear calibration curves were obtained for HCY, CYS, CysGly, and GSH over the concentration ranges of 3.13–100 μM, 25–800 μM, 6.25–200 μM, and 1.56–50 μM, respectively (Tables 1 and 2). The mean regression equations (±SD) were y=0.0108(±0.0004)x+0.0020(±0.0012) for HCY, y=0.0027(±0.0001)x−0.0016(±0.0009) for CYS, y=0.0216(±0.0009)x−0.0024(±0.0023) for CysGly, and y=0.0086(±0.0004)x−0.0008(±0.0007) for GSH, with correlation coefficients (r) ≥0.999 for all four aminothiols. The lower limit of quantitation (LOQ) for each demonstrated acceptable precision (RSD<5%) and signal-to-noise ratios of at least 5:1, and the intra- and inter-day precision and accuracy were within ±10% (Tables 1 and 2).
3.3. Stability, carryover, and recovery
Three freeze-thaw cycles had no effect on the stability of tHCY, tCYS, tCysGly, or tGSH. Additionally, total concentrations of all four aminothiols were stable in processed plasma samples and PBS based controls for at least 18 hours at 8 °C prior to analysis. There was no evidence of carryover in any of the blank reagent samples. The mean recoveries of all analytes from plasma at all concentrations ranged from 88% to 104% (Table 3).
Table 3.
Recovery of HCY, CYS, CysGly, and GSH from human plasma (n = 6)
| Concentration (μM)
|
% Rec | % RSD | |||
|---|---|---|---|---|---|
| Plasma | Spiked | Measured | |||
| HCY | 6.5 ± 0.2 | 4.0 | 10.8 ± 0.3 | 103.4 ± 4.5 | 4.3 |
| 16.0 | 22.0 ± 0.7 | 97.9 ± 3.6 | 3.6 | ||
| 80.0 | 86.0 ± 4.0 | 99.4 ± 4.6 | 4.6 | ||
|
| |||||
| CYS | 261.4 ± 8.3 | 32.5 | 288.9 ± 8.4 | 98.4 ± 4.8 | 4.8 |
| 130.0 | 346.1 ± 10.1 | 88.5 ± 3.9 | 4.4 | ||
| 650.0 | 800.5 ± 35.6 | 87.8 ± 3.9 | 4.4 | ||
|
| |||||
| CysGly | 34.3 ± 1.1 | 7.5 | 43.6 ± 1.3 | 104.4 ± 5.0 | 4.8 |
| 30.0 | 63.4 ± 1.9 | 98.5 ± 4.1 | 4.2 | ||
| 150 | 187.4 ± 8.7 | 101.7 ± 4.7 | 4.7 | ||
|
| |||||
| GSH | 5.4 ± 0.1 | 2.0 | 7.2 ± 0.2 | 97.5 ± 3.6 | 3.7 |
| 8.0 | 11.8 ± 0.4 | 88.4 ± 3.6 | 4.1 | ||
| 40.0 | 42.8 ± 2.1 | 94.2 ± 4.7 | 5.0 | ||
3.4. Application to clinical studies of oxidative stress
Ten subjects with CKD received α-lipoic acid 600 mg orally three times daily for two days. Plasma concentrations of HCY, CysGly, and GSH were not different after administration of α-lipoic acid compared to baseline. However, CYS concentrations (mean ± SD) were reduced by 23% compared to baseline, from 339.5 ± 71.5 μM to 260.8 ± 55.4 μM (p = 0.0003). Representative chromatograms of plasma samples obtained at baseline and after administration of α-lipoic acid are shown in Figs. 4A and B, respectively.
Fig. 4.
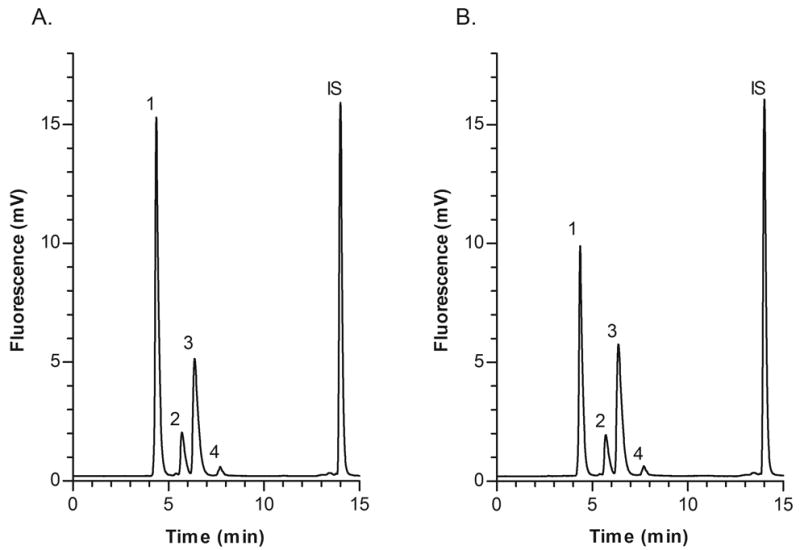
Representative chromatograms of plasma samples obtained from a chronic kidney disease patient before and after administration of the antioxidant α-lipoic acid 600 mg orally three times daily for two days; (A) Baseline sample with measured concentrations as follows: Peak 1, CYS 347.0 μM; 2, HCY 13.9 μM; 3, CysGly 22.0 μM; 4, GSH 3.5 μM; (B) Sample obtained after administration of α-lipoic acid with measured concentrations as follows: Peak 1, CYS 220.0 μM; 2, HCY 12.6 μM; 3, CysGly 24.0 μM; 4, GSH 3.9 μM.
4. Discussion
Several studies have demonstrated that aminothiols are involved in the pathogenesis of human diseases affecting virtually every organ system in the body [25,26]. In particular, the association between thiol concentrations, oxidative stress and cardiovascular disease has received much attention [2,27–29], i.e., oxidized thiols including HCY and CYS accumulate in uremia and may promote atherogenesis by altering endothelial function and increasing vascular smooth muscle cell activation [30]. As a result, plasma aminothiol concentration monitoring has emerged as a useful tool for diagnosing and monitoring the presence of human diseases and metabolic disorders including oxidative stress [3,5,6]. This in turn has generated a need for fully validated, simple, precise and sensitive analytical methods capable of simultaneously determining aminothiols for clinical and translational research and for routine clinical monitoring.
Numerous methods for the determination of one or more thiols have been reported, including HPLC with ultraviolet [7–9], fluorescence [10–18,31], or electrochemical detection [19–21], gas chromatography–mass spectrometry [22], ion-exchange chromatography [23], and capillary electrophoresis [24]. Each of these methods has basic limitations in terms of equipment cost, complexity, sample processing and run times, number of thiols simultaneously quantitated, and/or validation parameters assessed which hinder their use for high-throughput routine clinical or research purposes. For example, ultraviolet detection suffers from poor sensitivity and specificity [32]; electrochemical detection exhibits high oxidation potential that can reduce its performance and possibly contributes to the poorer precision reported than for ultraviolet or fluorometric detection methods [5,32]; mass spectrometric detection is costly, cumbersome, and difficult to use for simultaneous determination of multiple thiols [5,6,32]; many automated methods such as the fluorescence polarization immunoassay (IMx®, Abbott Laboratories, Abbott Park Il, USA) are not capable of simultaneous determination of multiple thiols. HPLC with fluorescence detection is the most commonly used method for determination of aminothiols due to its high sensitivity, relative simplicity, ease of automation, and high-throughput capability [5,32]. Detailed reviews, including advantages and limitations, of the analytical methods available for determining aminothiols have been published in recent years [5,6,32]. The sensitive, reproducible (RSD<10%), and simple method presented here is a modification of the method of Pfeiffer et al. [11] which uses MPG as internal standard and PBS based standards and quality controls. Moreover, the assay includes two additional thiols to simultaneously determine four analytes, and has been thoroughly validated for high-throughput routine clinical and/or research use.
An assay capable of simultaneously determining multiple aminothiols is desirable because of extensive interconversion between them and the need to understand the dynamic relationship between all thiol and disulfide components [5,6], as well as to facilitate assessment of the relationship between thiols and disease status. To date, the overwhelming majority of published aminothiol methods have been validated for the determination of only one or two thiols simultaneously [5,6,32]. Our method has been validated for determination of tHCY, tCYS, tCysGly and tGSH. Although others have published validated assays capable of determining four aminothiols simultaneously [7,19–22,33], to our knowledge only one other HPLC-fluorescence method has been fully validated for this purpose [12]. We observed similar concentrations of the four aminothiols in plasma from healthy volunteers, and achieved significantly better sensitivity, i.e., lower LOQ for all analytes, possibly due to our use of an internal standard versus external calibrators, and improved peak separation [12]. Like Tsikas and colleagues [9], our method is simplified by using aqueous standards and quality controls, based on previous work demonstrating no differences in the calibration slopes between aqueous and plasma based standards [10]. Excellent recovery (88% to 104%; Table 3) of all analytes from plasma was observed at all concentrations, consistent with previous findings [12,19,22].
We are currently using the method presented here in the assessment of oxidative stress status in patients with CKD. Oxidative stress is often characterized by elevated oxidized thiols including HCY and CYS, and/or depleted plasma glutathione concentrations [34]. The possible link between increased oxidative stress, endothelial dysfunction, and accelerated risk of cardiovascular complications in CKD suggests that antioxidant therapy may be beneficial [2]. Therefore, we recently assessed the effect of the antioxidant α-lipoic acid on tHCY, tCYS, tCysGly, and tGSH plasma concentrations. Baseline concentrations of all four aminothiols were similar to previously reported values in CKD patients [19,20,22]. tHCY, tCysGly, and tGSH were unchanged after administration of α-lipoic acid, but tCYS concentrations were reduced by 23% compared to baseline (p = 0.0003; Figs. 4A and B). CYS plasma concentrations are higher in patients with cardiovascular disease than in healthy subjects, an indication that excess CYS exposure may increase susceptibility to vascular toxicity [35]. So, correction of CYS concentrations with antioxidants such as α-lipoic acid may be an important approach to reducing cardiovascular complications. Representative chromatograms of plasma samples obtained at baseline and after administration of α-lipoic acid are shown in Figs. 4A and B, respectively.
In summary, a simple, sensitive, reproducible, and robust HPLC method has been fully validated for simultaneously determining total concentrations of the aminothiols HCY, CYS, CysGly, and GSH in human plasma. This method utilizes an internal standard, employs phosphate buffered saline-based standards and quality controls, and demonstrates excellent plasma recovery and improved sensitivity. This assay is well suited for high-throughput quantitative determination of aminothiols in clinical studies, and is currently being used to support investigations of oxidative stress in patients with chronic kidney disease.
Acknowledgments
This project was supported by NIH Research Grant R01 HL070938, funded by the National Heart, Lung, and Blood Institute, and by a grant from the Maine Medical Center Research Strategic Plan Steering Committee.
Footnotes
Publisher's Disclaimer: This is a PDF file of an unedited manuscript that has been accepted for publication. As a service to our customers we are providing this early version of the manuscript. The manuscript will undergo copyediting, typesetting, and review of the resulting proof before it is published in its final citable form. Please note that during the production process errors may be discovered which could affect the content, and all legal disclaimers that apply to the journal pertain.
References
- 1.Di Giuseppe D, Frosali S, Priora R, Di Simplicio FC, Buonocore G, Cellesi C, Capecchi PL, Pasini FL, Lazzerini PE, Jakubowski H, Di Simplicio P. J Lab Clin Med. 2004;144:235. doi: 10.1016/j.lab.2004.06.006. [DOI] [PubMed] [Google Scholar]
- 2.Himmelfarb J, Stenvinkel P, Ikizler TA, Hakim RM. Kidney Int. 2002;62:1524. doi: 10.1046/j.1523-1755.2002.00600.x. [DOI] [PubMed] [Google Scholar]
- 3.Himmelfarb J, Hakim RM. Curr Opin Nephrol Hypertens. 2003;12:593. doi: 10.1097/00041552-200311000-00004. [DOI] [PubMed] [Google Scholar]
- 4.Dickinson DA, Forman HJ. Biochem Pharmacol. 2002;64:1019. doi: 10.1016/s0006-2952(02)01172-3. [DOI] [PubMed] [Google Scholar]
- 5.Ducros V, Demuth K, Sauvant MP, Quillard M, Causse E, Candito M, Read MH, Drai J, Garcia I, Gerhardt MF. J Chromatogr B Analyt Technol Biomed Life Sci. 2002;781:207. doi: 10.1016/s1570-0232(02)00497-x. [DOI] [PubMed] [Google Scholar]
- 6.Pastore A, Federici G, Bertini E, Piemonte F. Clin Chim Acta. 2003;333:19. doi: 10.1016/s0009-8981(03)00200-6. [DOI] [PubMed] [Google Scholar]
- 7.Bald E, Chwatko G, Glowacki R, Kusmierek K. J Chromatogr A. 2004;1032:109. doi: 10.1016/j.chroma.2003.11.030. [DOI] [PubMed] [Google Scholar]
- 8.Katrusiak AE, Paterson PG, Kamencic H, Shoker A, Lyon AW. J Chromatogr B Biomed Sci Appl. 2001;758:207. doi: 10.1016/s0378-4347(01)00182-7. [DOI] [PubMed] [Google Scholar]
- 9.Tsikas D, Sandmann J, Ikic M, Fauler J, Stichtenoth DO, Frolich JC. J Chromatogr B Biomed Sci Appl. 1998;708:55. doi: 10.1016/s0378-4347(97)00670-1. [DOI] [PubMed] [Google Scholar]
- 10.Kuo K, Still R, Cale S, McDowell I. Clin Chem. 1997;43:1653. [PubMed] [Google Scholar]
- 11.Pfeiffer CM, Huff DL, Gunter EW. Clin Chem. 1999;45:290. [PubMed] [Google Scholar]
- 12.Pastore A, Massoud R, Motti C, Lo RA, Fucci G, Cortese C, Federici G. Clin Chem. 1998;44:825. [PubMed] [Google Scholar]
- 13.Fermo I, Arcelloni C, Mazzola G, D’Angelo A, Paroni R. J Chromatogr B Biomed Sci Appl. 1998;719:31. doi: 10.1016/s0378-4347(98)00405-8. [DOI] [PubMed] [Google Scholar]
- 14.Ivanov AR, Nazimov IV, Baratova L. J Chromatogr A. 2000;895:157. doi: 10.1016/s0021-9673(00)00713-5. [DOI] [PubMed] [Google Scholar]
- 15.Ivanov AR, Nazimov IV, Baratova L, Lobazov AP, Popkovich GB. J Chromatogr A. 2001;913:315. doi: 10.1016/s0021-9673(00)00993-6. [DOI] [PubMed] [Google Scholar]
- 16.Tcherkas YV, Denisenko AD. J Chromatogr A. 2001;913:309. doi: 10.1016/s0021-9673(00)01201-2. [DOI] [PubMed] [Google Scholar]
- 17.Pelletier S, Lucy CA. J Chromatogr A. 2002;972:221. doi: 10.1016/s0021-9673(02)01087-7. [DOI] [PubMed] [Google Scholar]
- 18.Liang SC, Wang H, Zhang ZM, Zhang HS. Anal Bioanal Chem. 2005;381:1095. doi: 10.1007/s00216-004-3006-2. [DOI] [PubMed] [Google Scholar]
- 19.Houze P, Gamra S, Madelaine I, Bousquet B, Gourmel B. J Clin Lab Anal. 2001;15:144. doi: 10.1002/jcla.1018. [DOI] [PMC free article] [PubMed] [Google Scholar]
- 20.Kleinman WA, Richie JP., Jr Biochem Pharmacol. 2000;60:19. doi: 10.1016/s0006-2952(00)00293-8. [DOI] [PubMed] [Google Scholar]
- 21.Petrlova J, Mikelova R, Stejskal K, Kleckerova A, Zitka O, Petrek J, Havel L, Zehnalek J, Vojtech A, Trnkova L, Kizek R. J Sep Sci. 2006;29:1166. doi: 10.1002/jssc.200500425. [DOI] [PubMed] [Google Scholar]
- 22.Sigit JI, Hages M, Brensing KA, Frotscher U, Pietrzik K, von Bergmann K, Lutjohann D. Clin Chem Lab Med. 2001;39:681. doi: 10.1515/CCLM.2001.112. [DOI] [PubMed] [Google Scholar]
- 23.Briddon A. Amino Acids. 1998;15:235. doi: 10.1007/BF01318862. [DOI] [PubMed] [Google Scholar]
- 24.Chassaing C, Gonin J, Wilcox CS, Wainer IW. J Chromatogr B Biomed Sci Appl. 1999;735:219. doi: 10.1016/s0378-4347(99)00425-9. [DOI] [PubMed] [Google Scholar]
- 25.Townsend DM, Tew KD, Tapiero H. Biomed Pharmacother. 2003;57:145. [Google Scholar]
- 26.Fowler B. Semin Vasc Med. 2005;5:77. doi: 10.1055/s-2005-872394. [DOI] [PubMed] [Google Scholar]
- 27.Madamanchi NR, Vendrov A, Runge MS. Arterioscler Thromb Vasc Biol. 2005;25:29. doi: 10.1161/01.ATV.0000150649.39934.13. [DOI] [PubMed] [Google Scholar]
- 28.Hackam DG, Anand SS. JAMA. 2003;290:932. doi: 10.1001/jama.290.7.932. [DOI] [PubMed] [Google Scholar]
- 29.Andreotti F, Burzotta F, Manzoli A, Robinson K. J Thromb Thrombolysis. 2000;9:13. doi: 10.1023/a:1018675624181. [DOI] [PubMed] [Google Scholar]
- 30.Bostom AG, Lathrop L. Kidney Int. 1997;52:10. doi: 10.1038/ki.1997.298. [DOI] [PubMed] [Google Scholar]
- 31.Krijt J, Vackova M, Kozich V. Clin Chem. 2001;47:1821. [PubMed] [Google Scholar]
- 32.Camera E, Picardo M. J Chromatogr B Analyt Technol Biomed Life Sci. 2002;781:181. doi: 10.1016/s1570-0232(02)00618-9. [DOI] [PubMed] [Google Scholar]
- 33.Guan X, Hoffman B, Dwivedi C, Matthees DP. J Pharm Biomed Anal. 2003;31:251. doi: 10.1016/s0731-7085(02)00594-0. [DOI] [PubMed] [Google Scholar]
- 34.Himmelfarb J, McMenamin E, McMonagle E. Kidney Int. 2002;61:705. doi: 10.1046/j.1523-1755.2002.00151.x. [DOI] [PubMed] [Google Scholar]
- 35.Mills BJ, Weiss MM, Lang CA, Liu MC, Ziegler C. J Lab Clin Med. 2000;135:396. doi: 10.1067/mlc.2000.105976. [DOI] [PubMed] [Google Scholar]