Abstract
The switch from a quiescent tumor to an invasive tumor is accompanied by the acquisition of angiogenic properties. This phenotypic change likely requires a change in the balance of angiogenic stimulators and angiogenic inhibitors. The nature of the angiogenic switch is not known. Here, we show that introduction of activated H-ras into immortalized endothelial cells is capable of activating the angiogenic switch. Angiogenic switching is accompanied by up-regulation of vascular endothelial growth factor and matrix metalloproteinase (MMP) bioactivity and down-regulation of tissue inhibitor of MMP. Furthermore, we show that inhibition of phosphatidylinositol-3-kinase leads to partial inhibition of tumor angiogenesis, thus demonstrating that activated H-ras activates tumor angiogenesis through two distinct pathways. Finally, we show evidence for two forms of tumor dormancy.
Keywords: endothelium, angiosarcoma, hemangioma, tumor dormancy
In vivo, the progression from in situ malignancy to frank malignancy is characterized by the switch to an angiogenic phenotype (1). The angiogenic switch is a critical control point for tumor expansion. The ability of a tumor to become neovascularized permits rapid expansion of tumor growth and increases the likelihood of metastases. The acquisition of the angiogenic phenotype by cells with neoplastic potential has been illustrated in transgenic mouse systems (2, 3). The genetic alterations which accompany the switch to the angiogenic phenotype are unknown (1).
We have developed a model of the angiogenic switch by sequential introduction of simian virus 40 (SV40) large T (tumor) antigen and H-ras into murine endothelial cells. Endothelial cells expressing the temperature-sensitive large T antigen are immortalized in vitro, but upon implantation into mice, form dormant hemangiomas with low proliferative and apoptotic indices. These cells are poorly angiogenic by virtue of low production of vascular endothelial growth factor (VEGF) mRNA and matrix metalloproteinase (MMP) bioactivity, as well as elevated bioactivity of tissue inhibitors of MMP (TIMPs). TIMPs are known to inhibit angiogenesis (4, 5).
Addition of activated H-ras results in cells capable of forming rapidly proliferating tumors in vivo. Histologically, these tumors are angiosarcomas. They have an 8-fold increase in proliferation and a 2-fold increase in apoptosis. The cells are potentially angiogenic by virtue of high production of VEGF mRNA and MMP bioactivity, and low levels of TIMP bioactivity. Thus, introduction of a single gene results in an imbalance between angiogenesis stimulation and inhibition.
Because ras and other dominant oncogenes activate phosphatidylinositol-3-kinase (6–14), we wanted to determine whether phosphatidylinositol-3-kinase regulates the angiogenic switch. To test this, we treated cells containing either one or both oncogenes in vitro and in vivo with wortmannin, an inhibitor of phosphatidylinositol-3-kinase (15). Wortmannin inhibited ras- and hypoxia-induced elevations in VEGF expression and MMP bioactivity, but had no effect on TIMP bioactivity. In vivo, wortmannin was able to cause a 66% decrease in tumor size, but it did not cause reversion of the malignant phenotype.
We conclude that ras is capable of stimulating tumor angiogenesis through two pathways, one of which involves phosphatidylinositol-3-kinase. We also describe a form of tumor dormancy characterized by low angiogenic potential, as well as low proliferative and apoptotic indices.
MATERIALS AND METHODS
Generation of Cell Lines.
Primary murine endothelial cells were isolated from pancreatic islets of C57BL/6 adult mice. Cells were infected with an ecotropic retrovirus encoding SV40 large T 58–3 allele (16) and neomycin resistance (C. Cepko, Harvard Medical School). Cells were selected in Dulbecco’s modified Eagle’s medium supplemented with 5% fetal calf serum and 0.6 mg/ml geneticin (GIBCO). Clones were stained with 1,1′-dioctadecyl-3,3,3′,3′-tetramethylindocyanine perchlorate conjugated to acetylated low density lipoprotein (diI-Ac-LDL) (17) (Biomedical Technologies, Stoughton, MA), and clones that were positive under fluorescence microscopy were expanded. One clone, MS1, was used for further studies.
MS1 cells were infected with a second retrovirus, encoding either hygromycin resistance alone or activated H-ras and hygromycin resistance together (18, 19). The H-ras allele encoded by the retrovirus is mutant at glycine-12 and threonine-59 (19). Cells were selected in 50 μg/ml hygromycin and pooled. Cells thus derived were named SVEN 1 hyg and SVR, respectively.
Western Blotting.
Cells were placed on ice and washed twice with cold phosphate-buffered saline. Extraction buffer (50 mM Tris·HCl, pH 8.0/250 mM NaCl/0.5% Nonidet P-40, containing 10 μg/ml phenymethanesulfonyl fluoride, 10 μg/ml aprotinin, and 10 μg/ml leupeptin) was added at 200 μl per 25-cm2 plate. Protein was separated by SDS/PAGE on a 15% polyacrylamide gel, then transferred to nitrocellulose. The membrane was blocked in 5% bovine serum albumin, then incubated for 1 hr with anti-SV40 T antigen (Oncogene Sciences) at a concentration of 2 μg/ml. After washing, the blot was incubated with anti-mouse immunoglobulin antiserum conjugated to horseradish peroxidase (HRP; Calbiochem), at a dilution of 1:10,000. Antibody binding was detected by chemiluminescence (Amersham ECL system).
Production of a VEGF-Expressing Retrovirus.
A BamHI/XhoI fragment encoding a full-length VEGF 121-amino acid peptide from Macaca fascicularis was provided by P. D’Amore (Children’s Hospital, Boston). This fragment was ligated into the BamHI/SalI-cut retroviral vector pBABEpuro (20). The resulting plasmid, pB.VEGF, and pBABEpuro were transfected into the amphotropic producer cell line PA317 (G. P. Dotto, Cutaneous Biology Research Center, Charlestown, MA), and selected in 2 μg/ml puromycin. Supernatant from these cells was used to infect MS1 cells, which were selected in 2 μg/ml puromycin. Puromycin-resistant cells were pooled for further experiments. VEGF was detected in the medium by using an ELISA produced by R & D Systems. Expression of VEGF in recipient cells was also confirmed by Northern blot analysis.
In Vivo Tumorigenesis.
SVR and SVEN 1 hyg cells (1 × 10⁶) and MS1 cells (5.5 × 10⁶) were injected into the flank of 6-week-old male nude mice obtained from Massachusetts General Hospital. Cells derived from MS1 and SVEN 1 hyg formed 2-mm-diameter tumors which were visible after 3 weeks and remained this size for up to 5 months of observation. SVR cells formed tumors which reached 1 cm in diameter after approximately 10 days. After tumors appeared, they were excised and fixed in both formalin and Carnoy’s fixative.
In Vivo Proliferation and Apoptosis.
Animals were treated with bromodeoxyuridine 3 hr prior to sacrifice. Tumors were fixed in either formalin or Carnoy’s fixative, sectioned, and digested in 20 μg/ml proteinase K. For bromodeoxyuridine staining, sections were treated with monoclonal antibodies to 5′-bromodeoxyuridine (21). For detection of apoptotic nuclei, slides were then fixed in terminal transferase buffer according to the method of Gavrieli et al. (22).
Treatment of Animals with Wortmannin.
Six-week-old male nude mice (Massachusetts General Hospital, Boston) were injected in the right flank with 1 × 10⁶ SVR cells. Beginning at day 3 after injection, mice received injections of 0.4 mg/kg wortmannin or vehicle control (10% dimethyl sulfoxide in sterile water) intralesionally. Mice were weighed prior to initiation of treatment and at weekly intervals. Tumor size was measured with Vernier calipers, and tumor volume was calculated by using the formula (width2 × length) × 0.52, where width represents the shortest dimension.
Northern Blotting.
Cells were grown to 80% confluence, then exposed to either hypoxia (3% O2/10%CO2) or normoxia (21% O2/10%CO2) for 24 hr in the presence or absence of wortmannin (1 μg/ml) or vehicle control. The media used in these experiments were Cellgro Serumless media (Mediatech, Herndon, VA).
Cells were solubilized in RNAzol B (Tel-Test, Friendswood, TX) according to the manufacturer’s instructions. RNA levels were quantitated by using absorbance at 260 nm, and 10 μg of total RNA was electrophoresed through 1.2% agarose gels and transferred onto GeneScreen (New England Nuclear).
Assays of MMPs and TIMPs.
Cells were grown to approximately 75% confluence in Dulbecco’s modified Eagle’s medium supplemented with 5% fetal calf serum. After washing with phosphate-buffered saline, medium was replaced with Cellgro Serumless medium (Mediatech) supplemented with either 1 μg/ml wortmannin or an equivalent volume of dimethyl sulfoxide as vehicle control. Cells were incubated at 37°C at 10% CO2 for 24 hr.
Substrate gel electrophoresis (zymography) was conducted according to the method of Herron et al. (23) with modifications (24). The gels were stained with 0.5% Coomassie blue R-250 in acetic acid/isopropyl alcohol/H2O (1:3:6, vol/vol) and destained in H2O. Densitometry of destained areas was quantified using a Datascopy GS Plus scanner connected to a Macintosh II computer with macimage software (Xerox Imaging Systems).
To quantify TIMP activity from conditioned media of cells in the presence or absence of ras, a solid collagen film assay was performed using 14C-radiolabeled collagen (4). Conditioned medium was added to triplicate wells containing radiolabeled collagen. The plate was then incubated at 37°C for 2.5 hr, and the supernatant was collected and its radioactivity was measured in a scintillation counter (Beckman).
Origin of Endothelial Cells in Tumors.
We utilized the differences in HLA class 1 antigens present in the host versus the endothelial cell lines to address this issue. The cell lines are derived from C57BL/6 mice (H-2Kb), while the host mice have a BALB/c background (H-2Kd). Five-micrometer frozen sections of tumor tissue in OCT compound were cut and fixed for 2 min in acetone. The sections were stained with biotinylated antibodies directed against H-2Kb (AF6-88.5 monoclonal from PharMingen, and monoclonal 28–13-3 from T. Duffy, The Jackson Laboratory), at dilutions of 1:50 and 1:500. The sections were then treated with avidin conjugated to alkaline phosphatase (Dako) and alkaline phosphatase substrate (Fuchsin kit, Dako) according to the manufacturer’s instructions.
RESULTS
Establishment of a Genetic Model of Dormancy.
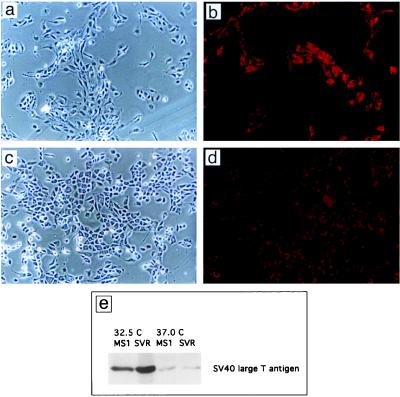
Introduction of the temperature-sensitive large T antigen TSA 58–3 to primary endothelial cells led to growth in the absence of basic fibroblast growth factor and gelatinized surfaces (Fig. 1a–d). Both cell types demonstrated uptake of diI-Ac-LDL, a marker of endothelial differentiation (Fig. 1 c and d). Expression of large T antigen was temperature sensitive, with low-level expression at 37°C (Fig. 1e).
Figure 1.
Morphology of endothelial cells containing SV40 large T antigen alone (MS1 cells) or both SV40 large T antigen and activated c-Ha-ras (SVR cells). (a) MS1 cells. (×37.) (b) MS1 cells. (×37; stained with diI-Ac-LDL.) (c) SVR cells. (×37.) (d) SVR cells. (×37; stained with diI-Ac-LDL.) (e) Western blot of MS1 and SVR cells for SV40 large T antigen at 32.5°C and 37°C.
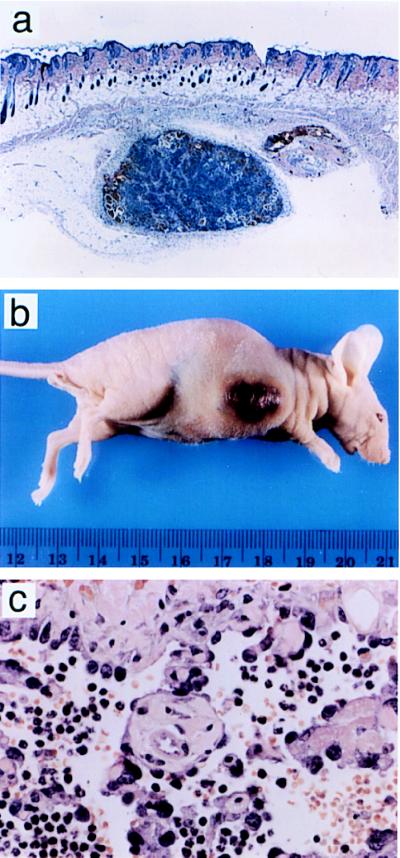
Injection of these cells (MS1 cells) into nude mice led to the development of small nonprogressive tumors with a prominent stroma (Fig. 2a). These tumors grew to a maximum size of 2 mm3, and they remained stable in size for up to 5 months of observation.
Figure 2.
Histology and appearance of tumors induced by MS1 cells and SVR cells in nude mice. (a) Subcutaneous MS1 tumor stained with hematoxylin and eosin. (×10.) (b) Tumor in nude mouse derived from SVR cells injected subcutaneously into 5- to 6-week-old male nude mice. (c) SVR tumors stained with hematoxylin and eosin. (×132.)
H-Ras was introduced into MS1 cells. Injection of these cells (SVR) into nude mice led to rapidly progressive tumors which caused death of the mice in 3–4 weeks (Fig. 2b). The cause of death in these animals was hemorrhage. Histologically, these tumors were well differentiated angiosarcomas (Fig. 2c). Infection of MS1 cells with control retrovirus encoding hygromycin resistance alone did not result in enhanced tumorigenesis, suggesting that ras is necessary for aggressive tumorigenesis and angiogenesis in this model.
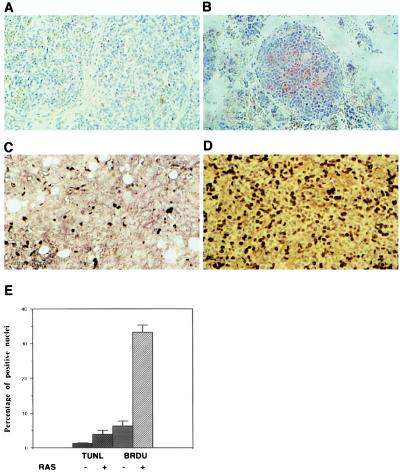
Because dormant Lewis lung carcinomas had been demonstrated to have high rates of both proliferation and apoptosis (25), tumors derived from MS1 and SVR cells were assayed for bromodeoxyuridine uptake, as a measure of proliferation, and for terminal transferase labeling of apoptotic nuclei. Similar to the findings of Holmgren et al. (25), we found that our dormant tumors contained a balance of proliferating and apoptotic tumor cells but that both indices were at a lower setpoint (Fig. 3).
Figure 3.
Bromodeoxyuridine and TUNEL staining of MS1 and SVR tumors. Tumors were fixed in formalin and UTP end-labeled with terminal transferase (TUNEL assay) (A and B) or stained with anti-bromodeoxyuridine antibody (C and D). (A–D, ×40.) (A and C) MS1 tumors stained with terminal transferase (A) or bromodeoxyuridine (B). (B and D) SVR tumors labeled in the same manner as MS1. (E) Percentage of cells in MS1 and SVR tumors that are positive for uptake of bromodeoxyuridine or label with terminal transferase.
Effect of ras and Wortmannin on Hypoxic Induction of VEGF.
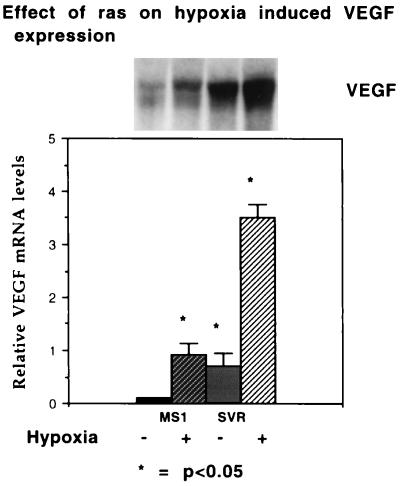
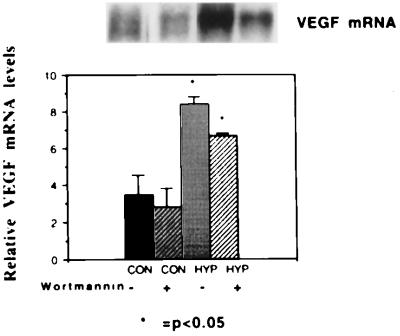
Because VEGF has been shown to be overexpressed in proliferative hemangiomas and hypoxic tumors (26–28), we examined the effect of hypoxia on production of VEGF. Hypoxia was capable of inducing VEGF mRNA in both immortalized and transformed endothelial cells (4.5-fold in cells expressing SV40 large T antigen alone or in combination with H-ras), but both baseline and induced VEGF mRNA expression was increased in cells containing activated ras (Fig. 4). The fold induction in cells containing SV40 large T antigen alone and that in cells containing SV40 large T antigen and ras together were similar, implying that ras amplifies the hypoxia-induced gene regulation of VEGF. Treatment of cells with wortmannin, a steroidal inhibitor of phosphatidylinositol-3-kinase (15), resulted in a decreased level of VEGF under hypoxic conditions but the fold stimulation of VEGF mRNA was not changed (Fig. 5).
Figure 4.
Effect of ras on hypoxic induction of VEGF. (Upper) mRNA from a representative Northern blot of MS1 and SVR cells hybridized with a murine VEGF probe. From left to right, the first lane represents MS1 cells under normoxic conditions, the second lane represents MS1 cells under hypoxic conditions, the third lane represents SVR cells under normoxic conditions, and the fourth lane represents SVR cells under hypoxic conditions. (Lower) Relative densitometric values normalized to β-actin mRNA. All experiments were performed in triplicate; the asterisk demonstrates significant differences, P < 0.05.
Figure 5.
Effect of wortmannin on hypoxic induction of VEGF. (Upper) Northern blot. From left to right, the first lane represents mRNA from SVR cells under normoxic conditions in the absence of wortmannin. The second lane represents SVR cells under normoxic conditions in the presence of 1 μg/ml wortmannin. The third lane represents mRNA from SVR cells under hypoxic conditions in the absence of wortmannin, and the fourth lane represents mRNA from SVR cells under hypoxic conditions in the presence of wortmannin. (Lower) Normalized mRNA levels, labeled as in Fig. 4.
Effect of ras and Wortmannin on MMP and TIMP Bioactivities.
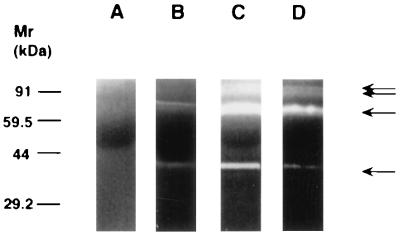
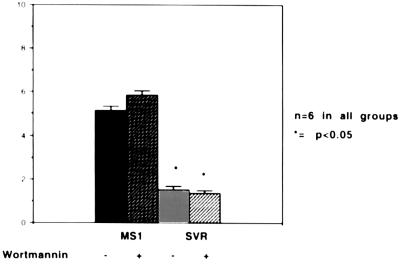
MMPs play an important role in tumor angiogenesis and are inhibited by TIMPs (5, 29). Using zymography and radiometric enzyme assays, we compared the levels of MMP and TIMP activity in cells containing SV40 large T antigen alone or in combination with activated ras (Figs. 6 and 7). MMP species were identified by Western blot analysis using commercially available antibodies against MMP-2 and MMP-9 (Oncogene Science and Biogenesis, Sandown, NH) (data not shown). Cells with activated ras demonstrated high level of expression of 72-kDa metalloproteinase (MMP-2, gelatinase A), and 92-kDa metalloproteinase (MMP-9, gelatinase B) compared with cells containing SV40 large T antigen alone. Treatment of ras-containing cells with wortmannin resulted in a decrease in MMP expression (Fig. 6). MMPs secreted in the conditioned media were active, rather than latent forms, as demonstrated by the fact that the molecular weight was not decreased by treatment with aminophenylmercuric acetate (APMA) (data not shown). In contrast, TIMP bioactivity were elevated in cells containing SV40 large T antigen alone and were significantly decreased in cells containing activated ras (Fig. 7). Treatment of ras-containing cells with wortmannin did not result in restoration of TIMP bioactivity levels to nontransformed levels.
Figure 6.
Effect of ras and wortmannin on MMP activity. Lane A represents control medium not conditioned by cells. The other lanes represent a gelatin substrate zymogram containing conditioned media from an equivalent number of MS1 (lane B), SVR (lane C), or SVR cells treated with wortmannin (lane D). A 30% decrease was seen in gelatinase activity after wortmannin treatment (n = 9).
Figure 7.
Assay of TIMP bioactivity. Conditioned media from MS1 and SVR cells in the presence or absence of wortmannin were incubated in the presence of 14C-labeled collagen. 14C released into the medium was measured by scintillography. The y axis represents inhibitory units per 105 cells.
Effect of Wortmannin on Tumor Growth in Vivo.
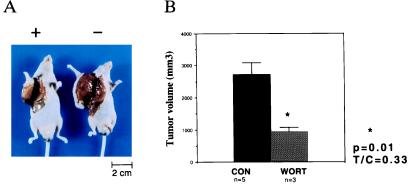
Mice bearing angiosarcomas derived from endothelial cells expressing SV40 large T and ras were treated with wortmannin or vehicle control (Fig. 8). Wortmannin treatment of mice resulted in a 66% decrease in tumor size compared with mice which received vehicle control (P < 0.05). No weight loss or other toxicity was observed in treated mice.
Figure 8.
Effect of wortmannin on SVR growth in nude mice. (A) Effect of wortmannin on the growth of SVR tumors. The mouse on the right was treated with vehicle alone, while the mouse on the left was treated with wortmannin. (B) Effect of wortmannin on tumor volume. The asterisk indicates P < 0.05.
Origin of Endothelial Cells in Hemangiomas.
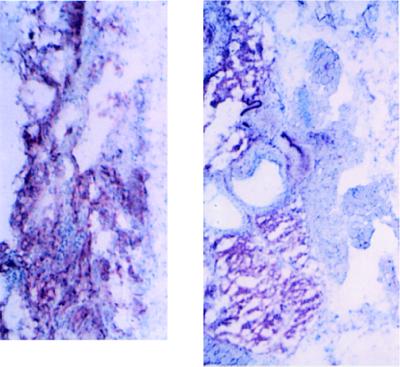
To determine whether these hemangiomas consist of predominantly host endothelium, tumor-derived endothelium, or both, we utilized the difference in HLA class 1 antigen (H-2K) expression between the host mouse and the cell line. MS1 and SVR cells are derived from C57BL/6 mice, while the nude mice in this study are derived from BALB/c backgrounds. In contrast to the recruitment of host endothelial cells seen in polyoma middle T transformed endothelial cells (30), vascular tumors containing one or two oncogenes were composed primarily of tumor endothelium (Fig. 9).
Figure 9.
Hemangiomas and angiosarcomas are derived primarily from tumor tissue. (A) Frozen section of tumor derived from MS1 cells. (B) Frozen section of tumor derived from SVR cells. Both sections are stained with a primary biotinylated mouse monoclonal antibody directed against H-2Kb, coupled to avidin-alkaline phosphatase. (×67.5.)
Overexpression of VEGF in Cells Containing SV40 Large T Antigen.
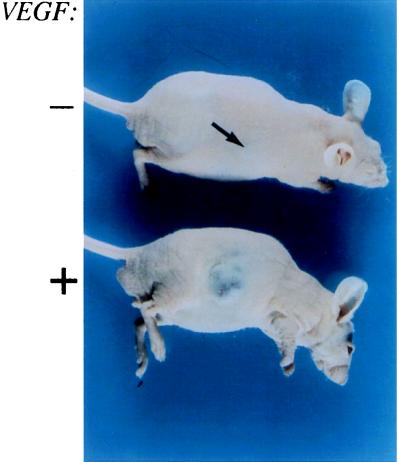
ras induces transcription of numerous genes in cells, including VEGF (31, 32). To determine whether the increased tumorigenicity of the cells containing ras was due solely to induction of VEGF, we introduced the secretory 121-amino acid isoform of VEGF into cells expressing large T antigen alone. Our cell lines express the VEGF receptor FLK-1/KDR (33, 34), implying a potential autocrine loop. Cells (1 × 10⁶) expressing either VEGF 121 and puromycin resistance or puromycin resistance alone were injected subcutaneously into nude mice. Tumors derived from cells overexpressing VEGF grew slowly to larger sizes than tumors derived from cells that express puromycin resistance alone (Fig. 10). This indicates that overexpression of VEGF in the presence of VEGF receptor contributes to tumorigenesis, but it is insufficient to recapitulate the effect of ras on transformation.
Figure 10.
Effect of overexpression of VEGF in immortalized endothelial cells. The upper mouse contains a hemangioma expressing puromycin resistance alone, while the lower mouse contains a hemangioma expressing VEGF.
DISCUSSION
Analysis of the Angiogenic Switch.
We show here that introduction of SV40 large T antigen into endothelial cells causes them to become immortal in vitro, but they remain poorly tumorigenic in vivo. These cells demonstrate low levels of the angiogenic factor VEGF and low bioactivity of MMPs. In addition, these cells have elevated activity of TIMPs. When oncogenic H-ras is introduced into the immortalized cells, highly tumorigenic angiosarcomas result. The introduction of ras leads to an 8-fold increase in proliferation in vivo, with only a slight increase in apoptotic index over tumors derived from cells containing large T antigen alone. The cells containing H-ras demonstrate elevated baseline levels of VEGF expression, and enhanced expression of VEGF under hypoxia, a known stimulator of VEGF. ras also leads to increased bioactivity of MMP-2 and MMP-9. In addition, ras decreases the activity of TIMPs. This pattern is similar to the angiogenic imbalance observed in proliferating hemangiomas (26).
These phenomena demonstrate that H-ras is capable of activating the angiogenic switch, but they do not explain its mechanism. To study this mechanism, we examined the role of the phosphatidylinositol-3-kinase pathway, a signal transduction pathway that is activated by ras and other dominant oncogenes and growth factors (6–14, 35). To evaluate the role of phosphatidylinositol-3-kinase in regulation of the angiogenic switch, we tested the effect of wortmannin, an inhibitor, on VEGF expression, as well as MMP and TIMP bioactivity. We found that wortmannin treatment results in inhibition of ras-induced VEGF mRNA expression and MMP bioactivity. However, wortmannin did not reverse the ras-mediated down-regulation of TIMP. This implies that ras stimulates tumor angiogenesis through two pathways, one of which is phosphatidylinositol-3-kinase.
Treatment of angiosarcoma with wortmannin resulted in a 66% reduction in tumor size. Wortmannin likely causes a decrease in tumor size through inhibition of angiogenesis; induction of apoptosis also occurs through angiogenesis-independent means (36). Since wortmannin inhibits VEGF and MMP activity, but does not restore TIMP activity, tumorigenesis is not expected to be fully suppressed.
We have shown that wortmannin inhibits ras-induced expression of VEGF. We also wanted to study the effect of wortmannin on the hypoxic regulation of VEGF. VEGF is an important endothelial chemoattractant which is produced by proliferative hemangiomas and hypoxic tumors (26, 37). We found that wortmannin modulates the hypoxic regulation of VEGF. Wortmannin could inhibit ras-mediated induction of VEGF, but it did not inhibit the hypoxic regulation of VEGF. This suggests that the hypoxic regulation of VEGF is independent of phosphatidylinositol-3-kinase.
Goldberg et al. (38) reported that the hypoxia sensor was likely to be a heme protein, on the basis of stimulation of erythropoietin expression by cobalt ion and inhibition by carbon monoxide, both of which bind to heme proteins. More recently, c-src has been demonstrated to mediate hypoxia-induced VEGF expression (39). These results differ from those of Goldberg et al., as c-src is not a heme protein. On the basis of our findings, a hypothesis can be generated that unifies these two findings. We propose that hypoxia-mediated gene regulation occurs through a heme protein, but amplification occurs though cellular phosphatidylinositol-3-kinase activity. c-src has been shown to activate phosphatidylinositol-3-kinase activity, and hypoxia-mediated gene induction was decreased, but not eliminated, in c-src-deficient mouse cells. The incomplete inhibition was attributed to induction of other tyrosine kinase oncogenes, such as c-fyn, but another possibility is that the c-src-deficient cells may be relatively deficient in phosphatidylinositol-3-kinase activity. Related tyrosine kinase genes such as yes and fps are associated with phosphatidylinositol-3-kinase, and they may be implicated in angiogenesis (35, 40).
Two Forms of Tumor Dormancy.
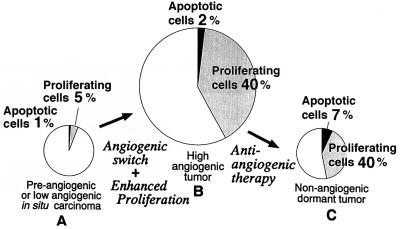
ras is capable of converting a dormant tumor with a low proliferative index to a rapidly growing tumor with a high proliferative index. ras-stimulated tumor proliferation in vivo either is dependent on angiogenesis or is an independent event. To distinguish these two possibilities, we overexpressed VEGF in cells containing large T antigen alone. MS1 cells, which contain the FLK-1/KDR receptor for VEGF, were transduced with cDNA encoding the secretory 121-residue isoform of VEGF in these cells, using a retroviral vector to determine whether overexpression of VEGF could confer a transformed phenotype. Cells overexpressing VEGF, when injected into nude mice, resulted in a very slow increase in tumor size, but did not recapitulate the phenotype of rapid growth seen with ras transformation. Therefore, angiogenesis stimulation by VEGF is insufficient to convert a dormant tumor into a rapidly growing tumor when the dormant tumor has a low proliferative index. Further genetic changes are likely required for tumor growth in vivo (41, 42). Thus, two forms of tumor dormancy can be distinguished by in vivo proliferation rates, and in both cases, in vivo proliferation and angiogenesis are independent processes. This conclusion is illustrated in Fig. 11.
Figure 11.
Proposed model for tumor dormancy. (A) Dormant tumor with low proliferation and apoptotic indices. Introduction of ras activates the angiogenic switch and enhances the ability of the tumor to proliferate in vivo (B). Treatment of a proliferative tumor (B) with an angiogenesis inhibitor results in a dormant tumor (C), in which the proliferative index is elevated, as in B, but the apoptotic index is increased.
Our findings have implications in the prognosis and treatment of angiogenic disorders, both benign and malignant. First, determination of the apoptosis and proliferation index of tumor biopsies may allow greater accuracy in the prediction of the clinical behavior of a tumor. Second, tumors with dormancy due to angiogenesis inhibition may be more sensitive to chemotherapy because a greater proportion of cells are cycling. Third, certain dominant oncogenes are capable of changing the balance in favor of angiogenesis stimulation over inhibition. Fourth, inhibition of both ras-induced tumor angiogenesis pathways may be necessary to inhibit tumor angiogenesis in cells containing activated ras.
Acknowledgments
We acknowledge Brian Casey for assistance with frozen sections and Sudipta Mahajan for assistance with Western blotting. We acknowledge Shmuel Ben-Sasson and Shay Soker for helpful advice and discussion. J.L.A. was supported by a Howard Hughes Postdoctoral Fellowship, a grant from the Society for Pediatric Dermatology, and a grant to Children’s Hospital from EntreMed, Inc., Rockville, MD.
Footnotes
.
Abbreviations: SV40, simian virus 40; VEGF, vascular endothelial growth factor; MMP, matrix metalloproteinase; TIMP, tissue inhibitor of MMP; diI-Ac-LDL, 1,1′-dioctadecyl-3,3,3′,3′-tetramethylindocyanine perchlorate conjugated to acetylated low density lipoprotein.
References
- 1.Folkman J, Hanahan D. Cell. 1996;86:353–364. doi: 10.1016/s0092-8674(00)80108-7. [DOI] [PubMed] [Google Scholar]
- 2.Folkman J, Watson K, Ingber D, Hanahan D. Nature (London) 1989;339:58–61. doi: 10.1038/339058a0. [DOI] [PubMed] [Google Scholar]
- 3.Kandel J, Bossy-Wetzel E, Radvanyi F, Klagsbrun M, Folkman J, Hanahan D. Cell. 1991;66:1095–1104. doi: 10.1016/0092-8674(91)90033-u. [DOI] [PubMed] [Google Scholar]
- 4.Moses M A, Sudhalter J, Langer R. Science. 1990;248:1408–1410. doi: 10.1126/science.1694043. [DOI] [PubMed] [Google Scholar]
- 5.Liotta L A, Steeg P S, Stetler-Stevenson W G. Cell. 1991;64:327–336. doi: 10.1016/0092-8674(91)90642-c. [DOI] [PubMed] [Google Scholar]
- 6.Whitman M, Kaplan D R, Schaffhausen B, Cantley L, Roberts T M. Nature (London) 1985;315:239–242. doi: 10.1038/315239a0. [DOI] [PubMed] [Google Scholar]
- 7.Rodriguez-Viciana P, Warne P H, Dhand R, Vanhaesebroeck B, Gout I, Fry M J, Waterfield M D, Downward J. Nature (London) 1994;370:527–532. doi: 10.1038/370527a0. [DOI] [PubMed] [Google Scholar]
- 8.Cantley L C, Auger K R, Carpenter C, Duckworth B, Graziani A, Kapeller R, Soltoff S. Cell. 1991;64:281–302. doi: 10.1016/0092-8674(91)90639-g. [DOI] [PubMed] [Google Scholar]
- 9.Bolen J B, Thiele C J, Israel M, Yonemoto W, Lipsich L A, Brugge J S. Cell. 1984;38:767–777. doi: 10.1016/0092-8674(84)90272-1. [DOI] [PubMed] [Google Scholar]
- 10.Auger K R, Carpenter C L, Shoelson S E, Piwnica-Worms H, Cantley L C. J Biol Chem. 1992;267:5408–5415. [PubMed] [Google Scholar]
- 11.Hu Q, Klippel A, Muslin A J, Fantl W J, Williams L T. Science. 1995;268:100–102. doi: 10.1126/science.7701328. [DOI] [PubMed] [Google Scholar]
- 12.Sjolander E, Yamamoto K, Juber B E, Lapetina E G. Proc Natl Acad Sci USA. 1991;88:17908–17912. [Google Scholar]
- 13.Carraway K L, Soltoff S P, Diamonti A J, Cantley L C. J Biol Chem. 1995;270:7111–7116. doi: 10.1074/jbc.270.13.7111. [DOI] [PubMed] [Google Scholar]
- 14.Lowy D R, Willumsen B M. Annu Rev Biochem. 1993;62:851–891. doi: 10.1146/annurev.bi.62.070193.004223. [DOI] [PubMed] [Google Scholar]
- 15.Powis G, Bonjouklian R, Berggren M M, Gallegos A, Abraham R, Ashendel C, Zalkow L, Matter W F, Dodge J, Grindley G, Vlahos C J. Cancer Res. 1994;54:2419–2423. [PubMed] [Google Scholar]
- 16.Jat P S, Sharp P A. Mol Cell Biol. 1989;9:1672–1680. doi: 10.1128/mcb.9.4.1672. [DOI] [PMC free article] [PubMed] [Google Scholar]
- 17.Voyta J C, Via D P, Butterfield C E, Zetter B R. J Cell Biol. 1984;99:2034–2040. doi: 10.1083/jcb.99.6.2034. [DOI] [PMC free article] [PubMed] [Google Scholar]
- 18.Dotto G P, Parada L F, Weinberg R A. Nature (London) 1985;318:472–475. doi: 10.1038/318472a0. [DOI] [PubMed] [Google Scholar]
- 19.Dhar R, Ellis R W, Shih T Y, Oroszlan S, Shapiro B, Maizel J, Lowy D, Scolnick E. Science. 1982;217:934–936. doi: 10.1126/science.6287572. [DOI] [PubMed] [Google Scholar]
- 20.Morgenstern J P, Land H. Nucleic Acids Res. 1990;18:3587–3596. doi: 10.1093/nar/18.12.3587. [DOI] [PMC free article] [PubMed] [Google Scholar]
- 21.Gratzner H G. Science. 1982;218:474–475. doi: 10.1126/science.7123245. [DOI] [PubMed] [Google Scholar]
- 22.Gavrieli Y, Sherman Y, Ben-Sasson S A. J Cell Biol. 1992;119:493–501. doi: 10.1083/jcb.119.3.493. [DOI] [PMC free article] [PubMed] [Google Scholar]
- 23.Herron G S, Werb Z, Dwyer K, Banda M J. J Biol Chem. 1986;261:2810–2813. [PubMed] [Google Scholar]
- 24.Braunhut S J, Moses M A. J Biol Chem. 1994;269:13472–13479. [PubMed] [Google Scholar]
- 25.Holmgren L, O’Reilly M S, Folkman J. Nat Med. 1995;1:149–155. doi: 10.1038/nm0295-149. [DOI] [PubMed] [Google Scholar]
- 26.Takahashi K, Mulliken J B, Kozakewich H P, Rogers R A, Folkman J, Ezekowitz R A. J Clin Invest. 1994;93:2357–2364. doi: 10.1172/JCI117241. [DOI] [PMC free article] [PubMed] [Google Scholar]
- 27.Shweiki D A, Itin A, Soffer D, Keshet E. Nature (London) 1992;359:843–844. doi: 10.1038/359843a0. [DOI] [PubMed] [Google Scholar]
- 28.Plate K H, Breier G, Weich H A, Risau W. Nature (London) 1992;359:845–847. doi: 10.1038/359845a0. [DOI] [PubMed] [Google Scholar]
- 29.Woessner J F. Ann NY Acad Sci. 1994;732:11–21. doi: 10.1111/j.1749-6632.1994.tb24720.x. [DOI] [PubMed] [Google Scholar]
- 30.Williams R L, Risau W, Zerwes H G, Drexler H, Aguzzi A, Wagner E F. Cell. 1989;57:1053–1063. doi: 10.1016/0092-8674(89)90343-7. [DOI] [PubMed] [Google Scholar]
- 31.Rak J, Mitsuhashi Y, Bayko L, Filmus J, Shirasawa S, Sasazuki T, Kerbel R S. Cancer Res. 1995;55:4575–4580. [PubMed] [Google Scholar]
- 32.Grugel S, Finkenzeller G, Weindel K, Barleon B, Marme D. J Biol Chem. 1995;270:25915–25919. doi: 10.1074/jbc.270.43.25915. [DOI] [PubMed] [Google Scholar]
- 33.Millauer B, Wizigman-Voos S, Schnurch H, Martinez R, Moller N P, Risau W, Ullrich A. Cell. 1993;72:835–846. doi: 10.1016/0092-8674(93)90573-9. [DOI] [PubMed] [Google Scholar]
- 34.Risau W. FASEB J. 1995;8:926–933. [PubMed] [Google Scholar]
- 35.Fukui Y, Saltiel A R, Hanafusa H. Oncogene. 1991;6:407–411. [PubMed] [Google Scholar]
- 36.Yao R, Cooper G M. Science. 1995;267:2003–2006. doi: 10.1126/science.7701324. [DOI] [PubMed] [Google Scholar]
- 37.Senger D R, Galli S J, Dvorak A M, Perruzzi C A, Harvey V S, Dvorak H F. Science. 1983;219:983–985. doi: 10.1126/science.6823562. [DOI] [PubMed] [Google Scholar]
- 38.Goldberg M A, Dunning S P, Bunn H F. Science. 1988;242:1412–1415. doi: 10.1126/science.2849206. [DOI] [PubMed] [Google Scholar]
- 39.Mukhopadhyay D, Tsiokas L, Zhou X M, Foster D, Brugge J S, Sukhatme V P. Nature (London) 1995;375:577–581. doi: 10.1038/375577a0. [DOI] [PubMed] [Google Scholar]
- 40.Greer P, Haigh J, Mbamalu G, Khoo W, Bernstein A, Pawson T. Mol Cell Biol. 1994;14:6755–6763. doi: 10.1128/mcb.14.10.6755. [DOI] [PMC free article] [PubMed] [Google Scholar]
- 41.Rak J, Mitsuhashi Y, Erdos V, Huang S, Filmus J, Kerbel R S. J Cell Biol. 1995;131:1587–1598. doi: 10.1083/jcb.131.6.1587. [DOI] [PMC free article] [PubMed] [Google Scholar]
- 42.Guadagno T M, Ohtsubo M, Roberts J M, Assoian R. Science. 1993;262:1572–1575. doi: 10.1126/science.8248807. [DOI] [PubMed] [Google Scholar]


