Abstract
Catenins are proteins associated with the cytoplasmic domain of cadherins, a family of transmembrane cell adhesion molecules. The cadherin–catenin adhesion system is involved in morphogenesis during development and in the maintenance of the integrity of different tissue types. Using a gene trap strategy, we have isolated a mouse mutation for the gene encoding the α-E-catenin. This form of the α-catenin appears frequently coexpressed with E-cadherin in epithelial cell types. The mutation obtained eliminates the carboxyl-terminal third of the protein but nevertheless provokes a complete loss-of-function phenotype. Homozygous mutants show disruption of the trophoblast epithelium (the first differentiated embryonic tissue), and development is consequently blocked at the blastocyst stage. This phenotype parallels the defects observed in E-cadherin mutant embryos. Our results show the requirement of the α-E-catenin carboxy terminus for its function and represent evidence of the role of the α-E-catenin in vivo, identifying this molecule as the natural partner of the E-cadherin in trophoblast epithelium.
Keywords: cell adhesion, blastocyst, epithelial cells
Cadherins constitute a family of transmembrane cell adhesion molecules mediating homophilic cell–cell adhesion (1). To form a functional complex, they require association with the cytoplasmic proteins catenins (2). Two different classes of molecularly unrelated catenins have been defined, the α- and β-catenins. Both are required to obtain a functional complex (3, 4). The minimal cadherin–catenin complex is composed of cadherin, β-catenin or plakoglobin, and α-catenin molecules (5–7). In this complex, β-catenin binds directly to the cadherin cytoplasmic domain and α-E-catenin binds to β-catenin, without direct interaction with cadherin (8). Binding of the complex to the actin-based cytoskeleton is considered essential for its functional organization. α-Catenin has been found to bind actin (9) and to mediate the binding of α-actinin to the cadherin–catenin complex (10) and therefore stands out as the best candidate for the molecule binding the complex to the cytoskeleton.
The cadherin family is very diverse, and a large number of members have been identified (11). This diversity is possibly related to the establishment and maintenance of cohesive interactions within many different embryonic and adult tissues. In contrast, only two α-catenins (12–14), one β-catenin (15, 16), and the related molecule plakoglobin (17) have been described (2). It is therefore likely that there is a considerable degree of promiscuity of catenins in their association with the different cadherins. In fact, in vitro experiments demonstrated that the two α-catenins, E and N, are functionally interchangeable (14). Despite this functional redundancy in vitro, expression of the two α-catenins is temporally and spatially regulated in vivo, suggesting their functional specialization. α-E-catenin tends to be expressed in epithelial cell types, coinciding in many tissues with the expression of the E-cadherin (18, 19). A mouse mutation of the E-cadherin obtained by gene targeting disrupts the formation of the trophectoderm, which is the first epithelial tissue to differentiate in the mouse embryo (20, 21).
We present here the molecular and developmental analysis of the mutant phenotype of a gene trap-induced mouse mutation of the α-E-catenin gene. Gene trapping is an efficient way to target endogenous genes in embryonic stem (ES) cells, it is a highly mutagenic screen and allows monitoring of the expression of the endogenous promoter by a LacZ reporter gene (22–24). The mutation obtained for the α-E-catenin gene specifically deletes the region encoding the carboxyl-terminal third of the protein and results in a phenotype similar to the E-cadherin mutant. The results presented provide evidence of the role of the α-E-catenin in vivo and show that this molecule is required for the formation of the trophectoderm at the blastocyst stage, identifying it as the in vivo partner of E-cadherin in preimplantation development.
MATERIALS AND METHODS
Gene Trap Strategy.
The gene trap vector pGT1.8geo (25) containing the β-geo reporter-selectable marker (23) was electroporated in R1 ES cells (26) as described (27). Positive clones were stained for detection of LacZ expression and used to generate mouse chimeras by morula aggregation as described (26). The expression patterns of the trapped genes was determined by whole mount LacZ staining of heterozygous embryos as described (28).
5′ Rapid Amplification of cDNA Ends (RACE).
Total RNA from the ES cell clone VII-45 was used for 5′ RACE using the GIBCO/BRL kit (no. 8374SA). The primers used are shown in Fig. 1. RACE products were cloned in a pGem-T vector (Promega).
Figure 1.
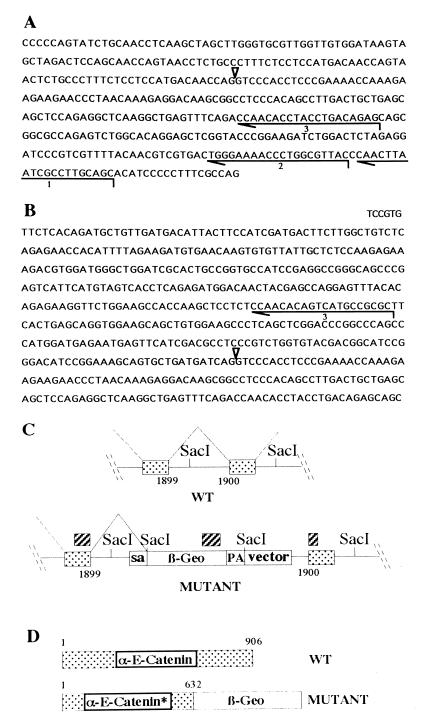
Characterization of the gene trap vector insertion into the α-E-catenin locus. (A) Sequence of the gene trap vector around the splice acceptor site, which is indicated by an arrowhead. Lines 1, 2, and 3 show the primers used for cDNA synthesis, first and second PCR amplification rounds, respectively. (B) Sequence obtained by 5′ RACE from total RNA isolated from α-E-cateninGT1 heterozygous ES cells. Note the truncation of the vector sequence at exactly the splice acceptor site. The new sequence incorporated by splicing ends at the nucleotide number 1899 of the α-E-catenin coding region. (C) Structure of the insertion obtained. The hatched boxes indicate the 5′, internal, and 3′ probes used to characterize the insertion site. The SacI sites are represented to show the restriction fragment polymorphism used to identify the mutant allele. (D) Predicted structure of the mutant fusion protein produced. sa, Splice acceptor; pa, polyadenilation signal; WT, wild type.
Genotyping of Mice and Cell Lines.
Southern blot analysis was performed to identify the presence of the mutant and wild-type alleles. A probe shown in Fig. 1 that recognizes a 4.2-kb SacI band in the mutant allele and a 3-kb SacI band in the wild-type allele was used.
Embryo and ES Cell Culture.
Preimplantation embryos were retrieved from the oviduct by flushing with M2 medium and cultured in microdrops of M16 under mineral oil at 37°C in 5% CO2/95% air. To establish cell lines from the blastocysts, the zona pellucida was removed by incubation in acid Tyrode solution, and blastocysts were plated individually in 96-well plates in M16 medium. After 5 days, they were trypsinized, transferred to ES cell culture conditions, and expanded.
Immunoprecipitations and Immunoblotting.
Immunoprecipitations on 35S metabolically labeled cell lysates were performed as described (5). Lysates were adjusted by measuring the incorporated radioactivity after trichloroacetic acid precipitation. After SDS/PAGE, gels were fixed in 10% (vol/vol) acetic acid, incubated for 30 min in 1 M Na-salicylate and subsequently dried for fluorography. For immunodetection, the SDS/PAGE-separated proteins were transferred electrophoretically to nitrocellulose membranes, blocked in 10 mM Tris·HCl (pH 7.4), 150 mM NaCl, and 0.1% Tween 20 for 1 h at room temperature and incubated with antibodies, 1 h with the primary antibody, and 1 h with peroxidase-conjugated secondary antibody (Dianova, Hamburg, Germany). For detection, the ECL system (Amersham) was used according to the manufacturer’s instructions. CMT cells used as controls are a mouse rectum carcinoma cell line with epithelial morphology (ATCC CCL 223).
Immunofluorescence in Blastocysts.
Blastocysts were fix in 2% paraformaldehide for 20 min, permeabilized in 0.02% Triton X-100 for 20 min, preincubated in 2% fetal calf serum in PBS 1 h, incubated for 1 h in the primary antiboby, washed for 1 h in PBS, and incubated for 30 min in the secondary antibody.
Antibodies.
For immunological work, affinity-purified antipeptide antibodies against catenins were used as described (5). Rabbit antiserum against mouse E-cadherin was raised against the recombinant extracellular domain of E-cadherin expressed in insect cells (29) and affinity-purified. Purified antibodies (20 ng/ml) were used for enhanced chemiluminescence detection on immunoblots and 2–5 μg for immunoprecipitations.
RESULTS
Characterization of the Gene Trap Insertion and LacZ Activity in Mice.
In a large-scale gene trap screening program, we have isolated an ES cell clone trapping a promoter showing an interesting spatio-temporal expression pattern. Using 5′ RACE from the known reporter gene sequences, a fragment of the endogenous gene was cloned. The sequence of the 5′ RACE product revealed an insertion into the coding region of the α-E-catenin. (Fig. 1 A and B). The sequence obtained shows an in-frame fusion of the reporter β-geo gene to the α-E-catenin after the position encoding the amino acid 632 of the 906 aa composing the protein (12, 13) (Fig. 1 C and D). We refer to this mutation as α-E-cateninGT1. The insertion predicts the expression of the reporter protein β-geo, fused to the truncated α-E-catenin protein, under the influence of the α-E-catenin gene control regions.
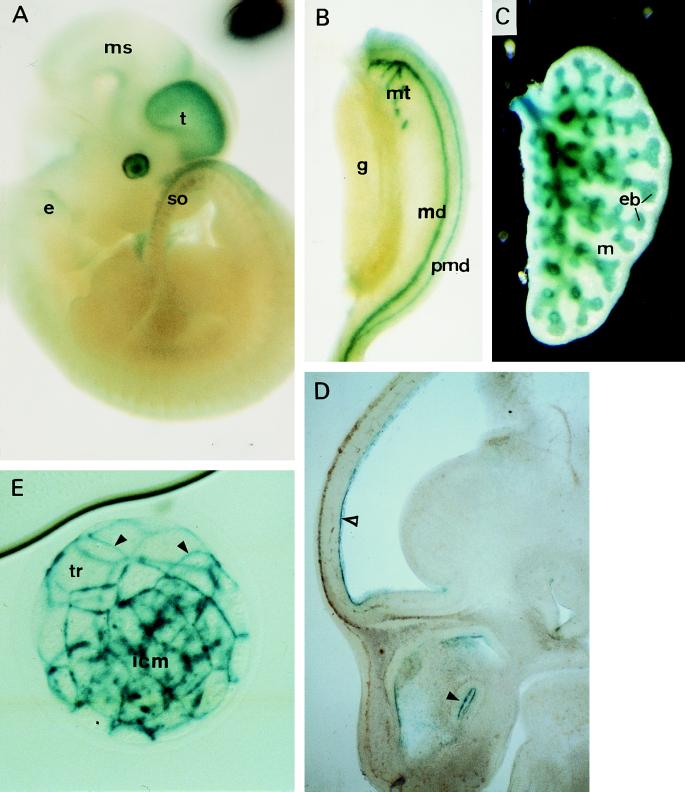
We found that the LacZ reporter gene is extensively expressed during embryonic development, mostly confined to all epithelial tissues irrespectively of their germ layer origin. Expression in epithelia occurs both in transient embryonic structures, such as somites, mesonephros, and early neural epithelium, as well as in definitive epithelia in different viscera, such as lungs, pancreas, gut, kidney, and ependymal layer in the central nervous system, among others (Fig. 2). The LacZ expression observed is in agreement with and extends previously reported expression data of α-E-catenin (19, 30).
Figure 2.
β-Galactosidase expression in α-E-cateninGT1 heterozygous embryos. All plates show specimens stained for detection of β-galactosidase. (A) Whole mount E12 embryo. (B) Mesonephros and gonad stained after dissection from an E12 embryo. (C) A lung primordium from the same embryo. (D) Detail of the head region of a sagittal section of an E13 embryo after β-galactosidase staining. (E) Whole mount expanded blastocyst. e, Inner ear; eb, epithelial branches in the lung; g, gonad; icm, inner cell mass; m, mesenchyme of the lung; md, mesonephric duct; ms, mesencephalon; mt, mesonephric tubules; pmd, paramesonephric duct; so, somites; t, telencephalon; tr, trophoblast. Arrowheads in E point to the junctions between trophoblast cells. Open arrowhead in D points to the ventricular layer of the prospective telencephalic cortical region, and filled arrowhead points to the nasal epithelium.
During preimplantational embryonic development, LacZ is extensively expressed and coincides with the expression pattern described for the E-cadherin (31). In addition, as the trophoblast is being formed, LacZ signal localizes to the cell junctions between trophoblast cells, similar to E-cadherin and endogenous α-E-catenin (Fig. 2E). Targeting of the β-geo reporter protein to the cell-to-cell junction confirms the production of the predicted fusion to the endogenous α-E-catenin.
Phenotypic Analysis of the α-E-cateninGT1 Mutation.
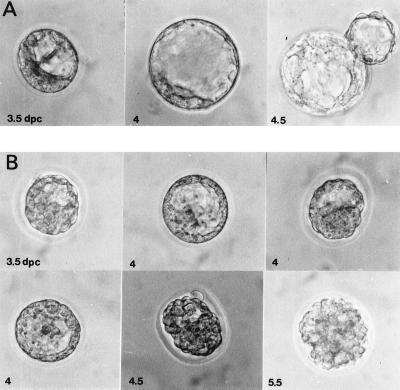
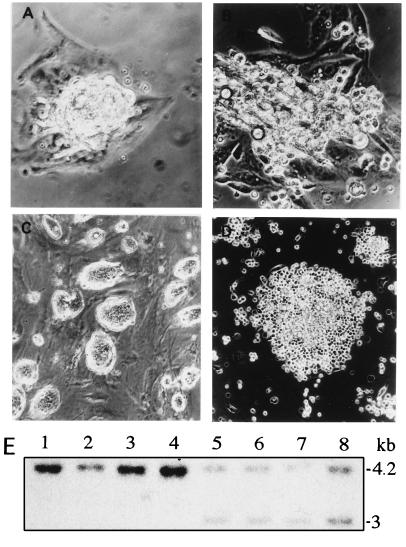
To genetically analyze the function of this gene, we produced mice homozygous for α-E-cateninGT1. Heterozygous animals were found at the expected ratio during all gestational stages tested and after birth; however, no homozygous embryos were found either after birth or at any postimplantation stage (out of 238 specimens analyzed). To study a possible defect during preimplantation development, we cultured mutant embryos in vitro. At 3.5 days postcoitum (dpc), wild-type embryos produce an expanded blastocyst cavity and by 4.5 dpc, they hatch (Fig. 3A). About one-fourth of the embryos deriving from crosses between heterozygous α-E-cateninGT1 mice produce blastocysts that show a reduced expansion of the blastocoelic cavity at 3.5 dpc (Fig. 3B; Table 1). During the next 24 h of in vitro culture, the abnormal embryos repeatedly swell and collapse, without being able to generate a blastocoelic cavity. After this period, they become completely disorganized and are constituted of a mass of rounded cells which remain inside the zona pellucida without hatching (Fig. 3B). These abnormalities were never found when control crosses were established. In addition, blue staining of the preimplantational embryos show three classes of staining intensity: no staining, medium staining, and strong staining. While normal embryos show either medium or no staining, abnormal embryos always show strong staining (Table 1). This last class is likely to represent the homozygous mutants, which contain two copies per cell of the LacZ gene (Table 1). The zona pellucida from normal and abnormal embryos was then removed and embryos were cultured further. While normal embryos developed an outgrowth of the inner cell mass in the form of intimately associated cells, abnormal ones produced cells that remained round and did not adhere to each other (Fig. 4 A–D). Cell lines were established from both types of embryos (four from each category). The lines deriving from the normal embryos show a typical ES morphology, while the lines deriving from the abnormal embryos divide normally, but remain round and do not adhere to one another. Genotyping of the cell lines showed that the four lines that do not adhere were homozygous for the gene trap insertion, while the four remaining lines were heterozygous (Fig. 4E).
Figure 3.
Mutant phenotype of α-E-cateninGT1 blastocysts. (A) Sequence of three time points between 3.5 and 4.5 days of in vitro development of a wild-type blastocyst. 3.5 dpc, Early blastocyst; 4 dpc, expanded blastocyst; 4.5 dpc, hatching blastocyst. (B) Sequence of six time points between 3.5 and 5.5 days of in vitro development of an abnormally developing embryo derived from a cross between α-E-cateninGT1 heterozygous animals.
Table 1.
Preimplantation mutant phenotype
| Embryo | Intensity of LacZ staining
|
α-E-catenin immunostaining
|
Total | |||
|---|---|---|---|---|---|---|
| ++ | + | − | + | − | ||
| Normal | 0 | 20 | 11 | 29 | 0 | 60 |
| Abnormal | 12 | 0 | 0 | 0 | 11 | 23 |
Figure 4.
Evolution of cultured blastocysts and genotyping of cell lines derived from normally and abnormally developing embryos. (A and B) Primary cultures of normally and abnormally developing blastocysts after zona pellucida removal and 5 days of culture, respectively. (C and D) Established cell lines derived from normally and abnormally developing embryos, respectively. (E) Genotyping of the established cell lines by Southern blot analysis following the strategy described in Fig. 1. Lanes 1–4 correspond to cell lines derived from abnormally developing embryos, and lanes 5–8 correspond to lines derived from normal embryos. The 4.2-kb band identifies the mutant allele, and the 3-kb band identifies the wild-type allele.
Composition of the Cadherin–Catenin Complex in α-E-cateninGT1 Mutant Cell Lines and Embryos.
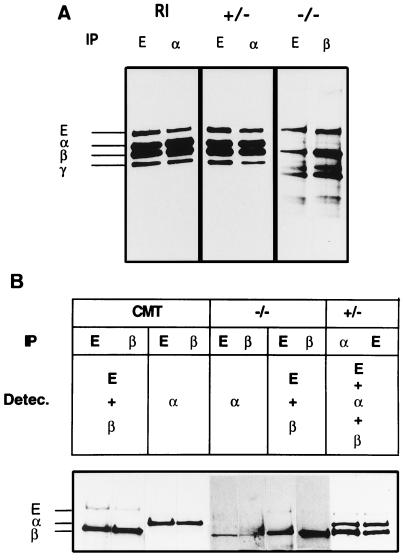
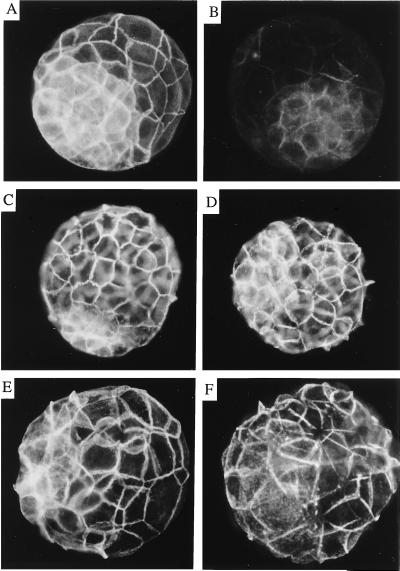
Immunoprecipitations using either anti E-cadherin or anti-α-E-catenin antibodies detect all the components of the cadherin complex in both wild-type and heterozygous ES cells (Fig. 5). In contrast, α-E-catenin is not detected in homozygous mutant cells with an antibody specific for the deleted carboxyl-terminal region, indicating that the mutation completely eliminates the production of wild-type protein. Interestingly, β-catenin and E-cadherin coprecipitate in mutant cells, showing that in the absence of wild-type α-E-catenin, β-catenin still binds to the E-cadherin. However, the abundance of the E-cadherin–β-catenin complexes is very much reduced in mutant cells because only a vastly extended exposure time (14 times longer than control) allowed detection of these proteins in a complexed form. One possible explanation is that the mutant protein has a direct destabilizing effect on the complex. In that case, the primary cause of the mutant phenotype would be the displacement of E-cadherin and β-catenin from the cell junction in the blastocyst. To test this possibility, the expression and localization of E-cadherin, β-catenin, and α-E-catenin were analyzed in wild-type and mutant blastocysts (Fig. 6). The expression of wild-type α-E-catenin was determined in preimplantational stages using an antibody specific for the carboxy terminus of the protein, the region deleted in the mutant protein. During morula stages, we detected normal levels of the wild-type protein in all embryos; however, this expression is dramatically reduced to residual levels in those embryos that start to exhibit signs of the mutant phenotype around 3.5 dpc (Fig. 6 A and B). Residual staining was not detected at later embryonic stages, strongly suggesting that the staining observed in early embryos is of maternal origin. In all cases, the presence of the mutant phenotype correlates with the dramatic reduction or absence of detectable levels of the wild-type protein (Table 1). Staining for wild-type α-E-catenin was therefore used to select embryos where the protein has already mostly disappeared from the cell-to-cell junction but in which the general architecture of the embryo is still retained (Fig. 6 A and B). The selected embryos were subsequently subjected to immunostaining for detection of E-cadherin and β-catenin. Despite the presence of, at most, residual levels of α-E-catenin, no obvious change was found in the intensity or distribution of either E-cadherin or β-catenin in α-E-cateninGT1 mutant embryos. These observations suggest that the primary cause for the loss of adhesiveness is not the disassembly of any of the known essential components of the complex.
Figure 5.
Identification of the components of the cadherin–catenin complex in wild-type and mutant ES cells. (A) Cell lysates of metabolically labeled R1 (parental ES cell line), α-E-cateninGT1 heterozygous (+/−) and α-E-cateninGT1 homozygous (−/−) cells were precipitated with anti-E-cadherin, β- or α-catenin, as shown. Fluographs from R1 and heterozygous cells were exposed for 24 h, and those from homozygous mutant cells required 14 days exposure to detect a similar signal for E-cadherin and β-catenin. The positions of E-cadherin, α-catenin, β-catenin, and plakoglobin are shown on the left. (B) Cell lysates from CMT, −/− ES, and +/− ES cells were immunoprecipitated with anti-E-cadherin, β-catenin, or α-catenin antibodies as shown. Subsequently blots were subjected to ECL-detection with different combinations of the three antibodies, as shown. Again, the lanes corresponding to the homozygous mutant cells were overexposed to detect E-cadherin and β-catenin. Lanes 5 and 6 show a background band at the level of the β-catenin. This band is unspecific and appears as well in overexposures of CMT cells (lanes 3 and 4,and data not shown). The positions of the components of the complex are indicated on the left.
Figure 6.
Immunofluorescent detection of the components of the cadherin–catenin complex in mutant blastocysts. Blastocysts showing normal development (A, C, and E) and blastocysts showing a mutant phenotype (B, D, and F) were incubated with anti-α-catenin primary antibody and a fluorescein-conjugated secondary antibody. Normally developing embryos were positive for α-E-catenin, and embryos showing the mutant phenotype were negative or showed residual staining for α-E-catenin. Examples of a normal embryo showing a positive signal and a mutant embryo showing residual staining are shown in A and B, respectively. The photograph in B was exposed three times longer than photograph in A to show the residual staining. Mutant and wild-type embryos were then incubated with anti-E-cadherin (C and D) or anti-β-catenin (E and F) and a Cy3-conjugated secondary antibody.
DISCUSSION
Evidence obtained in vitro has shown that α-E-catenin is an essential component of the cadherin complex (14). Both α-catenins identified to date (E and N) appear equivalent in conferring epithelial phenotype in cell lines in vitro. Our results show that α-E-catenin is essential for the formation of the first tissue to differentiate in the mouse embryo, the trophoblast epithelium. Previous evidence had shown that E-cadherin is also required for the formation of the trophectoderm in the mouse blastocyst (20, 21). The similar phenotype observed in the α-E-catenin mutant embryos indicates that this molecule is an indispensable component of the E-cadherin functional complex in the blastocyst and that related molecules are not able to substitute for it in the formation of the trophoblast epithelial junction. Thus, even though in vitro different cadherin–catenin combinations are able to promote similar phenotypic changes, subtle differences may exist between the different possible complexes which determine their specificity in vivo. In particular, E-cadherin and α-E-catenin appear frequently coexpressed in epithelial cell types. Epithelial cells form an specialized junction, the zona adherens, essential for maintenance of the epithelial cell polarity and the sealing between the apical and basal extracellular compartments. It is therefore possible that, while a less specific, diffuse adhesion may be provided by a variety of cadherin–catenin combinations, the building of the more specialized zona adherens in epithelial cells requires specific features of the E-cadherin and α-E-catenin molecules.
The absolute requirement for α-E-catenin in trophoblast formation contrasts with the dispensability for β-catenin (32). β-Catenin has, in addition to its structural role in the complex, important signaling functions in development, cell proliferation, and cell behavior, as revealed by biochemical and functional evidence (33). Signaling is probably the most relevant function of β-catenin because, in its absence, a chimeric protein composed of cadherin and α-catenin is partially functional in cell adhesion (18). These results may explain the dispensability of β-catenin during blastocyst formation, where its structural function is probably replaced by related proteins such as plakoglobin and, in contrast, its absolute requirement during gastrulation (32), when important signaling functions have been proposed for this molecule (34).
The fusion protein generated by the gene trap insertion only lacks the carboxyl-terminal part of α-E-catenin. We have detected the mutant protein in the heterozygous mutant blastocysts localized to the junctions between the cells (Fig. 4E), suggesting that the ability of the mutant protein to bind to the complex is kept. In addition, both cadherin and β-catenin localize to the cell junction in homozygous mutant embryos and associate together in homozygous mutant cells. These observations are consistent with the current view of the assembly of the cadherin–catenin complex and suggest that the regions of α-E-catenin involved in binding to β-catenin are conserved in the mutant protein. Binding of the cadherin–catenin complexes to cytoskeletal components has been proposed to be essential for the binding activity, and biochemical evidence points to α-E-catenin as being responsible for this interaction (9, 10).
It is therefore possible that the carboxyl-terminal regions deleted in the mutant include those needed for the interaction with cytoskeletal components. In this case, the mutant phenotype would result from the inability of the cadherin–catenin complexes to interact with cytoskeletal components and thereby achieve a stable and functional epithelial junction.
Acknowledgments
We are grateful to Sharif Mahsur, Jens Krull, and Ronald Scholz for technical assistance. We thank Angel Sanz, Inés Poveda, and R. Altschäffel for photographic work and Cathy Mark and Amparo Cano for critical reading of the manuscript. M.T. received support from the European Molecular Biology Organization and the European Community.
Footnotes
Abbreviations: ES cell, embryonic stem cell; RACE, rapid amplification of cDNA ends; dpc, days postcoitum.
References
- 1.Takeichi M. Science. 1991;251:1451–1455. doi: 10.1126/science.2006419. [DOI] [PubMed] [Google Scholar]
- 2.Kemler R. Trends Genet. 1993;9:317–321. doi: 10.1016/0168-9525(93)90250-l. [DOI] [PubMed] [Google Scholar]
- 3.Ozawa M, Baribault H, Kemler R. EMBO J. 1989;8:1711–1717. doi: 10.1002/j.1460-2075.1989.tb03563.x. [DOI] [PMC free article] [PubMed] [Google Scholar]
- 4.Nagafuchi A, Takeichi M. Cell Regul. 1989;1:37–44. doi: 10.1091/mbc.1.1.37. [DOI] [PMC free article] [PubMed] [Google Scholar]
- 5.Butz S, Kemler R. FEBS Lett. 1994;355:195–200. doi: 10.1016/0014-5793(94)01205-9. [DOI] [PubMed] [Google Scholar]
- 6.Hinck L, Näthke I S, Papkoff J, Nelson W J. J Cell Biol. 1994;125:1327–1340. doi: 10.1083/jcb.125.6.1327. [DOI] [PMC free article] [PubMed] [Google Scholar]
- 7.Näthke I S, Hinck L, Swedlow J R, Papkoff J, Nelson W J. J Cell Biol. 1994;125:1341–1352. doi: 10.1083/jcb.125.6.1341. [DOI] [PMC free article] [PubMed] [Google Scholar]
- 8.Aberle H, Butz S, Stappert J, Weissig H, Kemler R, Hoschuetzky H. J Cell Sci. 1994;107:3655–3663. doi: 10.1242/jcs.107.12.3655. [DOI] [PubMed] [Google Scholar]
- 9.Rimm D L, Koslov E R, Kebriaei P, Cianci C D, Morrow J S. Proc Natl Acad Sci USA. 1995;92:8813–8817. doi: 10.1073/pnas.92.19.8813. [DOI] [PMC free article] [PubMed] [Google Scholar]
- 10.Knudsen K A, Soler A P, Johnson K R, Wheelock M J. J Cell Biol. 1995;130:67–77. doi: 10.1083/jcb.130.1.67. [DOI] [PMC free article] [PubMed] [Google Scholar]
- 11.Suzuki S, Sano K, Tanihara H. Cell Regul. 1991;2:261–270. doi: 10.1091/mbc.2.4.261. [DOI] [PMC free article] [PubMed] [Google Scholar]
- 12.Herrenknecht K, Ozawa M, Eckerskorn C, Lottspeich F, Lenter M, Kemler R. Proc Natl Acad Sci USA. 1991;88:9156–9160. doi: 10.1073/pnas.88.20.9156. [DOI] [PMC free article] [PubMed] [Google Scholar]
- 13.Nagafuchi A, Takeichi M, Tsukita S. Cell. 1991;65:849–857. doi: 10.1016/0092-8674(91)90392-c. [DOI] [PubMed] [Google Scholar]
- 14.Hirano S, Kimoto N, Shimoyama Y, Hirohashi S, Takeichi M. Cell. 1992;70:293–301. doi: 10.1016/0092-8674(92)90103-j. [DOI] [PubMed] [Google Scholar]
- 15.McCrea P D, Turk C W, Gumbiner B. Science. 1991;254:1359–1361. doi: 10.1126/science.1962194. [DOI] [PubMed] [Google Scholar]
- 16.Butz S, Stappert J, Weissig H, Kemler R. Science. 1992;257:1142–1144. doi: 10.1126/science.257.5073.1142-a. [DOI] [PubMed] [Google Scholar]
- 17.Franke W W, Goldsmith M D, Zimbelmann R, Mueller H M, Schiller D L, Cowin P. Biochemistry. 1989;86:4027–4031. doi: 10.1073/pnas.86.11.4027. [DOI] [PMC free article] [PubMed] [Google Scholar]
- 18.Nagafuchi A, Ishihara S, Tsukita S. J Cell Biol. 1994;127:235–245. doi: 10.1083/jcb.127.1.235. [DOI] [PMC free article] [PubMed] [Google Scholar]
- 19.Uchida N, Shimamura K, Miyatani S, Copeland N G, Gilbert D J, Jenkins N A, Takeichi M. Dev Biol. 1994;163:75–85. doi: 10.1006/dbio.1994.1124. [DOI] [PubMed] [Google Scholar]
- 20.Larue L, Ohsugi M, Hirchenhain J, Kemler R. Proc Natl Acad Sci USA. 1994;91:8263–8267. doi: 10.1073/pnas.91.17.8263. [DOI] [PMC free article] [PubMed] [Google Scholar]
- 21.Riethmacher D, Brinkmann V, Birchmeier C. Proc Natl Acad Sci USA. 1995;92:855–859. doi: 10.1073/pnas.92.3.855. [DOI] [PMC free article] [PubMed] [Google Scholar]
- 22.Gossler A, Joyner A L, Rossant J, Skarnes W C. Science. 1989;244:463–465. doi: 10.1126/science.2497519. [DOI] [PubMed] [Google Scholar]
- 23.Friedrich G, Soriano P. Genes Dev. 1991;5:1513–1523. doi: 10.1101/gad.5.9.1513. [DOI] [PubMed] [Google Scholar]
- 24.Skarnes W C, Auerbach B A, Joyner A L. Genes Dev. 1992;6:903–918. doi: 10.1101/gad.6.6.903. [DOI] [PubMed] [Google Scholar]
- 25.Skarnes W C, Moss J E, Hurtley S M, Beddington R S P. Proc Natl Acad Sci USA. 1995;92:6592–6596. doi: 10.1073/pnas.92.14.6592. [DOI] [PMC free article] [PubMed] [Google Scholar]
- 26.Nagy A, Rossant J. In: Gene Targeting: A Practical Approach. Joyner A, editor. Oxford, U.K.: IRL; 1993. pp. 147–179. [Google Scholar]
- 27.Torres M, Mansouri A. In: Cell Biology: A Laboratory Handbook. Celis J E, editor. New York: Academic; 1994. pp. 112–118. [Google Scholar]
- 28.Gossler A, Zachgo J. In: Gene Targeting: A Practical Approach. Joyner A, editor. Oxford, U.K.: IRL; 1993. pp. 147–179. [Google Scholar]
- 29.Herrenknecht K, Kemler R. J Cell Sci Suppl. 1993;17:147–54. doi: 10.1242/jcs.1993.supplement_17.21. [DOI] [PubMed] [Google Scholar]
- 30.Nagafuchi A, Tsukita S. Dev Growth Differ. 1994;36:59–71. doi: 10.1111/j.1440-169X.1994.00059.x. [DOI] [PubMed] [Google Scholar]
- 31.Vestweber D, Gossler K, Boller K, Kemler R. Dev Biol. 1987;124:451–456. doi: 10.1016/0012-1606(87)90498-2. [DOI] [PubMed] [Google Scholar]
- 32.Haegel H, Larue L, Oshugi M, Fedorov L, Herrenknecht L, Kemler R. Development (Cambridge, UK) 1995;121:3529–3537. doi: 10.1242/dev.121.11.3529. [DOI] [PubMed] [Google Scholar]
- 33.Hinck L, Näthke I S, Papkoff J, Nelson J. Trends Biochem Sci. 1994;19:538–542. doi: 10.1016/0968-0004(94)90057-4. [DOI] [PubMed] [Google Scholar]
- 34.McCrea P D, Brieher W M, Gumbiner B. J Cell Biol. 1993;123:477–484. doi: 10.1083/jcb.123.2.477. [DOI] [PMC free article] [PubMed] [Google Scholar]


