Abstract
Agarose multigel electrophoresis has been used to characterize the structural features of isolated genomic mouse mammary tumor virus (MMTV) promoters. The mouse 3134cells used for these studies contain ∼200 stably integrated tandem repeats of a 2.4-kb MMTV promoter fragment. Inactive, basally active, and hormonally activated genomic promoters were liberated by restriction digestion of isolated nuclei, recovered in low-salt nuclear extracts, and electrophoresed in multigels consisting of nine individual agarose running gels. Specific bands were detected and characterized by Southern and Western blotting. We find that transcriptionally inactive promoters contain TBP and high levels of histone H1, and are present to varying extents in both untreated and dexamethasone (DEX)-treated 3134cells. In contrast, the basally active promoter, present in untreated cells, is bound to RNA Pol II, TBP, and Oct1, contains acetylated H3 tail domains, and is depleted of histone H1. The DEX-activated promoter possessed similar composition as the basal promoter, but also contains stably bound Brg1. Strikingly, all forms of the MMTV promoter condense into higher-order secondary and/or tertiary chromatin structures in vitro in the presence of Mg2+. Thus, genomic MMTV promoter chromatin retains the ability to form classical higher-order structures under physiological salt conditions, even after dissociation of H1 and binding of several transcription factors and multiprotein complexes. These results suggest that transcriptionally active eukaryotic promoters may function in a locally folded chromatin environment in vivo.
Keywords: Chromatin, nucleosome, higher-order structure, transcription, promoter
Both the inactive and active states of RNA polymerase II-dependent genes are packaged into arrays of nucleosomes in vivo (for review, see Wolffe 1998; Wolffe 2001; Kornberg and Lorch 2002). Nucleosomal arrays bound to structural and functional chromosomal proteins constitute chromatin. The assembly of genes into chromatin is essential for biologically relevant transcriptional regulation in vivo (Archer et al. 1992; Smith and Hager 1997; Wolffe 2001). Transcriptionally inactive RNA polymerase II-dependent genes generally consist of regularly spaced arrays of nucleosomes containing stoichiometric amounts of linker histones (Richard-Foy and Hager 1987; Svaren and Chalkley 1990; Wolffe 2001; Kornberg and Lorch 2002). In contrast, in the active state(s), linker histone dissociation is favored and the nucleosomal arrays become punctuated by regions that contain altered nucleosomal structures and/or are completely devoid of histones (Svaren and Chalkley 1990; Bresnick et al. 1992; Adelman and Lis 2002; Kireeva et al. 2002). Transcription-associated changes in the nucleosomal array configuration often occur near DNA regulatory elements (Schild et al. 1993; Nye et al. 2002; Peterson 2002) and are usually mediated by chromatin-remodeling machines, for example, SWI/SNF, NURF (Fryer and Archer 1998; Narlikar et al. 2002; Peterson 2002).
To date, the nucleoprotein structure of eukaryotic genes has been characterized primarily by nuclease sensitivity and restriction enzyme accessibility assays and chemical probing techniques. These approaches can determine to base-pair resolution the two-dimensional distribution of chromatin-bound proteins over various genomic DNA regions (Wu et al. 1979a,b; Wu 1980; Fragoso et al. 1998; Gregory et al. 1998). It is important to note, however, that such studies delineate only the primary nucleoprotein structure of eukaryotic genes (Woodcock and Dimitrov 2001). That is, they define the location of nucleosomes and other proteins along a linear DNA sequence but do not yield information about the higher-order secondary and tertiary chromatin structures resulting from the hierarchical folding of nucleosomal arrays (Woodcock and Dimitrov 2001; Georgel 2002; Hansen 2002).
A major function of nucleosomal arrays is to facilitate both local and global folding of the genome (van Holde 1988; Wolffe 1998; Hansen 2002). To achieve chromosomal-level DNA compaction, a linear array of nucleosomes (i.e., primary chromatin structure) must condense into a series of higher-order secondary, tertiary, and quaternary chromatin structures (Woodcock and Dimitrov 2001). Not surprisingly, nucleosomal arrays are intrinsically conformationally dynamic in vitro. In low-salt conditions, nucleosomal arrays adopt an extended “beads-on-a-string” conformation (Wolffe 1998; Hansen 2002), which corresponds to the primary structure of nucleosomal arrays in solution. In the presence of inorganic and organic cations, nucleosomal arrays undergo both intramolecular folding and intermolecular self-association (Hayes and Hansen 2001; Hansen 2002). These processes collectively lead to formation of highly condensed structures in vitro that are thought to reflect analogous secondary and tertiary structures present in chromosomes in vivo (Fletcher and Hansen 1995; Schwarz et al. 1996; Hansen 2002).
Several in vitro studies have suggested that the assembly and stability of higher-order chromatin structures may be linked to regulation of genomic function (Hansen 2002; Horn and Peterson 2002, because it has not been possible to purify sufficient quantities of specific genomic chromatin fragments needed for conventional in vitro biophysical experiments, to date there have been no direct examinations of the higher-order chromatin structure of genomic promoters or other functional genomic elements that have been assembled into chromatin in vivo. The present studies bypass this long-standing technical barrier by using agarose multigels (Fletcher et al. 1994a,b) to analytically characterize the structure and salt-dependent folding of specific promoter fragments that were excised from the genome by restriction digestion, and subsequently isolated in unfractionated nuclear extracts.
The promoter analyzed in our experiments is contained within the mouse mammary tumor virus (MMTV) long terminal repeat. Both the primary chromatin structure of the MMTV promoter and its transcriptional regulation by steroid hormones have been characterized extensively (Richard-Foy and Hager 1987; Richard-Foy et al. 1987; Perlmann and Wrange 1988; Archer et al. 1991; Truss et al. 1995; Kramer et al. 1999; Fletcher et al. 2000; Hager 2001). When stably integrated into the genome, the MMTV promoter is assembled into an organized structure consisting of six positioned nucleosome families (Nuc A–F; Richard-Foy and Hager 1987; Fragoso et al. 1995). In this natural genomic context, the promoter has a measurable level of basal transcription (Cordingley et al. 1987; Richard-Foy and Hager 1987). Binding of steroid hormone receptor complexes to DNA sequence elements located in the nucleosome B and C region are required for full hormonal activation of the promoter (Fletcher et al. 2000; Hager 2001). Steroid hormone induction results in a subtle alteration of the primary chromatin structure in the Nuc B/C region, as detected by increased access of chemical or nuclease probes (Archer et al. 1991; Smith and Hager 1997). Alteration of the Nuc B/C families, which is mediated by ATP-dependent nucleosome-remodeling complexes in vitro (Ostlund-Farrants et al. 1997; Fletcher et al. 2000, 2002) and in vivo (Kramer et al. 1999; McNally et al. 2000; Muller et al. 2001), leads to binding of the transcription factor nuclear factor 1 (NF-1; Archer et al. 1991), and ultimately to transcription initiation (Smith and Hager 1997). Linker histones are depleted from the promoter upon transcriptional activation in vivo (Bresnick et al. 1992). This loss of H1 has been hypothesized to alter the higher-order chromatin structure of the promoter upon hormonal activation (Fragoso et al. 1998; Kramer et al. 1999; Hager 2001; Sheldon et al. 2001).
Here we have quantitatively analyzed structural features of genomic MMTV promoters isolated in low-salt nuclear extracts, including the ability of these promoters to fold into higher-order secondary and tertiary chromatin structures in vitro. Our studies have identified and characterized three distinct forms of the genomic MMTV promoter, which differ in their macromolecular composition and transcriptional activity in vivo. We find that all forms of the isolated genomic promoter, including the basally active and fully DEX-activated states, undergo classic salt-dependent chromatin condensation in vitro. Structural and functional ramifications of these results are discussed.
Results
Validation of the experimental approach
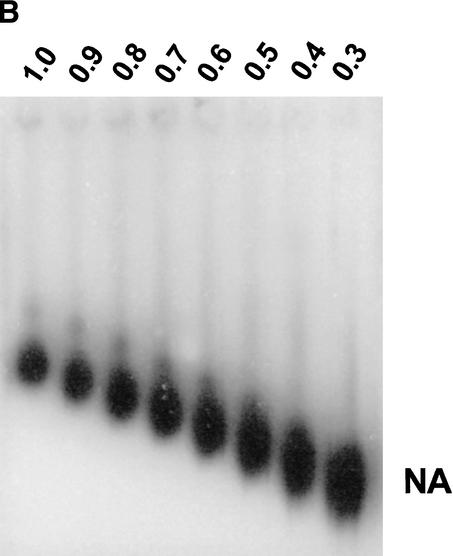
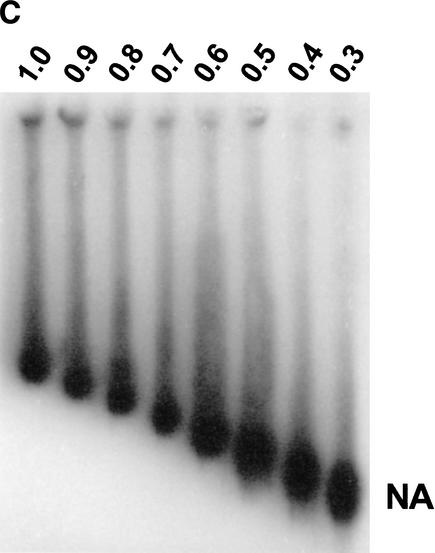
Multigels consist of nine individual agarose running gels (ranging from 0.2% to 3.0%) imbedded in a 1.5% agarose frame (Griess et al. 1989). The effective macromolecular radius, Re, and gel-free mobility, μ0, are obtained by experimentally measuring band mobilities and the pore size of each running gel (Griess et al. 1989; Hansen et al. 1997). These parameters collectively yield information about the surface charge density, conformational flexibility, and higher-order structure of nucleosomal arrays and linker histone-containing chromatin fibers (Fletcher et al. 1994a,b; Fletcher and Hansen 1995; Carruthers et al. 1998). In previous multigel studies of model nucleosomal arrays and chromatin fibers assembled in vitro from pure components, band mobilities were detected directly using a fluorescent stain, for example, ethidium bromide (Fletcher et al. 1994a,b; Fletcher and Hansen 1995; Carruthers et al. 1998). To use multigels for the characterization of structural features of specific genomic chromatin fragments recovered in an impure environment (see below), one must use an indirect method such as Southern blotting to measure fragment mobilities in each individual running gel. To determine whether Southern blotting is a valid detection method for these purposes, 12-mer nucleosomal arrays (Simpson et al. 1985; Hansen et al. 1989) and a bacteriophage T3 standard were electrophoresed in a 9-lane multigel. Band mobilities subsequently were determined using SYBR Green staining (Fig. 1A) or Southern blotting (Fig. 1B). A plot of mobility versus agarose concentration (Fig. 1D) yielded the Re and μ0 of the nucleosomal arrays (Fletcher et al. 1994a,b; Hansen et al. 1997). As shown in Table 1, the Re and μ0 obtained by fluorescent staining and Southern blotting were identical within experimental error. These experiments subsequently were repeated using the KpnI-derived MMTV promoter fragment studied below as genomic chromatin (see Fig. 2A), and the same results were obtained (Table 1). Thus, Southern blotting provides an accurate and reproducible method for determining the mobilities of specific chromatin bands in agarose multigels.
Figure 1.
Figure 1A. Multigel electrophoresis of nucleosomal arrays in unfractionated cell extracts. (A) Pure 12-mer nucleosomal arrays (NA) and bacteriophage T3 (T3) were electrophoresed in a 9-lane multigel as described in Materials and Methods, and the gel was stained with SYBR green. The agarose gel concentrations (percentage) are indicated above the lanes. The asterisk corresponds to free T3 DNA released from a portion of the bacteriophage during electrophoresis under low-salt conditions (Fletcher et al. 1994a). Only the mobilities of the intact T3 and NA bands were used for data analysis.
Figure 1B. Multigel electrophoresis of nucleosomal arrays in unfractionated cell extracts. (B) Same gel as in A except that the 12-mer NA bands were detected by Southern blotting as described in Materials and Methods.
Figure 1C. Multigel electrophoresis of nucleosomal arrays in unfractionated cell extracts. (C) Pure 12-mer NAs were mixed with a 3134 low-salt nuclear extract and 100-fold excess herring sperm DNA as described in Materials and Methods, and electrophoresed in a 9-lane multigel as in A. NA bands were detected by Southern blotting as in B.
Figure 1D. Multigel electrophoresis of nucleosomal arrays in unfractionated cell extracts. (D) Ferguson plot. For each of the gels shown in panels A–C, μ values were calculated as described in Materials and Methods and plotted against agarose percentage. The μ0 of each sample was obtained from the Y-axis intercepts.
Table 1.
Electrophoretic parameters of reconstituted nucleosomal arrays
| Arrays | Detection method | Re (nm)a | μ0 (× 10-4 cm2/V · sec)b |
|---|---|---|---|
| 5S | SYBR greenc | 28.1 ± 0.5 | -2.02 ± 0.03 |
| 5S | Southern blotc | 27.6 ± 0.5 | -1.99 ± 0.04 |
| 5Se | Southern blotNEd | 27.7 ± 0.5 | -2.02 ± 0.03 |
| MMTVf | SYBR greenc | 26.0 ± 1.5 | -2.06 ± 0.01 |
| MMTV | Southern blotc | 26.5 ± 0.8 | -2.07 ± 0.01 |
| MMTV | Southern blotNEd | 25.6 ± 0.1 | -2.07 ± 0.05 |
Mean ± standard deviation of 4 determinations.
Mean ± standard deviation of 4 determinations.
Model nucleosomal arrays were electrophoresed and detected as indicated.
Model nucleosomal arrays were mixed with a 3134-cell low-salt nuclear extract prior to electrophoresis and were detected by hybridization.
Nucleosomes were assembled onto the 208-12 DNA template by salt dialysis.
Nucleosomes were assembled onto the KpnI-derived MMTV promoter (Fig. 2A) fragment by salt dialysis.
For the characterization of genomic promoters by multigel analysis, one must accurately determine the electrophoretic mobility of chromatin fragments released into an unfractionated low-salt nuclear extract (see below). Consequently, it also was necessary to perform controls to determine if the intrinsic mobilities of chromatin fragments are altered in the presence of impure low-salt nuclear extracts. To address this question, reconstituted 5S nucleosomal arrays were mixed with a 3134 mammary cell low-salt nuclear extract (see Materials and Methods) prior to electrophoresis. Under these conditions, the nucleosomal array band became super-shifted and indistinct. Similar results were obtained in yeast nuclear extracts and Drosophila embryo extracts (Georgel and Hansen 2003). To test if band smearing was caused by nonspecific interactions with DNA binding proteins, the mobilities of model 5S nucleosomal arrays were determined in the presence of low-salt nuclear extracts containing increasing amounts of exogenous herring sperm DNA. In all extracts studied, a single 5S nucleosomal array band was detected after addition of ≥100-fold excess herring sperm DNA (Georgel and Hansen 2003). Multigel experiments subsequently were performed under these conditions (Fig. 1C). The data in Table 1 indicate that the Re and μ0 of 5S nucleosomal arrays determined in the presence of nuclear extract and competitor DNA were the same as those of pure 5S nucleosomal arrays. Identical results were obtained with nucleosomal arrays assembled from the KpnI-derived MMTV promoter fragment (Table 1). Taken together, the results shown in Figure 1A,1B,1C,1D and Table 1 define the conditions under which multigels can be used to accurately characterize the higher-order structural features of specific multicopy chromatin bands isolated in a low-salt nuclear extract. It should be noted that recent analogous experiments using fluorescently labeled DNA probes have extended the band detection limit into the femtogram range (P.T. Georgel, unpubl.), which should be sufficient to study single-copy genes using the approach described below.
Multigel analysis of genomic MMTV promoters before and after hormonal induction of transcription
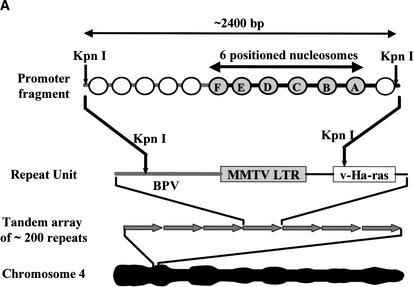
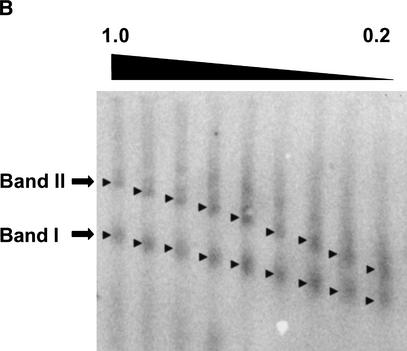
As discussed above, the MMTV promoter is an ideal system for analysis by the multigel approach. The 3134 cell line contains 200 tandem copies of the MMTV promoter fused to the Ha-v-ras gene and integrated into Chromosome 4 (Fig. 2A; McNally et al. 2000). Bona fide mRNA transcripts are synthesized in vivo from the repeated MMTV promoter/Ha-v-ras gene fusions by RNA polymerase II. In the present studies, we characterized an ∼2400-bp genomic fragment consisting of the canonical MMTV promoter encompassed by positioned nucleosomes A–F (Fig. 2A; Richard-Foy and Hager 1987; Fragoso et al. 1995) together with ∼1 kb of DNA upstream from nucleosome F, and 160 bp downstream from the transcription start site. This fragment was obtained by digestion of isolated 3134 cell nuclei with KpnI (Fig. 2A), followed by pelleting of the digested nuclei in low-salt buffer. Roughly 30% of the total genomic promoter fragments are recovered in the supernatant under these conditions (P.T. Georgel, unpubl.). This supernatant is referred to as a low-salt nuclear extract. Figure 2B shows representative data obtained when a KpnI-treated 3134 low-salt nuclear extract was electrophoresed in a multigel, followed by Southern blotting of the multigel using a probe specific for the MMTV promoter fragment. Note that nucleosomal arrays exist in unfolded primary chromatin structure under the low-salt conditions of these experiments. In the absence of dexamethasone (DEX), two discrete bands (termed I and II) were detected (Fig. 2B, arrows). Analysis of their electrophoretic mobilities indicated that band I had an Re of 25.7 ± 0.9 nm and a μ0 of –1.68 ± 0.01 × 10⁻⁴ cm2/V · sec (Table 2). Of note, the Re and μ0 values of band I are very similar to those of model 12-mer chromatin model systems containing one bound H5 linker histone per nucleosome (Table 2; Carruthers et al. 1998). Band II had a significantly larger Re (43.3 ± 1.0 nm) and a more positive μ0 (–1.52 ± 0.1 × 10⁻⁴ cm2/V · sec) than band I. The molecular basis for the difference in mobilities of bands I and II is explored and described in detail below.
Figure 5.
Figure 2A. Characterization of genomic MMTV promoters. (A) Schematic illustration of MMTV promoter configuration in the 3134 cell genome. Cell line 3134 contains ∼200 copies of an MMTV-LTR-ras-BPV promoter construct stably integrated into Chromosome 4 in a perfect head-to-tail array. The 2400-bp MMTV promoter fragment characterized in these experiments was generated by KpnI digestion of isolated 3134 nuclei as described in Materials and Methods.
Figure 2B. Characterization of genomic MMTV promoters. (B) Multigel electrophoresis of a KpnI-digested low-salt nuclear extract prepared from untreated cells. The individual running gels ranged from 0.2% to 1% agarose and were poured in increments of 0.1%. After electrophoresis, specific MMTV promoter bands were detected by Southern blotting as described in Materials and Methods. Arrowheads indicate the center position of the promoter bands referred to as I and II in the text.
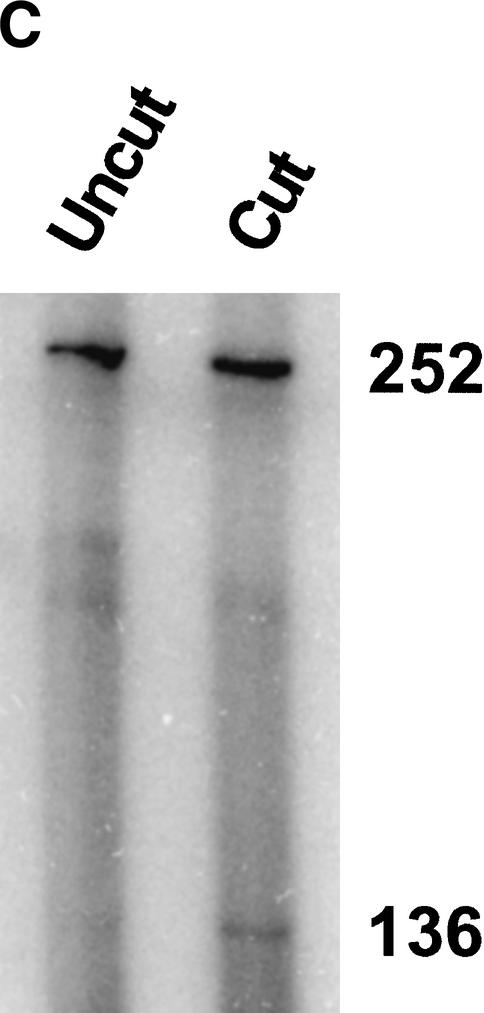
Figure 2C. Characterization of genomic MMTV promoters. (C) DEX-induced SacI cleavage of genomic MMTV chromatin. The 3134 cell nuclei isolated before (left lane, Uncut) and after exposure of cells to DEX for 1 h (right lane, Cut) were exposed to SacI as described in Materials and Methods. The 252-bp fragment represents the uncut promoter region. The 136-bp fragment is derived from the 252-bp fragment as a result of SacI restriction.
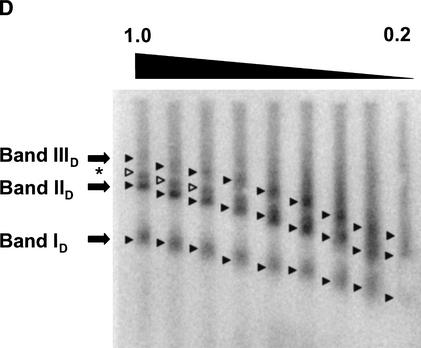
Figure 2D. Characterization of genomic MMTV promoters. (D) Multigel electrophoresis of a KpnI-digested low-salt nuclear extract prepared from DEX-treated cells. The 3134 cells were exposed to DEX for 1 h prior to preparation of the nuclear extract. The individual running gels ranged from 0.2% to 1% agarose and were poured in increments of 0.1%. After electrophoresis, specific MMTV promoter bands were detected by Southern blotting as described in Materials and Methods. Closed arrowheads indicate the center position of the promoter bands referred to as ID, IID, and IIID in the text. The asterisk and open arrowheads indicate the position of a fourth band that was not reproducibly present in the extracts.
Table 2.
Electrophoretic parameters of genomic MMTV promoters in low salt
| Re (nm)a | μ0 (× 10-4 cm2/V · sec)b | |
|---|---|---|
| Band I | 25.7 ± 0.9 | -1.68 ± 0.01 |
| Band ID | 25.7 ± 1.0 | -1.68 ± 0.01 |
| Band II | 43.3 ± 1.0 | -1.52 ± 0.01 |
| Band IID | 43.3 ± 1.3 | -1.52 ± 0.01 |
| Band IIID | 60.8 ± 0.5 | -1.52 ± 0.01 |
| NAC | 28.1 ± 1.1 | -1.82 ± 0.04 |
| NA + H5c | 23.1 ± 1.3 | -1.55 ± 0.01 |
Mean ± standard deviation of 4 determinations.
Mean ± standard deviation of 4 determinations.
Taken from Carruthers et al. 1998.
To stimulate transcription from MMTV promoters, 3134 cells were exposed to 100 nM DEX for 1 h. As a control to confirm promoter activation, an aliquot of the isolated nuclei was digested with SacI to probe the accessibility of MMTV promoter Nuc B (Fragoso et al. 1998). Consistent with previous results obtained in this cell line (Fragoso et al. 1998), an approximately threefold increase in SacI accessibility was observed in the presence of DEX (Fig. 2C). Multigel analyses of nuclear extracts from DEX-treated cells always detected three distinct bands, termed ID, IID, and IIID (Fig. 2D). In some cases, we also observed a minor fourth band (Fig. 2A,2B,2C,2D, asterisk). Bands ID and IID had virtually identical Re and μ0 values to those of bands I and II, respectively (Table 2). However, band IID predominated over ID in the presence of DEX. Band IIID had a much larger Re (60.8 ± 0.5 nm) than bands ID and IID. Because the fourth band was seen in only ∼50% of the experiments, and its signal intensity was always low and variable in those gels where it was detected, the electrophoretic parameters corresponding to this band could not reproducibly be determined. In summary, the data in Figure 2A,2B,2C,2D and Table 2 demonstrate that multigels can be used to characterize genomic promoter fragments present in minute amounts in low-salt nuclear extracts. Two structurally distinct promoter fragments were detected in the absence of DEX, whereas three forms of promoter chromatin were present after exposure of cells to DEX. We next analyzed the effect of DEX on the nucleoprotein composition and kinetics of appearance of each MMTV promoter band.
Macromolecular composition and abundance of genomic MMTV promoters
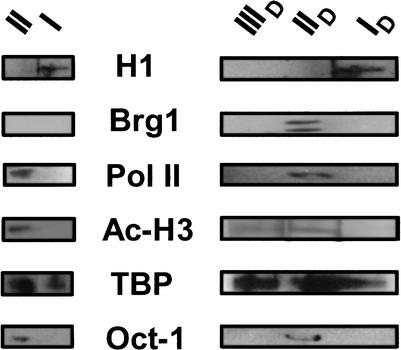
Western blots probing known components of the inactive, basally active, and hormonally activated states of the MMTV promoter were used to help define the macromolecular composition of the five different promoter fragments identified in Figure 2A,2B,2C,2D (bands I, II, ID, IID, and IIID). Specifically, we tested for the presence of histone H1, acetylated histone H3, TBP, Oct 1, RNA polymerase II, and the Brg1 chromatin-remodeling complex. Figure 3 shows that histone H1 was bound to promoter band I. Although precise stoichiometries cannot be directly measured in our experiments, the detection of H1 by Western analysis, together with the μ0 and Re values obtained from agarose multigels (Table 2), suggest that the chromatin of band I contains nearly one H1 per nucleosome. We also reproducibly observed that TBP was a component of band I chromatin. Band II lacked histone H1, but contained TBP, acetylated histone H3, Oct-1, and RNA polymerase II. None of the promoter bands were found to be associated with the glucocorticoid receptor or acetylated H4 (data not shown). The conclusion that there are several transcription factors and macromolecular assemblages stably bound to the chromatin fragments comprising band II is supported by the much larger effective radius of band II (43 nm) relative to band I (26 nm).
Figure 3.
Protein composition of genomic MMTV promoters. Promoter bands I and II (left panels), and ID, IID, and IIID (right panels) were probed by Western analysis as described in Materials and Methods, using antibodies against the proteins indicated in the center of the figure. A doublet sometimes is observed with the anti-Brg1 antibody used for the hybridizations (P.T. Georgel, unpubl.).
As with band I, the chromatin of band ID contained H1 and TBP but none of the other markers tested (Fig. 3). This is consistent with the observation that bands I and ID also had identical Re and μ0 values (Table 2). Bands IID and II both contained TBP, acetylated histone H3, Oct-1, and RNA polymerase II; however, band IID also was associated with Brg1 (Fig. 3). In this regard, hormonal activation of genomic MMTV promoters is thought to involve Brg1-dependent remodeling of Nuc B, leading to increased SacI accessibility (Fryer and Archer 1998). Analysis of band IIID yielded enigmatic results. Despite having a much larger size (Re 61 nm) than bands ID and IID, the only macromolecular markers detected were TBP and acetylated H3 (Fig. 3).
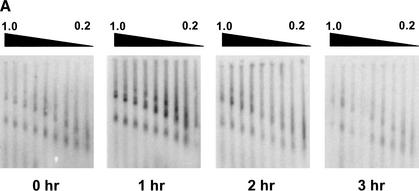
To further assess the functional status of promoter bands ID, IID, and IIID in their in vivo genomic context, we determined the abundance of these bands as a function of length of exposure of 3134 cells to DEX (Fig 4A,4B). The kinetics of DEX activation of genomic MMTV promoters previously have been well characterized in several cell lines using transcription run-on assays (Sheldon et al. 2001; Becker et al. 2002). Interestingly, we first observed that the total number of genomic MMTV promoters that could be released by KpnI digestion increased rapidly and significantly in response to DEX treatment (Fig. 4B). This result implies that an initial GR-mediated function in 3134 cells is to “unmask” a significant population of inaccessible MMTV promoters prior to promoter activation. The level of band ID remained approximately constant over a 3-h exposure to DEX (Fig. 4B). In contrast, the levels of band IID peaked after 1 h, and then gradually returned to baseline after 3 h of exposure to DEX. The latter results closely parallel the time course of DEX-dependent activation of the MMTV promoter observed in other studies (Becker et al. 2002). The abundance of band IIID also peaked after 1 h, but was significantly reduced after 2 h of DEX treatment (Fig. 4B).
Figure 10.
Figure 4A. Time course of dexamethasone effects on the abundance of genomic MMTV promoters released into low-salt nuclear extracts by KpnI. (A) Multigels. 3134 cells were exposed to 100 nM DEX for the indicated times. Equal amounts of KpnI-digested nucleic acid were loaded in each running gel according to Materials and Methods.
Figure 4B. Time course of dexamethasone effects on the abundance of genomic MMTV promoters released into low-salt nuclear extracts by KpnI. (B) Quantitation of MMTV promoters released by KpnI. For each band (ID, IID, and IIID), the amount of signal in the 0.7%, 0.8%, 0.9%, and 1.0% running gels of the multigels shown in A was quantified from the PhosphorImager-generated images and averaged to obtain the mean value ± standard deviation. The figure shows (from left to right): the summed total promoter signal in absorbance units (AU), and the specific signal obtained for bands ID, IID, and IIID, as a function of DEX exposure.
The data in Figures. 2A,2B,2C,2D,3,4A,4B together lead to the following conclusions. Bands I and ID are derived from the transcriptionally inactive form of the genomic MMTV promoter present in 3134 cells. The inactive promoter chromatin appears to contain high levels of H1 throughout the isolated fragment, and surprisingly, TBP. Band II is derived from the uninduced, basally active form of the genomic MMTV promoter and as isolated contains TBP, acetylated histone H3, Oct-1, and RNA polymerase II. Band IID is derived from the hormonally activated form of the genomic MMTV promoter and as isolated contains the same components as the basally active promoter as well as Brg1. The failure to detect stably bound GR on band IID is consistent with previous studies showing that GR is in rapid exchange with MMTV promoter chromatin in vivo (McNally et al. 2000). Although no firm conclusions can be made about band IIID, we speculate that it may be an intermediate in the formation of band IID based on its composition and kinetics of DEX induction. We next used agarose multigel electrophoresis to analyze structural features of the genomic MMTV promoter fragments present in low-salt nuclear extracts.
Conformational flexibility and in vitro formation of higher-order secondary and tertiary chromatin structures
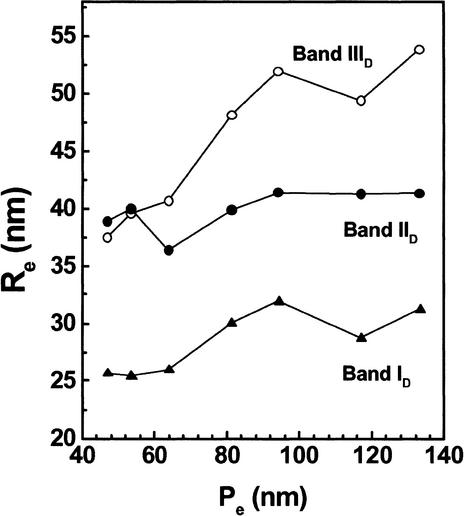
A relative measure of the conformational flexibility of a macromolecule is obtained from plots of Re versus the gel pore size, Pe (Serwer et al. 1983; Griess et al. 1989; Hansen et al. 1997). The Re of a flexible macromolecule decreases as the Re approaches Pe (i.e., in more concentrated running gels), whereas less flexible macromolecules tend to have a constant Re as a function of Pe. For example, model studies have shown that uninterrupted, regularly spaced nucleosomal arrays are inflexible in low-salt buffers, whereas even a single nucleosome-free gap in a 12-mer nucleosomal array causes the array to become flexible (Fletcher et al. 1994a). The data in Figure 5 indicate that the Re of bands ID and IID are independent of Pe, and therefore inflexible under the conditions studied. These data support previous conclusions that hormonal activation does not lead to complete dissociation of nucleosomes from genomic MMTV promoters in vivo (Richard-Foy and Hager 1987; Fragoso et al. 1998). In contrast, the Re of band IIID decreased significantly at lower Pe, indicating that this band is more flexible. This suggests that the chromatin of band IIID may be less uniformly spaced, and is consistent with the other evidence that the respective chromatin structures of bands IID and IIID differ significantly.
Figure 5.
Conformational deformability of genomic MMTV promoters. For each promoter band, effective radii (Re) are plotted as a function of gel pore size (Pe) to obtain a measure of promoter flexibility (see text for details; Fletcher et al. 1994; Hansen et al. 1997). ▴, band ID; •, band IID; ○, band IIID.
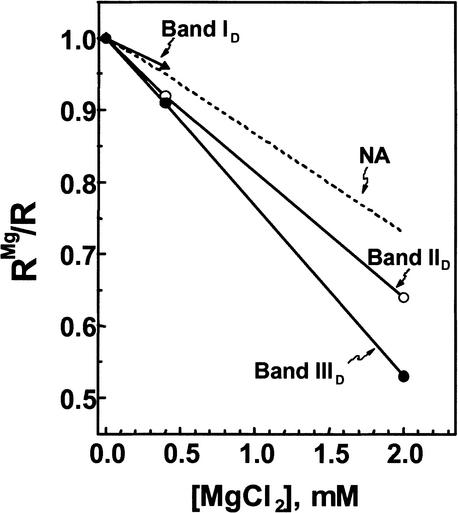
To determine the ability of MMTV promoters to form secondary and tertiary chromatin structures in vitro, we used a classical experimental design used for over two decades to study higher-order folding of endogenous bulk chromatin fragments (Thoma et al. 1979; Butler and Thomas 1980) and in vitro assembled model systems (Hansen 2002). Samples were initially characterized under low-salt conditions, where chromatin adopts an unfolded beads-on-a-string structure. The samples were then studied in Mg2+-containing buffers to determine the extent to which salt-dependent array compaction had occurred. In our experiments, the assay for chromatin folding was the salt-dependent change in Re measured by multigel agarose gel electrophoresis (RMg/R). Previous multigel studies of model 12-mer nucleosomal arrays have shown that a decrease in RMg/R is indicative of formation of condensed secondary chromatin structure (Fletcher et al. 1994b; Hansen et al. 1997).
The Re of each MMTV promoter band was measured in buffer containing 0–2 mM free Mg2+. Interestingly, the Re of bands IID and IIID both decreased linearly over this salt range (Fig. 6), as did model 12-mer nucleosomal arrays assembled in vitro from pure components (Fig. 6, dashed line; Fletcher et al. 1994b). In 2.0 mM Mg2, the decrease in RMg/R of bands IID and IIID was substantial (36% and 48%, respectively) and, if anything, was larger than that seen previously for model 12-mer nucleosomal arrays (Fig. 6). These results demonstrate that genomic chromatin fragments derived from transcriptionally active MMTV promoters remain capable of forming Mg2+-dependent secondary chromatin structures in vitro, even though the chromatin contains acetylated H3, and is bound to transcription factors and transcription-related complexes. The salt-dependent behavior of band ID was fundamentally different from that seen for bands IID and IIID. The RMg/R of this species decreased somewhat in 0.4 mM Mg2+ (Fig. 6). However, in 2 mM MgCl2, band ID formed large oligomers that could not migrate through any of the running gels (data not shown). In this respect, the salt-dependent behavior of band ID closely paralleled that of model nucleosomal arrays containing one bound linker histone per nucleosome (Carruthers et al. 1998).
Figure 6.
Genomic MMTV promoters form compact secondary chromatin structures in the presence of Mg2+. The Re for each MMTV promoter band was determined at the indicated salt concentrations. For each salt concentration, data are expressed as the Re in salt normalized to the Re in running buffer alone (ReMg/Re). A decrease in this ratio is indicative of secondary chromatin structure formation (Fletcher et al. 1994b; Carruthers et al. 1998)
Discussion
The hierarchical folding of the chromatin fiber has been the subject of intense interest for many years (Thoma et al. 1979; McGhee et al. 1983; van Holde 1988; Wolffe 1998; Hansen 2002). Although detailed structures of extensively folded chromatin fibers have remained unresolved, much progress has been made in understanding the molecular mechanisms and macromolecular determinants that underlie chromatin folding in solution (Hansen 2002). Nucleosomal arrays are intrinsically capable of forming extensively condensed structures because of the actions of the core histone tail domains (Garcia-Ramirez et al. 1992; Fletcher and Hansen 1995; Tse and Hansen 1997). Linker histones, on the other hand, stabilize folded chromatin structures (Hansen 2002).
The intrinsic properties of nucleosomal arrays can be modulated in vitro by certain core histone variants, for example, H2A.Z (Fan et al. 2002); posttranslational modifications, for example, bulk core histone acetylation (Garcia-Ramirez et al. 1992; Tse et al. 1998); and functionally relevant core histone mutations, for example, yeast SIN mutations (Horn et al. 2002a). Inhibition of SWI/SNF and other chromatin-remodeling machines by linker histones is caused in part by H1-dependent stabilization of folded chromatin (Horn et al. 2002b). Classical higher-order chromatin structures repress elongation through nucleosomal arrays by RNA polymerase III in vitro (Hansen and Wolffe 1992). Destabilization of higher-order structures by global histone acetylation (Tse et al. 1998) or depletion of H2A/H2B dimers (Hansen and Wolffe 1994; Kireeva et al. 2002) dramatically enhances the efficiency of RNA polymerase elongation through nucleosomal arrays. These and related studies comprise a body of in vitro evidence suggesting that higher-order chromatin structures may be involved in the control of many genomic functions (for review, see Annunziato and Hansen 2000; Hansen 2002; Horn and Peterson 2002). However, technical limitations have prevented direct examinations of the conformational dynamics of specific genomic regions that have been assembled into chromatin in vivo.
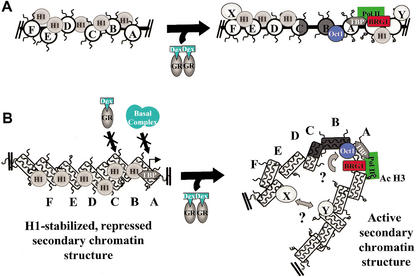
To overcome these problems, we used agarose multigel electrophoresis to obtain analytical measurements of the size, shape, surface charge density, and flexibility of genomic MMTV promoter fragments that were released as intact chromatin from the mouse 3134 cell genome by restriction digestion and isolated in a low-salt nuclear extract. This experimental approach has allowed a direct test of whether the principles of chromatin fiber dynamics established in vitro using bulk endogenous chromatin fragments and defined model systems also apply to the chromatin encompassing authentic genomic promoter elements. Our results indicate that chromatin fragments derived from the transcriptionally repressed genomic MMTV promoter contain H1, and exhibit the same in vitro salt-dependent condensation behavior as chromatin model systems containing one linker histone H5 per nucleosome. Surprisingly, even though the chromatin fragments derived from the basally active and hormonally induced genomic MMTV promoters have completely lost H1 and consist of nucleosomal arrays stably bound to various transcription factors (e.g., Oct-1) and multienzyme complexes (e.g., RNA polymerase II, Brg 1), these genomic promoter fragments nevertheless retain the ability to form salt-dependent secondary chromatin structure in essentially the same manner as model nucleosomal arrays (Fig. 6). Previous studies have shown that the secondary chromatin structures formed by nucleosomal arrays in the absence of linker histones are less stable and more irregular than when H1 is bound to the arrays (Thoma et al. 1979; Bednar et al. 1998; Carruthers et al. 1998). Hence, our analyses of isolated genomic MMTV promoters suggest that conversion from the inactive to active states of the MMTV promoter involves global reorganization and destabilization of secondary and tertiary chromatin structures, accompanied by loss of H1 (Fig. 7B). However, there is no evidence that transcriptionally active MMTV promoters are completely unfolded into an extended array of nucleosomes under physiological ionic conditions.
Figure 7.
Revised model for eukaryotic promoter activation. (A) Present model of transcriptional activation. Inactive and active promoters are depicted in their primary chromatin structure. (B) Proposed model of transcriptional activation. Inactive and active promoters are depicted in folded secondary chromatin structures. “X” and “Y” refer to hypothetical protein–protein interactions involving the upstream regulatory element and the proximal promoter.
Our studies have identified a new form of the MMTV promoter (band IIID) that we speculate is an intermediate in the establishment of the canonical DEX-activated promoter (band IID). Whereas the abundances of bands IID and of band IIID both peaked after 1 h of DEX treatment, band IIID returned to baseline levels more rapidly than IID (Fig. 4A,4B). Band IIID contained acetylated H3 and no H1, although none of the other components associated with band IID were detected by Western analysis. The significantly larger Re in low salt (Table 2) is consistent with the presence of additional macromolecular constituents bound to band IIID that are not bound to band IID. Finally, band IIID was more flexible than IID (Fig. 5), suggestive of a reconfigured primary chromatin structure. Taken together, these observations support the hypothesis that DEX-induced conversion of the inactive promoter (band I/ID) to the hormonally activated promoter (band IID) proceeds through band IIID.
It is standard for present paradigms of eukaryotic promoter function to depict the surrounding transcriptionally active chromatin as an unfolded array of nucleosomes (Fig. 7A; for reviews, see Wolffe 1998; Georgel 2002). Furthermore, in most models the primary function of the chromatin fiber is simply to serve as a platform for posttranslational histone modifications and recruitment of protein factors and accessory complexes (Fig. 7A; Lo et al. 2000; Berger 2002). As with other promoters, previous characterization of MMTV promoter chromatin has focused on a localized hormone-induced transition in the region of specific nucleosomes (Richard-Foy and Hager 1987; Fragoso et al. 1995; Fletcher et al. 2000). However, our observation that all forms of isolated genomic MMTV promoters form salt-dependent secondary chromatin structure in vitro suggests that hormone-induced transitions in MMTV promoter chromatin also may take place on a much larger scale in vivo. This finding is particularly intriguing in light of the studies of McNally et al. (Muller et al. 2001), who used a glucocorticoid receptor tagged with the green fluorescent protein (GFP-GR) and fluorescence microscopy techniques to directly visualize the same tandem MMTV promoter array in living 3134 cells. These investigators observed a large-scale decondensation in the surrounding chromosomal milieu upon hormone treatment. However, even under conditions of full hormone induction, in which the promoter array is in its most decondensed chromosomal state, the packing ratio for DNA within the array is much greater than that of an unfolded chromatin fiber. Thus, the fluorescence analysis of tandem promoter arrays in living cells strongly support the conclusion from the present studies that transcriptionally active eukaryotic promoters are designed to function in a highly condensed chromatin environment in vivo.
Although TBP generally is thought of as being a component of eukaryotic preinitiation complexes, we consistently found that genomic chromatin derived from transcriptionally inactive MMTV promoters (i.e., bands I and ID) contained bound TBP in addition to histone H1 (Fig. 3). Moreover, we observed that bound TBP did not interfere with formation of Mg2+-dependent secondary and tertiary chromatin structure in vitro (Fig. 6). Both TBP (Chen et al. al 2002) and TFIID (Christova and Oelgeschlager 2002) have recently been shown to be tightly associated with the highly condensed chromatin found in metaphase chromosomes. Thus, we speculate that TBP is able to bind to transcriptionally repressed, H1-stabilized higher-order chromatin structures, perhaps to “preset” or “mark” promoters for activation prior to the structural reorganization of promoter chromatin associated with transcription initiation.
Materials and methods
Materials
Low electro endo-osmosis (LE) agarose was obtained from Research Organics. Concentrated KpnI enzyme (1,000,000 units/mL) was purchased from New England Biolabs. Whole chicken blood was purchased from Pel Freeze. Histone octamers were isolated from chicken erythrocytes as described (Hansen et al. 1989). The 208-12 DNA template, which consists of 12 tandem 208-bp repeats of Lytechinus variegatus 5S rDNA (Simpson et al. 1985), was obtained from the plasmid pPol I 208-12 (Georgel et al. 1993) as described (Schwarz et al. 1996). Bacteriophage T3 (Re = 30.1 nm) was purified according to the method of Serwer et al. (1983). Preparations of 208-12 nucleosomal arrays containing 11–12 nucleosomes per 5S rDNA template were reconstituted from purified histone and DNA components using the salt dialysis protocol described by Hansen and Lohr (1993).
Preparation of low-salt nuclear extracts containing genomic MMTV promoters
The 3134 cells were grown in DMEM containing either 10% FBS or charcoal stripped 10% FBS for 14–16 h. In some cases, cells were subsequently treated with 100 nM dexamethasone (DEX) for 1–3 h as indicated. To prepare intact nuclei, cells were harvested by light trypsin digestion, washed with cold phosphate-buffered saline, and centrifuged for 3–5 min at 1000g. The cell pellet was resuspended in 10 mM HEPES (pH 7.8), 0.3 M sucrose, 2 mM magnesium acetate, 3 mM CaCl2, 1% Triton X-100, 0.5 mM dithiothreitol (DTT), 0.5 mM phenylmethylsulfonyl fluoride, and cells were lysed with a Dounce homogenizer and a pestle. Homogenates were diluted 1:1 with 10 mM HEPES (pH 7.8), 25% glycerol, 5 mM magnesium acetate, 0.1 mM EDTA, and 5 mM DTT (PB), and centrifuged through 10–20 mL of PB cushion at 1000g for 15 min in a tabletop centrifuge. The pelleted nuclei were resuspended in PB containing 0.5 mM DTT (200 μL of buffer per 225-mm culture dish cell). The concentration of nuclei ranged from 3 to 8 mg/mL total nucleic acid as determined from the ratio of absorbances at 260 and 280 nm. Genomic MMTV promoters were excised by digestion of isolated nuclei with the restriction enzyme KpnI (see Fig. 2A). Intact nuclei (100–600 μg of total nucleic acid) were resuspended in 150 μL of nuclear digestion buffer (NDB) containing 50 mM Tris-HCl (pH 8.0), 50 mM NaCl, 0.5 mM MgCl2, and 1 mM β-mercaptoethanol. The nuclei were pelleted at 1000g for 1 minute in a microfuge, and the supernatants were discarded. Washed nuclei were resuspended in 70 μL of NDB and digested with 1500 units of KpnI per 100 μg of nucleic acid at 37°C for 45 min. After KpnI digestion, nuclei were pelleted at 1500g in a microfuge at room temperature for 5 min. These supernatants contain the excised MMTV promoters and are referred to as low-salt nuclear extracts. All low-salt nuclear extracts were used immediately after preparation.
Agarose multigel electrophoresis
Electrophoretic mobilities, μ, were measured in a multigel composed of 9 individual agarose running gels ranging in concentration from 0.2% to 3.0% (Fletcher et al. 1994a). Each of the running gels was cast within a 1.5% agarose frame. The casting and running buffer was 40 mM Tris-HCl, (pH 7.8), and 0.25 mM Na2EDTA (E). Where indicated, E buffer also contained MgCl2 at concentrations equal to 0.4 or 2.0 mM free Mg2+. Prior to electrophoresis, low-salt nuclear extracts (100 μg of total nucleic acid) were transferred to fresh tubes containing 20 μg of herring sperm DNA, 0.5 μg of bacteriophage T3, and glycerol (10% final). Samples were loaded and electrophoresed at 1.33 V/cm for 6 h. The temperature was 24°C ± 3°C. Running buffer was continuously recirculated throughout the entire experiment to prevent the formation of pH or ion gradients. The gels were stained with SYBR green and (or) Southern-blotted and photographed, and the gel image was digitized. For each individual band, the migration was measured from the center of the well to the center of the band using NIH Image software (O'Neill et al. 1989) and subsequently converted to μ. The gel-free mobility, μ0, was obtained by extrapolating the linear region of a plot of log μ versus agarose percentage to the Y-axis (i.e., 0% agarose). The linear region fell in the range of 0.2%–0.9% agarose, and the correlation coefficients of the linear regressions were ≥0.99. The μ for a macromolecule in a given running gel is described by the relationship
 |
(1) |
where Re is the effective macromolecular radius in nanometers and Pe is the effective pore size in nanometers of the running gel (Griess et al. 1989; Fletcher et al. 1994a). Using the equation above, the Pe of each running gel was determined from the measured μ and μ0 and known Re (30.1 nm) of the bacteriophage T3 internal standard. The Re of chromatin bands in a given running gel was determined from their measured μ and μ0 and the calculated Pe for that gel.
Southern blotting and hybridization
In those cases in which genomic chromatin bands were detected by Southern blotting, after electrophoresis the multigels were soaked in denaturing solution (1.5 M NaCl, 0.5 M NaOH) for 1 h followed by a 1-h wash in renaturation solution (1.5 M NaCl, 1 M Tris-HCl at pH 7.4). The gels were then rinsed with 20× SSC (3 M NaCl, 300 mM tri-sodium citrate at pH 7.0) for 10–15 min and transferred to Hybond N membranes overnight using the Turboblotter system (Scleicher and Schuell) according to the manufacturer's protocol. After rinsing with 6× SSC, the membranes were cross-linked using the Stratagene Stratalinker. A probe covering the MMTV promoter (2.4-kb KpnI/KpnI fragment) was random primed or nick translated. Unincorporated [γ-32P]dCTP was removed by gel filtration (Biospin P30, Bio-Rad). The probe was phenol-chloroform-extracted and boiled prior to addition to the prehybridization solution. After 12 h of hybridization, the membranes were washed twice with 2× SSC, 0.1% SDS at 42°C and 30°C, respectively, and once with 0.2× SSC, 1% SDS at 27°C. The Hybond membranes were exposed to PhosphorImager screens for 2–5 d.
Determination of MMTV promoter composition
A low-salt nuclear extract containing KpnI-digested chromatin fragments was prepared as described above, and electrophoresed through a 1% agarose gel (10 cm in length) at 5 V/cm for 2.5 h. The gel was buffered with TAE (40 mM Tris-acetate at pH 8.3, 1 mM Na2EDTA). The outside lanes of the gel contained 1 kb+ DNA size markers (GIBCO-BRL). The portion of the gel containing the DNA marker was stained with SYBR green, while the rest of the gel was stained with Coomassie blue. The distance of migration of the different genomic MMTV promoter bands under these conditions was determined from Southern blotting and hybridization of a parallel lane within the same gel. This information was then used to excise gel slices containing each promoter band from the Coomassie-stained gels. The excised gel slices were soaked in a solution containing 1% sodium dodecyl sulfate (SDS), 50 mM Tris-HCl (pH 6.8), 1% β-mercaptoethanol at room temperature for 15 min, and then transferred to a tube of the same buffer heated to 95°C–100°C. The gel slices were kept at the same temperature for 25–35 sec (i.e., until the agarose started to become transparent), and then chilled on ice. The agarose slice was placed in the well of a 4%–20% SDS gel and electrophoresed at 100 V for 90 min. The proteins were then transferred to Immobilon P PVDF membranes and immunoblotted according to standard Western blotting conditions using the indicated antibodies.
Acknowledgments
This work was supported by grants from the National Institutes of Health. We thank Randy Morse for suggesting the use of agarose multigels to study genomic chromatin fragments.
The publication costs of this article were defrayed in part by payment of page charges. This article must therefore be hereby marked “advertisement” in accordance with 18 USC section 1734 solely to indicate this fact.
Article and publication are at http://www.genesdev.org/cgi/doi/10.1101/gad.1097603.
Corresponding author.
References
- Adelman K. and Lis, J.T. 2002. How does Pol II overcome the nucleosome barrier? Mol. Cell 9: 451–452. [DOI] [PubMed] [Google Scholar]
- Annunziato A.T. and Hansen, J.C. 2000. Role of histone acetylation in the assembly and modulation of chromatin structures. Gene Expr. 9: 37–61. [DOI] [PMC free article] [PubMed] [Google Scholar]
- Archer T.K., Cordingley, M.G., Wolford, R.G., and Hager, G.L. 1991. Transcription factor access is mediated by accurately positioned nucleosomes on the mouse mammary tumor virus promoter. Mol. Cell. Biol. 11: 688–698. [DOI] [PMC free article] [PubMed] [Google Scholar]
- Archer T.K., Lefebvre, P., Wolford, R.G., and Hager, G.L. 1992. Transcription factor loading on the MMTV promoter: A bimodal mechanism for promoter activation. Science 255: 1573–1576. [DOI] [PubMed] [Google Scholar]
- Becker M., Baumann, C.T., John, S., Walker, D., Vigneron, M., McNally, J.G., and Hager, G.L. 2002. Dynamic behavior of transcription factors on a natural promoter in living cells. EMBO Reports 3: 1188–1194. [DOI] [PMC free article] [PubMed] [Google Scholar]
- Bednar J., Horowitz, R.A., Grigoryev, S.A., Carruthers, L.M., Hansen, J.C., Koster, A.J., and Woodcock, C.L. 1998. Nucleosomes, linker DNA, and linker histone form a unique structural motif that directs the higher-order folding and compaction of chromatin. Proc. Natl. Acad. Sci. 95: 14173–14178. [DOI] [PMC free article] [PubMed] [Google Scholar]
- Berger S.L. 2002. Histone modifications in transcriptional regulation. Curr. Opin. Genet. Dev. 12: 142–148. [DOI] [PubMed] [Google Scholar]
- Bresnick E.H., Bustin, M., Marsaud, V., Richard-Foy, H., and Hager, G.L. 1992. The transcriptionally-active MMTV promoter is depleted of histone H1. Nucleic Acids Res. 20: 273–278. [DOI] [PMC free article] [PubMed] [Google Scholar]
- Butler P.J. and Thomas, J.O. 1980. Changes in chromatin folding in solution. J. Mol. Biol. 140: 505–529. [DOI] [PubMed] [Google Scholar]
- Carruthers L.M., Bednar, J., Woodcock, C.L., and Hansen, J.C. 1998. Linker histones stabilize the intrinsic salt-dependent folding of nucleosomal arrays: Mechanistic ramifications for higher-order chromatin folding. Biochemistry 37: 14776–14787. [DOI] [PubMed] [Google Scholar]
- Chen D., Hinkley, C.S., Henry, R.W., and Huang, S. 2002. TBP dynamics in living human cells: Constitutive association of TBP with mitotic chromosomes. Mol. Biol. Cell 13: 276–284. [DOI] [PMC free article] [PubMed] [Google Scholar]
- Christova R. and Oelgeschlager, T. 2002. Association of human TFIID-promoter complexes with silenced mitotic chromosomes. Nat. Cell Biol. 4: 79–82. [DOI] [PubMed] [Google Scholar]
- Cordingley M.G., Riegel, A.T., and Hager, G.L. 1987. Steroid-dependent interaction of transcription factors with the inducible promoter of mouse mammary tumor virus in vivo. Cell 48: 261–270. [DOI] [PubMed] [Google Scholar]
- Fan J.Y., Gordon, F., Luger, K., Hansen, J.C., and Tremethick, D.J. 2002. The essential histone variant H2A.Z regulates the equilibrium between different chromatin conformational states. Nat. Struct. Biol. 9: 172–176. [DOI] [PubMed] [Google Scholar]
- Fletcher T.M. and Hansen, J.C. 1995. Core histone tail domains mediate oligonucleosome folding and nucleosomal DNA organization through distinct molecular mechanisms. J. Biol. Chem. 270: 25359–25362. [DOI] [PubMed] [Google Scholar]
- Fletcher T.M., Krishnan, U., Serwer, P., and Hansen, J.C. 1994a. Quantitative agarose gel electrophoresis of chromatin: Nucleosome-dependent changes in charge, shape, and deformability at low ionic strength. Biochemistry 33: 2226–2233. [DOI] [PubMed] [Google Scholar]
- Fletcher T.M., Serwer, P., and Hansen, J.C. 1994b. Quantitative analysis of macromolecular conformational changes using agarose gel electrophoresis: Application to chromatin folding. Biochemistry 33: 10859–10863. [DOI] [PubMed] [Google Scholar]
- Fletcher T.M., Ryu, B.W., Baumann, C.T., Warren, B.S., Fragoso, G., John, S., and Hager, G.L. 2000. Structure and dynamic properties of a glucocorticoid receptor-induced chromatin transition. Mol. Cell. Biol. 20: 6466–6475. [DOI] [PMC free article] [PubMed] [Google Scholar]
- Fletcher T.M., Xiao, N., Mautino, G., Baumann, C.T., Wolford, R., Warren, B.S., and Hager, G.L. 2002. ATP-dependent mobilization of the glucocorticoid receptor during chromatin remodeling. Mol. Cell. Biol. 22: 3255–3263. [DOI] [PMC free article] [PubMed] [Google Scholar]
- Fragoso G., John, S., Roberts, M.S., and Hager, G.L. 1995. Nucleosome positioning on the MMTV LTR results from the frequency-biased occupancy of multiple frames. Genes & Dev. 9: 1933–1947. [DOI] [PubMed] [Google Scholar]
- Fragoso G., Pennie, W.D., John, S., and Hager, G.L. 1998. The position and length of the steroid-dependent hypersensitive region in the mouse mammary tumor virus long terminal repeat is invariant despite multiple nucleosome B frames. Mol. Cell. Biol. 18: 3633–3644. [DOI] [PMC free article] [PubMed] [Google Scholar]
- Fryer C.J. and Archer, T.K. 1998. Chromatin remodelling by the glucocorticoid receptor requires the BRG1 complex. Nature 393: 88–91. [DOI] [PubMed] [Google Scholar]
- Garcia-Ramirez M., Dong, F., and Ausio, J. 1992. Role of the histone “tails” in the folding of oligonucleosomes depleted of histone H1. J. Biol. Chem. 267: 19587–19595. [PubMed] [Google Scholar]
- Georgel P.T. 2002. Chromatin structure of eukaryotic promoters: A changing perspective. Biochem. Cell Biol. 80: 295–300. [DOI] [PubMed] [Google Scholar]
- Georgel P.T. and Hansen, J.C. 2003. Quantitative characterization of specific genomic promoters using agarose gel electrophoresis. Biopolymers 68: 557–562. [DOI] [PubMed] [Google Scholar]
- Georgel P., Demeler, B., Terpening, C., Paule, M.R., and van Holde, K.E. 1993. Binding of the RNA polymerase I transcription complex to its promoter can modify positioning of downstream nucleosomes assembled in vitro. J. Biol. Chem. 268: 1947–1954. [PubMed] [Google Scholar]
- Gregory P.D., Barbaric, S., and Horz, W. 1998. Analyzing chromatin structure and transcription factor binding in yeast. Methods 15: 295–302. [DOI] [PubMed] [Google Scholar]
- Griess G.A., Moreno, E.T., Easom, R.A., and Serwer, P. 1989. The sieving of spheres during agarose gel electrophoresis: Quantitation and modeling. Biopolymers 28: 1475–1484. [DOI] [PubMed] [Google Scholar]
- Hager G.L. 2001. Understanding nuclear receptor function: From DNA to chromatin to the interphase nucleus. Prog. Nucleic Acid. Res. Mol. Biol. 66: 279–305. [DOI] [PubMed] [Google Scholar]
- Hansen J.C. 2002. Conformational dynamics of the chromatin fiber in solution: Determinants, mechanisms, and functions. Annu. Rev. Biophys. Biomol. Struct. 31: 361–392. [DOI] [PubMed] [Google Scholar]
- Hansen J.C. and Lohr, D. 1993. Assembly and structural properties of subsaturated chromatin arrays. J. Biol. Chem. 268: 5840–5848. [PubMed] [Google Scholar]
- Hansen J.C. and Wolffe, A.P. 1992. Influence of chromatin folding on transcription initiation and elongation by RNA polymerase III. Biochemistry 31: 7977–7988. [DOI] [PubMed] [Google Scholar]
- ____. 1994. A role for histones H2A/H2B in chromatin folding and transcriptional repression. Proc. Natl. Acad. Sci. 91: 2339–2343. [DOI] [PMC free article] [PubMed] [Google Scholar]
- Hansen J.C., Ausio, J., Stanik, V.H., and van Holde, K.E. 1989. Homogeneous reconstituted oligonucleosomes, evidence for salt-dependent folding in the absence of histone H1. Biochemistry 28: 9129–9136. [DOI] [PubMed] [Google Scholar]
- Hansen J.C., Kreider, J.I., Demeler, B., and Fletcher, T.M. 1997. Analytical ultracentrifugation and agarose gel electrophoresis as tools for studying chromatin folding in solution. Methods 12: 62–72. [DOI] [PubMed] [Google Scholar]
- Hayes J.J. and Hansen, J.C. 2001. Nucleosomes and the chromatin fiber. Curr. Opin. Genet. Dev. 11: 124–129. [DOI] [PubMed] [Google Scholar]
- Horn P.J. and Peterson, C.L. 2002. Molecular biology. Chromatin higher order folding—Wrapping up transcription. Science 297: 1824–1827. [DOI] [PubMed] [Google Scholar]
- Horn P.J., Crowley, K.A., Carruthers, L.M., Hansen, J.C., and Peterson, C.L. 2002a. The SIN domain of the histone octamer is essential for intramolecular folding of nucleosomal arrays. Nat. Struct. Biol. 9: 167–171. [DOI] [PubMed] [Google Scholar]
- Horn P.J., Carruthers, L.M., Logie, C., Hill, D.A., Solomon, M.J., Wade, P.A., Imbalzano, A.N., Hansen, J.C., and Peterson, C.L. 2002b. Phosphorylation of linker histones regulates ATP-dependent chromatin remodeling enzymes. Nat. Struct. Biol. 9: 263–267. [DOI] [PubMed] [Google Scholar]
- Kireeva M.L., Walter, W., Tchernajenko, V., Bondarenko, V., Kashlev, M., and Studitsky, V.M. 2002. Nucleosome remodeling induced by RNA polymerase II: Loss of the H2A/H2B dimer during transcription. Mol. Cell 9: 541–552. [DOI] [PubMed] [Google Scholar]
- Kornberg R.D. and Lorch, Y. 2002. Chromatin and transcription: Where do we go from here. Curr. Opin. Genet. Dev. 12: 249–251. [DOI] [PubMed] [Google Scholar]
- Kramer P.R., Fragoso, G., Pennie, W., Htun, H., Hager, G.L., and Sinden, R.R. 1999. Transcriptional state of the mouse mammary tumor virus promoter can affect topological domain size in vivo. J. Biol. Chem. 274: 28590–28597. [DOI] [PubMed] [Google Scholar]
- Lo W.S., Trievel, R.C., Rojas, J.R., Duggan, L., Hsu, J.Y., Allis, C.D., Marmorstein, R., and Berger, S.L. 2000. Phosphorylation of serine 10 in histone H3 is functionally linked in vitro and in vivo to Gcn5-mediated acetylation at lysine 14. Mol. Cell 5: 917–926. [DOI] [PubMed] [Google Scholar]
- McGhee J.D., Nickol, J.M., Felsenfeld, G., and Rau, D.C. 1983. Higher order structure of chromatin: orientation of nucleosomes within the 30 nm chromatin solenoid is independent of species and spacer length. Cell 33: 831–841. [DOI] [PubMed] [Google Scholar]
- McNally J.G., Muller, W.G., Walker, D., Wolford, R., and Hager, G.L. 2000. The glucocorticoid receptor: Rapid exchange with regulatory sites in living cells. Science 287: 1262–1265. [DOI] [PubMed] [Google Scholar]
- Muller W.G., Walker, D., Hager, G.L., and McNally, J.G. 2001. Large-scale chromatin decondensation and recondensation regulated by transcription from a natural promoter. J. Cell Biol. 154: 33–48. [DOI] [PMC free article] [PubMed] [Google Scholar]
- Narlikar G.J., Fan, H.Y., and Kingston, R.E. 2002. Cooperation between complexes that regulate chromatin structure and transcription. Cell 108: 475–487. [DOI] [PubMed] [Google Scholar]
- Nye A.C., Rajendran, R.R., Stenoien, D.L., Mancini, M.A., Katzenellenbogen, B.S., and Belmont, A.S. 2002. Alteration of large-scale chromatin structure by estrogen receptor. Mol. Cell. Biol. 22: 3437–3449. [DOI] [PMC free article] [PubMed] [Google Scholar]
- O'Neill R.R., Mitchell, L.G., Merril, C.R., and Rasband, W.S. 1989. Use of image analysis to quantitate changes in form of mitochondrial DNA after x-irradiation. Appl. Theor. Electrophor. 1: 163–167. [PubMed] [Google Scholar]
- Ostlund Farrants A.K., Blomquist, P., Kwon, H., and Wrange, O. 1997. Glucocorticoid receptor–glucocorticoid response element binding stimulates nucleosome disruption by the SWI/SNF complex. Mol. Cell. Biol. 17: 895–905. [DOI] [PMC free article] [PubMed] [Google Scholar]
- Perlmann T. and Wrange, O. 1988. Specific glucocorticoid receptor binding to DNA reconstituted in a nucleosome. EMBO J. 7: 3073–3079. [DOI] [PMC free article] [PubMed] [Google Scholar]
- Peterson C.L. 2002. Chromatin remodeling enzymes: Taming the machines. Third in review series on chromatin dynamics. EMBO Reports 3: 319–322. [DOI] [PMC free article] [PubMed] [Google Scholar]
- Richard-Foy H. and Hager, G.L. 1987. Sequence-specific positioning of nucleosomes over the steroid-inducible MMTV promoter. EMBO J. 6: 2321–2328. [DOI] [PMC free article] [PubMed] [Google Scholar]
- Richard-Foy H., Sistare, F.D., Riegel, A.T., Simons Jr., S.S., and Hager, G.L. 1987. Mechanism of dexamethasone 21-mesylate antiglucocorticoid action: II. Receptor–antiglucocorticoid complexes do not interact productively with mouse mammary tumor virus long terminal repeat chromatin. Mol. Endocrinol. 1: 659–665. [DOI] [PubMed] [Google Scholar]
- Schild C., Claret, F.X., Wahli, W., and Wolffe, A.P. 1993. A nucleosome-dependent static loop potentiates estrogen-regulated transcription from the Xenopus vitellogenin B1 promoter in vitro. EMBO J. 12: 423–433. [DOI] [PMC free article] [PubMed] [Google Scholar]
- Schwarz P.M., Felthauser, A., Fletcher, T.M., and Hansen, J.C. 1996. Reversible oligonucleosome self-association: Dependence on divalent cations and core histone tail domains. Biochemistry 35: 4009–4015. [DOI] [PubMed] [Google Scholar]
- Serwer P., Watson, R.H., Hayes, S.J., and Allen, J.L. 1983. Comparison of the physical properties and assembly pathways of the related bacteriophages T7, T3 and phi II. J. Mol. Biol. 170: 447–469. [DOI] [PubMed] [Google Scholar]
- Sheldon L.A., Becker, M., and Smith, C.L. 2001. Steroid hormone receptor-mediated histone deacetylation and transcription at the mouse mammary tumor virus promoter. J. Biol. Chem. 276: 32423–32426. [DOI] [PubMed] [Google Scholar]
- Simpson R.T., Thoma, F., and Brubaker, J.M. 1985. Chromatin reconstituted from tandemly repeated cloned DNA fragments and core histones: A model system for study of higher order structure. Cell 42: 799–808. [DOI] [PubMed] [Google Scholar]
- Smith C.L. and Hager, G.L. 1997. Transcriptional regulation of mammalian genes in vivo. A tale of two templates. J. Biol. Chem. 272: 27493–27496. [DOI] [PubMed] [Google Scholar]
- Svaren J. and Chalkley, R. 1990. The structure and assembly of active chromatin. Trends Genet. 6: 52–56. [DOI] [PubMed] [Google Scholar]
- Thoma F., Koller, T., and Klug, A. 1979. Involvement of histone H1 in the organization of the nucleosome and of the salt-dependent superstructures of chromatin. J. Cell Biol. 83: 403–427. [DOI] [PMC free article] [PubMed] [Google Scholar]
- Truss M., Bartsch, J., Schelbert, A., Hache, R.J., and Beato, M. 1995. Hormone induces binding of receptors and transcription factors to a rearranged nucleosome on the MMTV promoter in vivo. EMBO J. 14: 1737–1751. [DOI] [PMC free article] [PubMed] [Google Scholar]
- Tse C. and Hansen, J.C. 1997. Hybrid trypsinized nucleosomal arrays: Identification of multiple functional roles of the H2A/H2B and H3/H4 N-termini in chromatin fiber compaction. Biochemistry 36: 11381–11388. [DOI] [PubMed] [Google Scholar]
- Tse C., Sera, T., Wolffe, A.W., and Hansen, J.C. 1998. Acetylation-induced decondensation of nucleosomal arrays dramatically facilitates transcription by RNA polymerase III. Mol. Cell. Biol. 18: 4629–4638. [DOI] [PMC free article] [PubMed] [Google Scholar]
- van Holde K.E. 1988. Chromatin. Springer Verlag, New York.
- Wolffe A.P. 1998. Chromatin: Structure and function, 3rd ed. Academic Press, New York.
- ____. 2001. Transcriptional regulation in the context of chromatin structure. Essays Biochem. 37: 45–57. [DOI] [PubMed] [Google Scholar]
- Woodcock C.L. and Dimitrov, S. 2001. Higher-order structure of chromatin and chromosomes. Curr. Opin. Genet. Dev. 11: 130–135. [DOI] [PubMed] [Google Scholar]
- Wu C. 1980. The 5′ ends of Drosophila heat shock genes in chromatin are hypersensitive to DNase I. Nature 286: 854–860. [DOI] [PubMed] [Google Scholar]
- Wu C., Bingham, P.M., Livak, K.J., Holmgren, R., and Elgin, S.C. 1979a. The chromatin structure of specific genes: I. Evidence for higher order domains of defined DNA sequence. Cell 16: 797–806. [DOI] [PubMed] [Google Scholar]
- Wu C., Wong, Y.C., and Elgin, S.C. 1979b. The chromatin structure of specific genes: II. Disruption of chromatin structure during gene activity. Cell 16: 807–814. [DOI] [PubMed] [Google Scholar]


