Abstract
The agouti gene product is a secreted protein that acts in a paracrine manner to regulate coat color in mammals. Several dominant mutations at the agouti locus in mice cause the ectopic, ubiquitous expression of agouti, resulting in a condition similar to adult-onset obesity and non-insulin-dependent diabetes mellitus. The human agouti protein is 85% homologous to mouse agouti; however, unlike the mouse agouti gene, human agouti is normally expressed in adipose tissue. To address whether expression of agouti in human adipose tissue is physiologically relevant, transgenic mice were generated that express agouti in adipose tissue. Similar to most humans, these mice do not become obese or diabetic. However, we found that daily insulin injections significantly increased weight gain in the transgenic lines expressing agouti in adipose tissue, but not in nontransgenic mice. These results suggest that insulin triggers the onset of obesity and that agouti expression in adipose tissue potentiates this effect. Accordingly, the investigation of agouti’s role in obesity and non-insulin-dependent diabetes mellitus in mice holds significant promise for understanding the pathophysiology of human obesity.
Keywords: transgenic mice, diabetes
Several mutations in mouse genes that lead to obesity have recently been characterized at the molecular level (1–8). Further analysis of these genes and the use of mouse lines with mutations in these genes provides an opportunity to identify new therapeutic targets for the treatment of human obesity. One of the genes that has been cloned is called agouti, because it is normally involved in regulating the differential production of melanin pigments that gives rise to the wild-type coat color (agouti) of mice (9). Dominant mutations of the agouti gene cause mice to develop yellow fur, become obese, and develop an insulin resistance state that is typically associated with non-insulin-dependent diabetes mellitus (10, 11).
The agouti gene produces several different processed forms of mRNA, all of which encode a 131-aa protein that contains a consensus signal sequence (1, 12–15). The agouti gene is normally expressed primarily in the skin, consistent with its role in pigmentation of the pelage (9). Within the hair follicle, the agouti gene appears to function by antagonizing the binding of α-melanocyte-stimulating hormone to its receptor on the melanocyte (16, 17).
The dominant agouti alleles that cause obesity and non-insulin-dependent diabetes are associated with mutations in the DNA that cause dysregulation of the agouti gene. In all cases, a heterologous promoter causes the normal agouti protein to be ectopically expressed in a ubiquitous manner (1, 12–14). We recently confirmed that the ectopic expression of the normal agouti protein is responsible for the obesity and insulin resistance through the production of transgenic mice that express the normal agouti gene from a ubiquitous promoter (18). However, from these experiments, we were not able to distinguish between a ubiquitous, systemic effect or a localized, tissue-specific effect of agouti. Even though agouti is a secreted molecule, it does not appear to circulate and instead acts in a paracrine manner (19). Therefore, it is possible that agouti acts in a localized manner within a specific tissue to induce obesity.
The human homologue of the agouti gene was recently cloned and mapped to the long arm of human chromosome 20 (20). The human agouti protein is 132 aa long and is functionally similar to the mouse protein (20). However, unlike the mouse gene, the human gene is normally expressed in adipose tissue, even in nonobese individuals (20). Agouti mutant mice show elevated lipogenic and decreased lipolytic rates in their adipose tissue (21), and in vitro experiments using purified recombinant agouti protein revealed that the agouti protein can increase fatty acid synthetase activity and cause a marked accumulation of triglycerides in cultured adipocytes (22). These findings suggest a potential role of the agouti protein in regulating fatty acid metabolism in adipose tissue.
To test the physiological significance of the expression of the agouti gene in adipose tissue in vivo, we set out to generate a mouse line that models the adipose-specific expression pattern of the agouti gene in humans. Here we describe experiments with a transgenic line that expresses the agouti gene under the influence of the aP2 promoter (23). These animals, like humans, express the agouti gene in adipose tissue and do not become obese or diabetic. However, when subjected to daily injections of insulin, they markedly increase their body weight compared with their insulin-treated, nontransgenic controls.
MATERIALS AND METHODS
Mice.
All mice were maintained at Oak Ridge National Laboratory. The FVB/N mice were obtained from our random bred stock. All mice were fed a diet containing 11% fat by weight (Mouse Diet 5015; Purina), weaned at 4 weeks of age, and subsequently weighed monthly. Food and water were provided ad libitum. All data are from mice that are hemizygous for the transgene.
Agouti Expression Constructs.
To generate the aP2 promoter–agouti expression construct, a HindIII–ClaI fragment containing the complete mouse agouti cDNA along with the simian virus 40 polyadenylylation signal sequence was isolated from BAPa (18). This fragment was cloned downstream of the −5.4 kb to +21 bp fragment of the promoter for the adipocyte P2 (aP2) gene in the pSKII+ vector (24). All constructs were verified by DNA sequencing.
Transgenic Mice.
One-cell FVB/N embryos were microinjected with the aP2a (6.6-kb KpnI–SacII fragment) construct (3 μg/ml in 10 mM Tris·HCl, pH 7.5/0.1 mM EDTA), and transgenic mice were derived as previously described (25). Some of the embryos were coinjected with the tyrosinase mini-gene (TyBS; ref. 26) to generate transgenic lines that could be visually genotyped on the albino FVB/N background. Southern and Northern blot hybridization analyses were performed as previously described (27).
Blood Analysis.
Plasma and serum were obtained by retro-orbital sinus puncture from nonfasted mice between 9 am and 11 am. Plasma insulin levels were measured by radioimmunoassay (ICN) with porcine insulin as a standard. Blood glucose concentrations were determined by blood sampling from the tail vein followed by quantification via One-Touch glucose determination system (Johnson & Johnson).
Insulin Injections.
Six- to ten-week-old male mice were subcutaneously injected between 11 am and noon with Humulin U ultralente (Eli Lilly) at a daily dose of 0.5, 1, or 2 units/day per mouse. Insulin (100 units/ml) was diluted before injection with phosphate-buffered saline so that all mice received a 200-μl injection. A 1-ml syringe was filled with 700 μl of the diluted insulin solution. To keep the insulin suspension as uniform as possible, it was mixed between each injection via plunger action.
Statistical Analysis.
All data are reported as mean ± SEM. Statistical comparison between transgenic and controls was performed using an unpaired two-group t test.
RESULTS
Development and Testing of Transgenic Lines.
To direct the expression of the normal agouti gene to adipose tissue, we generated an expression cassette in which the full-length wild-type mouse agouti cDNA was placed under the transcriptional control of the aP2 promoter (24). The promoter element that was used for these experiments was previously shown to direct expression of genes specifically to adipose tissue in transgenic mice (24). Eight transgenic founder mice were generated by pronuclear microinjection of the expression construct, and a total of five transgenic lines (FVB/N-TgN(aP2a)5373Rpw, -5374Rpw, -5409Rpw, -5412Rpw, and -5438Rpw) were established from these founder animals and will be abbreviated here as aP273, aP274, aP209, aP212, and aP238.
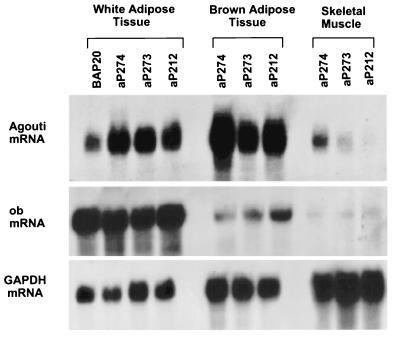
We examined the tissue-specific expression of the transgene in the aP212, aP273, and aP274 lines by Northern blotting (Fig. 1). All three lines exhibited comparable levels of agouti mRNA in white and brown adipose tissue and much greater levels of agouti mRNA in white adipose tissue than in the obese β-actin promoter–agouti transgenic line (BAP20) that we studied previously (18). Two of the three lines expressed the transgene primarily in adipose tissue, with only very low levels of expression elsewhere (data not shown). This is comparable to results reported previously for the aP2 promoter element (24). One of the three lines (aP274) also expressed relatively high levels of the transgene in other tissues, particularly muscle, which was probably due to a chromosomal position effect, which can often influence the pattern of expression of the transgene. For this reason, the aP274 line was not used for the experiments described below.
Figure 1.
Northern blot analysis of transgene expression in adipose tissue and muscle of the aP274, aP273, and aP212 lines. Samples from the β-actin promoter–agouti (BAP20) transgenic mice (18) were also included in this analysis. (A) Total RNA (20 μg) from tissues of aP212, aP273, aP274, and BAP20 mice were hybridized with a radiolabeled full-length agouti cDNA probe and, subsequently, with a cDNA probe for glyceraldehyde phosphate dehydrogenase (GAPDH) as a loading control. The same blot was then probed with a cDNA probe for ob (3) to check for adipose tissue contamination.
The low level of expression of the transgene that we detected in other tissues of the aP212 and aP273 lines could be due to the presence of adipocytes in the tissue samples that were analyzed. To test this possibility, we hybridized Northern blots from all three transgenic lines with a probe from the ob gene (3), which is known to be expressed exclusively in adipocytes (Fig. 1). There was detectable ob expression in samples other than adipose tissue, most notably muscle. These results suggest that the low levels of agouti expression found in the samples other than adipose tissue are likely from the tissue-specific expression of the transgene in the adipocytes present within these tissues.
Physiological Effects of Transgene Expression.
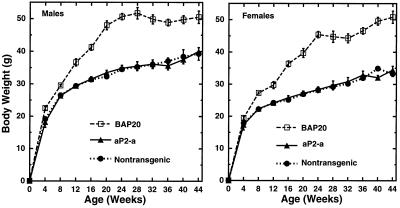
Since the aP212 and aP273 lines appeared to express the transgene in an adipose-specific manner, we used these two lines for additional experiments. Specifically, body weight was measured monthly from 4 to 44 weeks of age. There was no significant difference between transgenic and nontransgenic littermates at any time point. Additionally, plasma insulin concentrations in 25- to 30-week male mice were 29 ± 8 microunits/ml for transgenic mice and 31 ± 2 microunits/ml for nontransgenic littermates. Blood glucose concentrations were 120 ± 7 and 122 ± 11 mg/dl for transgenic and nontransgenic littermates, respectively. Body weight data was also obtained from the aP238 and aP209 lines, and there was no significant difference between transgenic and nontransgenic mice. The average body weight of the aP212, aP273, aP238, and aP209 transgenic mice and their nontransgenic littermates is compared with the body weight of the BAP20 transgenic mice, which do become obese with age (Fig. 2). These data indicate that agouti expression in adipose tissue is not sufficient for the development of obesity and diabetes.
Figure 2.
Comparison of body weight gain between transgenic lines expressing agouti in adipose tissue with the BAP20 line (18), which expresses agouti ubiquitously. The aP2-a weight curve is the average body weight from four different transgenic lines (aP212, aP273, aP238, and aP209) using the aP2 promoter to express agouti in adipose tissue. There were between 16 and 91 mice per data point. Data are presented as mean ± SEM.
Effect of Daily Insulin Injections on Weight Gain.
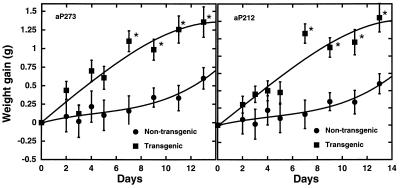
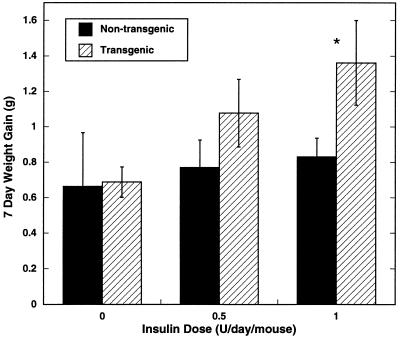
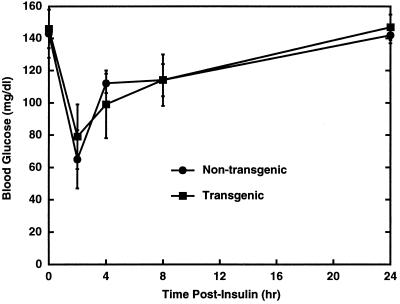
The fact that the aP212 and aP273 transgenic lines do not become obese while the BAP20 ubiquitously expressing line does suggests that another factor besides expression of agouti in adipose tissue is responsible for agouti-induced obesity. Plasma insulin concentrations are significantly elevated in 12-week-old BAP20 transgenic mice (18). The hyperinsulinemia in the BAP20 transgenic mice led us to test whether insulin may act synergistically with agouti expression in adipose tissue to trigger the obesity. Consequently, the aP212 and aP273 transgenic animals were given daily subcutaneous injections of 2 units of insulin per day per mouse for the first 7 days of the study (Fig. 3). The aP212 and aP273 animals injected with insulin exhibited a significantly greater weight gain compared with their nontransgenic, insulin-treated littermates, even over this relatively short period of time (Fig. 3). The average rate of weight gain for the insulin-injected transgenic mice was 1.7-fold greater than control mice. After discontinuing insulin treatment, the aP212 and aP273 mice continued to gain weight more quickly than the control mice until day 10, when weight gain subsided. Additionally, the effect on weight gain was observed with lower doses of insulin per day (Fig. 4). Blood glucose levels were reduced by insulin injection to levels normally seen after an overnight fast, and they returned to normal within 24 hr (Fig. 5). These results suggest that the combination of agouti expression in adipose tissue and insulin treatment induce physiological changes that result in weight gain.
Figure 3.
Effect of insulin on body weight. Eight- to ten-week-old nonobese aP273 and aP212 male mice and their nontransgenic male littermates were given daily subcutaneous injections of insulin (2 units per mouse per day) for 7 days. Body weight was measured daily. Data are presented as mean weight gain ± SEM. ∗, Value significantly different (P ≥ 0.05) from nontransgenic mice. The number of mice was between 4 and 13 per group.
Figure 4.
Effect of insulin dose on body weight. Nonobese aP212 male mice and their nontransgenic male littermates at 6–8 weeks of age were given daily subcutaneous injections of phosphate-buffered saline or insulin (0.5 or 1 unit per mouse per day) for 7 days. Body weight was measured on the morning of the day 8. Data are presented as mean weight gain ± SEM. ∗, Value significantly different (P ≥ 0.05) from nontransgenic mice. The number of mice was between three and six per group.
Figure 5.
Glucose values following insulin administration. Eight- to ten-week-old nonobese aP212 male mice and their nontransgenic male littermates were given a subcutaneous injection of insulin (1 unit per mouse per day), and blood glucose was measured over a 24-hr period. Data are presented as mean blood glucose ± SEM. The number of mice was between three and five for each time point.
DISCUSSION
The agouti gene is expressed in adipose tissue in humans and has been shown to regulate lipid metabolism in cultured adipose cells in vitro (22). Although the agouti gene is not normally expressed in adipose tissue in the mouse, we were able to induce the expression of high levels of agouti in white and brown adipose tissue by expressing the cloned mouse gene under the control of the aP2 promoter. While agouti expression in adipose tissue resulted in phenotypically normal mice, there was a clear interaction between transgene expression and insulin treatment. When the transgenic animals were treated with daily injections of insulin, they gained significantly more weight than their nontransgenic littermates. Our hypothesis is that daily insulin treatments mimic the hyperinsulinemia that is normally observed in the obese transgenic lines that express agouti ubiquitously (18). This result indicates that the ectopic expression of agouti specifically in adipose tissue may have a substantial metabolic effect on the animal. Accordingly, these data provide the first in vivo evidence that the expression of agouti in adipose tissue may be physiologically significant in humans, as humans exhibit agouti expression in adipose tissue.
The apparent synergistic effect of both agouti and insulin in the aP2-agouti transgenics is noteworthy, because both agouti and insulin can have similar effects on adipocytes. Insulin is well known to stimulate lipogenesis and inhibit lipolysis. Likewise, in vitro data demonstrate that agouti stimulates fatty acid synthetase activity and triglyceride accumulation in cultured adipocytes (22). It is possible that agouti modulates adipocyte metabolism by antagonizing adipocyte melanocortin receptor binding, similar to its antagonism of melanocyte melanocortin receptor binding in the regulation of coat color (16). Recently, it was demonstrated that mouse adipocytes express high levels of melanocortin 2 (MC2) receptor (28). The ligand for the MC2 receptor is adrenocorticotropic hormone (ACTH), a potent lipolytic stimulant in rat adipocytes (29, 30). Therefore, agouti antagonism of ACTH binding to its adipocyte receptor may lead to an inhibition of ACTH-mediated lipolysis.
Our data suggest that hyperinsulinemia in the agouti mutants is a critical component for the onset of obesity. Moreover, Warbritton et al.(31) observed pancreatic β cell hyperplasia in the obese agouti mutants before any observed obesity, suggesting that the hyperinsulinemia precedes the obesity. Therefore, in addition to its role in adipose tissue, agouti could act directly on the pancreas to produce the hyperinsulinemia. The ability of agouti to increase intracellular calcium concentration ([Ca2+]i; ref. 32) further suggests that it may play a physiological role in the pancreas. Glucose oxidation increases the ATP:ADP ratio and inhibits ATP-sensitive K+ channels in β cells. Closing of the K+ channels results in β cell depolarization and activation of voltage-gated Ca2+ channels, which causes a net increase in [Ca2+]i. The increased [Ca2+]i triggers insulin release from secretory granules (33). A reasonable prediction is that agouti may mimic these normal cellular events by increasing [Ca2+]i and causing increased secretion of insulin from the pancreas. The production of a transgenic line with a β cell-specific promoter driving expression of the agouti gene will allow us to test this hypothesis directly. Alternatively, agouti may act on the central nervous system to increase insulin secretion by decreasing sympathetic tone and increasing parasympathetic tone.
We have demonstrated an apparent synergistic effect of agouti and insulin on body weight. These results are complementary to in vitro data suggesting that adipocytes play a primary role in agouti-induced obesity (22). We propose that the hyperinsulinemia present in the BAP20 and obese agouti mutant mice is the result of multiple events. Expression of agouti in the pancreas could stimulate insulin secretion from pancreatic β cells and may be an early event in the etiology of obesity. The hyperinsulinemia could then act synergistically with agouti in adipose tissue to promote weight gain. Additionally, as body weight increases and tissues are exposed to sustained hyperinsulinemia, insulin resistance develops, causing hyperglycemia, which further increases insulin secretion. Thus, a perpetual cycle begins that ultimately leads to non-insulin-dependent diabetes mellitus. As with all obesity models, there must also be an accompanying decrease in energy expenditure or increase in food intake, which may be mediated via agouti and/or insulin’s action on the central nervous system. Further analysis of the mutant and transgenic mice ectopically expressing the agouti gene should help us understand some of the molecular pathways associated with human obesity and diabetes.
Acknowledgments
The aP2 promoter was kindly provided by R. Graves and B. Spiegelman. We wish to thank E. J. Michaud and A. P. Davis for their comments on the manuscript. R.J.M. was supported by an appointment to the Alexander Hollaender Distinguished Postdoctoral Fellowship Program sponsored by the U.S. Department of Energy, Office of Health and Environmental Research, and administered by the Oak Ridge Institute for Science and Education. This work was supported by Oak Ridge National Laboratory, managed by Lockheed Martin Energy Research Corp. for the U.S. Department of Energy under Contract DE-AC05-96OR22464, and by a grant from GlaxoWellcome Inc.
Footnotes
.
References
- 1.Bultman S J, Michaud E J, Woychik R P. Cell. 1992;71:1195–1204. doi: 10.1016/s0092-8674(05)80067-4. [DOI] [PubMed] [Google Scholar]
- 2.Miller M W, Duhl D M J, Vrieling H, Cordes S P, Ollmann M M, Winkes B M, Barsh G S. Genes Dev. 1993;7:454–467. doi: 10.1101/gad.7.3.454. [DOI] [PubMed] [Google Scholar]
- 3.Zhang Y, Proenca R, Maffei M, Barone M, Leopold L, Friedman J M. Nature (London) 1994;372:425–432. doi: 10.1038/372425a0. [DOI] [PubMed] [Google Scholar]
- 4.Chen H, Charlat O, Tartaglia L A, Woolf E A, Weng X, Ellis S J, Lakey N D, Culpepper J, Moore K J, Breitbart R E, Duyk G M, Tepper R I, Morgenstern J P. Cell. 1996;84:491–495. doi: 10.1016/s0092-8674(00)81294-5. [DOI] [PubMed] [Google Scholar]
- 5.Tartaglia L A, Dembski M, Weng X, Deng N, Culpepper J, Devos R, Richards G J, Campfield L A, Clark F T, Deeds J, Muir C, Sanker S, Moriarty A, Moore K J, Smutko J S, Mays G B, Woolf E A, Monroe C A, Tepper R I. Cell. 1995;83:1263–1271. doi: 10.1016/0092-8674(95)90151-5. [DOI] [PubMed] [Google Scholar]
- 6.Naggert J K, Fricker L D, Varlamov O, Nishina P M, Rouille Y, Steiner D F, Carroll R J, Paigen B J, Leiter E H. Nat Genet. 1995;10:135–142. doi: 10.1038/ng0695-135. [DOI] [PubMed] [Google Scholar]
- 7.Noben-Trauth K, Naggert J K, North M A, Nishina P M. Nature (London) 1996;380:534–538. doi: 10.1038/380534a0. [DOI] [PubMed] [Google Scholar]
- 8.Kleyn P W, Fan W, Kovats S G, Lee J J, Pulido J C, et al. Cell. 1996;85:281–290. doi: 10.1016/s0092-8674(00)81104-6. [DOI] [PubMed] [Google Scholar]
- 9.Silvers W K. The Coat Colors of Mice: A Model for Mammalian Gene Action and Interaction. New York: Springer; 1979. [Google Scholar]
- 10.Klebig M L, Wilkinson J E, Woychik R P. In: Molecular Analysis of the Mouse Agouti Gene and the Role of Dominant Agouti-Locus Mutations in Obesity and Insulin Resistance. Bray G A, Ryan D H, editors. Vol. 5. Baton Rouge: Louisiana State Univ. Press; 1996. pp. 120–160. [Google Scholar]
- 11.Yen T T, Gill A M, Frigeri L G, Barsh G S, Wolff G L. FASEB J. 1994;8:479–488. doi: 10.1096/fasebj.8.8.8181666. [DOI] [PubMed] [Google Scholar]
- 12.Bultman S J, Klebig M L, Michaud E J, Sweet H O, Davisson M T, Woychik R P. Genes Dev. 1994;8:481–490. doi: 10.1101/gad.8.4.481. [DOI] [PubMed] [Google Scholar]
- 13.Michaud E J, Bultman S J, Stubbs L J, Woychik R P. Genes Dev. 1993;7:1203–1213. doi: 10.1101/gad.7.7a.1203. [DOI] [PubMed] [Google Scholar]
- 14.Michaud E J, van Vugt M J, Bultman S J, Sweet H O, Davisson M T, Woychik R P. Genes Dev. 1994;8:1463–1472. doi: 10.1101/gad.8.12.1463. [DOI] [PubMed] [Google Scholar]
- 15.Vrieling H, Duhl D M J, Miller S E, Miller K A, Barsh G S. Proc Natl Acad Sci USA. 1994;91:5667–5671. doi: 10.1073/pnas.91.12.5667. [DOI] [PMC free article] [PubMed] [Google Scholar]
- 16.Lu D, Willard D, Patel I R, Kadwell S, Overton L, Kost T, Luther M, Chen W, Woychik R P, Wilkison W O, Cone R D. Nature (London) 1994;371:799–802. doi: 10.1038/371799a0. [DOI] [PubMed] [Google Scholar]
- 17.Blanchard S G, Harris C O, Ittoop O R, Nichols J S, Parks D J, Truesdale A T, Wilkison W O. Biochemistry. 1995;34:10406–10411. doi: 10.1021/bi00033a012. [DOI] [PubMed] [Google Scholar]
- 18.Klebig M L, Wilkinson J E, Geisler J G, Woychik R P. Proc Natl Acad Sci USA. 1995;92:4728–4732. doi: 10.1073/pnas.92.11.4728. [DOI] [PMC free article] [PubMed] [Google Scholar]
- 19.Wolff G L. Genetics. 1963;48:1041–1058. doi: 10.1093/genetics/48.8.1041. [DOI] [PMC free article] [PubMed] [Google Scholar]
- 20.Kwon H Y, Bultman S J, Loffler C, Chen W J, Furdon P J, Powell J G, Usala A L, Wilkison W, Hansmann I, Woychik R P. Proc Natl Acad Sci USA. 1994;91:9760–9764. doi: 10.1073/pnas.91.21.9760. [DOI] [PMC free article] [PubMed] [Google Scholar]
- 21.Yen T T, Allan J A, Yu P L, Acton M A, Pearson D V. Biochim Biophys Acta. 1976;441:213–220. doi: 10.1016/0005-2760(76)90164-8. [DOI] [PubMed] [Google Scholar]
- 22.Jones B H, Kim J-H, Zemel M B, Woychik R P, Michaud E J, Wilkison W O, Moustaid N. Am J Physiol. 1996;270:E192–E196. doi: 10.1152/ajpendo.1996.270.1.E192. [DOI] [PubMed] [Google Scholar]
- 23.Graves R A, Tontonoz P, Ross S R, Spiegelman B M. Genes Dev. 1991;5:428–437. doi: 10.1101/gad.5.3.428. [DOI] [PubMed] [Google Scholar]
- 24.Ross S R, Graves R A, Greenstein A, Platt K A, Shyu H-L, Mellovitz B, Spiegelman B M. Proc Natl Acad Sci USA. 1990;87:9590–9594. doi: 10.1073/pnas.87.24.9590. [DOI] [PMC free article] [PubMed] [Google Scholar]
- 25.Hogan B, Costantini F, Lacy E. Manipulating the Mouse Embryo: A Laboratory Manual. Plainview, NY: Cold Spring Harbor Lab. Press; 1986. [Google Scholar]
- 26.Overbeek P A, Aguilar-Cordova E, Hanteen G, Schaffner D L, Patel P, Lebovitz R M, Lieberman M L. Transgenic Res. 1991;1:31–37. doi: 10.1007/BF02512994. [DOI] [PubMed] [Google Scholar]
- 27.Sambrook J, Fritsch E F, Maniatis T. Molecular Cloning: A Laboratory Manual. Plainview, NY: Cold Spring Harbor Lab. Press; 1989. [Google Scholar]
- 28.Boston B A, Cone R D. Endocrinology. 1996;137:2043–2050. doi: 10.1210/endo.137.5.8612546. [DOI] [PubMed] [Google Scholar]
- 29.White J E, Engel F L. J Clin Invest. 1958;37:1556–1563. doi: 10.1172/JCI103748. [DOI] [PMC free article] [PubMed] [Google Scholar]
- 30.Oelofsen W, Ramachandrand J. Arch Biochem Biophys. 1983;225:414–421. doi: 10.1016/0003-9861(83)90048-6. [DOI] [PubMed] [Google Scholar]
- 31.Warbritton A, Gill A M, Yen T T, Bucci T, Wolff G L. Proc Soc Exp Biol Med. 1994;206:145–151. doi: 10.3181/00379727-206-43733. [DOI] [PubMed] [Google Scholar]
- 32.Zemel M B, Kim J H, Woychik R P, Michaud E J, Kadwell S H, Patel I R, Wilkison W O. Proc Natl Acad Sci USA. 1995;92:4733–4737. doi: 10.1073/pnas.92.11.4733. [DOI] [PMC free article] [PubMed] [Google Scholar]
- 33.Newgard C B, McGarry J D. Annu Rev Biochem. 1995;64:689–719. doi: 10.1146/annurev.bi.64.070195.003353. [DOI] [PubMed] [Google Scholar]


