

Abstract
Introduction
Auditory sensory processing dysfunction is a core component of schizophrenia, with deficits occurring at 50 ms post-stimulus firmly established in the literature. Given that the initial afference of primary auditory cortex occurs at least 35 ms earlier, however, an essential question remains: how early in sensory processing do such deficits arise, and do they occur during initial cortical afference or earlier, which would implicate subcortical auditory dysfunction.
Objective
To establish the onset of the earliest deficits in auditory processing, we examined the time window demarcating the transition from subcortical to cortical processing: 10 ms to 50 ms during the so-called middle latency responses (MLRs). These remain to be adequately characterized in patients with schizophrenia.
Methods
We recorded auditory evoked potentials (AEPs) to simple tone-pips from 15 control subjects and 21 medicated patients with longer-term schizophrenia or schizoaffective disorder (illness duration 16 yr, standard deviation [SD] 9.4 yr), using high-density electrical scalp recordings. Between-group analyses assessed the integrity of the MLRs across groups. In addition, 2 source-localization models were conducted to address whether a distinction between subcortical and cortical generators of the MLRs can be made and whether evidence for differential dorsal and ventral pathway contributions to auditory processing deficits can be established.
Results
Robust auditory processing deficits were found for patients as early as 15 ms. Evidence for subcortical generators of the earliest MLR component (P20) was provided by source analysis. Topographical mapping and source localization also pointed to greater decrements in processing in the dorsal auditory pathway of patients, providing support for a theory of pervasive deficits that are organized along the lines of a dorsal–ventral distinction.
Conclusions
Auditory sensory dysfunction in schizophrenia begins extremely early in processing, is evident during initial cortical afference and is also seen at earlier subcortical processing stages in the thalamus. The implication is that well-established sensory processing deficits in schizophrenia may be secondary to earlier subcortical dysfunction. Our findings do not preclude the possibility of even earlier deficits in auditory sensory processing during the auditory brainstem responses.
Medical subject headings: electroencephalography, event-related potentials, auditory-evoked potentials
Abstract
Introduction
Le dysfonctionnement du traitement sensoriel auditif est un élément fondamental de la schizophrénie, et les déficits qui se produisent 50 ms après le stimulus sont fermement établis dans les écrits. Cependant, comme l'afférence initiale du cortex auditif primaire se produit au moins 35 ms plus tôt, une question essentielle persiste : à quel stade du début du traitement sensoriel ces déficits surgissent-ils, et se produisent-ils au cours de l'afférence corticale initiale ou plus tôt, ce qui mettrait en cause un dysfonctionnement auditif infracortical?
Objectif
Pour déterminer l'apparition des déficits les plus précoces dans le traitement auditif, nous avons analysé le créneau temporel qui démarque la transition du traitement infracortical au traitement cortical, soit le créneau de 10 à 50 ms au cours des réponses dites à latence intermédiaire (RLI). Il reste à les caractériser adéquatement chez les patients atteints de schizophrénie.
Méthodes
Nous avons enregistré les potentiels évoqués auditifs (PEA) par de simples tonalités chez 15 sujets témoins et chez 21 patients prenant des médicaments et atteints de schizophrénie de longue durée ou de troubles schizo-affectifs (durée de la maladie, 16 ans; écart-type [ET], 9,4 ans) en utilisant des enregistrements électriques à haute densité sur le cuir chevelu. Des analyses entre groupes ont permis de déterminer l'intégrité des RLI entre les groupes. En outre, on a exécuté deux modèles de localisation de la source afin de déterminer s'il est possible d'établir une distinction entre les générateurs infracorticaux et corticaux des RLI et s'il est possible de démontrer que les voies dorsale et ventrale contribuent différemment au déficit du traitement auditif.
Résultats
On a constaté des déficits solides du traitement auditif chez les patients dès 15 ms. L'analyse de la source a produit des preuves dans le cas des générateurs infracorticaux de la composante la plus précoce des RLI (P20). L'analyse topographique et la localisation de la source ont aussi indiqué que les décréments étaient plus importants dans le traitement dans la voie auditive dorsale des patients, ce qui appuie une théorie relative au déficit omniprésent structuré suivant les lignes de démarcation d'une distinction dorsale-ventrale.
Conclusions
Le dysfonctionnement sensoriel auditif dans les cas de schizophrénie commence extrêmement tôt au cours du traitement de l'information, se manifeste au cours de l'afférence corticale initiale et on le constate aussi à des stades plus précoces du traitement infracortical dans le thalamus. Il en découle que des déficits bien établis du traitement sensoriel dans les cas de schizophrénie peuvent être secondaires à un dysfonctionnement infracortical antérieur. Nos constatations n'excluent pas la possibilité de déficits survenant encore plus tôt dans le traitement sensoriel auditif, au cours des réponses du cervelet au stimulus auditif.
Introduction
Examination of basic sensory processes in patients with schizophrenia has revealed surprisingly early and often quite severe processing deficits across sensory modalities, with patients showing impairment in some of the most basic visual,1,2 somatosensory3 and auditory4,5 sensory functions. In the present study, we sought to further characterize early auditory dysfunction in this population by examining the auditory evoked potential (AEP) of patients from time points earlier than 50 ms (the P1 or P50; we will refer to this and later components herein as the P1, N1, P2, etc.), a processing period about which there is little consensus in the literature. The P1 component of the AEP appears to be the earliest point in processing at which there is reasonable agreement that clear deficits are present in schizophrenia,6–9 and dysfunction at this stage is often cited as evidence of early auditory sensory impairment. That is, the P1 is found to be of significantly smaller amplitude in patients across various paradigms.7 Although 50 ms is early, when one considers the timing of the initial afferent volley in the primary auditory cortex, it becomes clear that a substantial amount of cortico–cortical processing will already have occurred by this time. Both intracranial recordings in humans and source analysis of scalp-recorded data have shown that primary afference in A1 occurs at least 35 ms earlier.10–12 Given what is known about the speed of transmission across sensory regions into higher-order cortices,13–17 this timing raises the possibility, if not probability, that processing during the timeframe of the auditory P1 component is already subject to feedback inputs from higher-order regions in both auditory association cortices and perhaps even from the frontal cortex18. Thus, if we are to definitively establish that early feed forward (or “bottom up”) sensory processing is impaired in this population, we will need to establish whether there are deficits during the middle latency responses (MLRs), which can be seen from 15 ms to 50 ms. Because these potentials are typically of very small amplitude when recorded at the scalp, this has proven difficult to establish in this population, and a detailed study is warranted.
Here, we evaluated the relative integrity of midlatency AEP in patients, compared with healthy control subjects, on a passive auditory task in which a standard, repetitive tone was presented binaurally. AEPs have been broken down into early, middle and late latency components. Typically, the responses occurring before 10 ms (brainstem responses I to VII) are termed early; those that peak between 10 ms and 35 ms (N0, P0, P20, Pa, Nb) are termed middle and components after and including 50 ms are considered late (P1, N1, P2, N2, etc.).19 However, in the literature, the P1 is often identified as a middle latency component (see Boutros et al9 and Adler et al20), and there is further overlap in the terminology; 1 study claimed to investigate middle latency components concerned solely with the P1 and P2,21 and another defined middle latency components as those that onset between 10 ms and 80 ms.22 For our purposes, when we refer to middle latency components, we are referring to those up to and including the P1, which tends to peak at approximately 50 ms.
A paucity of literature characterizes middle latency AEPs in patients. To the best of our knowledge, there have only been 3 studies of midlatency components in people with schizophrenia to date.22–24 In one study, no difference was seen between the Pa (22–38 ms) and Pb (45–60 ms) of control subjects and patients.22 The second study is difficult to interpret, because midlatency components were analyzed by deriving a single average from all components found within the 15 ms-to 100-ms window,23 thereby incorporating both middle and late components into a single metric. The third study also used a time window of 30 ms to 100 ms poststimulus and focused on the P50/M50 as the first point of divergence between patients and control subjects. As such, it is equivocal whether deficits in patients exist in the middle latency AEP. There is, however, emerging evidence from animal models of schizophrenia that points to auditory dysfunction in MLRs, although drawing parallels to humans can be difficult. A study employing a human patient population is warranted.
A secondary goal of our investigation was exploratory in nature: we sought to determine whether a strategy could be developed to assess the relative integrity of dorsal and ventral auditory pathways in our patient population. In the auditory system, there is emerging evidence of functionally distinct dorsal and ventral pathways governing sound localization and sound–object recognition, respectively.25–34 Electrophysiological studies of schizophrenia patients have found differential impairment of dorsal and ventral pathways in the visual system; namely, the dorsal pathway shows greater deficits.2,35,36 One theoretical justification for differential impairment is the “dual trends theory,” which suggests that pathology in patients' brains is organized along the lines of a dorsal–ventral distinction and that patients demonstrate deficits at all cytoarchitectonic levels of the “dorsal trend.”37 To our knowledge, an electrophysiological investigation of early sensory processing in the dorsal and ventral auditory pathways has not yet been conducted with schizophrenia patients or, indeed, in healthy control subjects. The auditory ventral stream comprises regions anterior to the primary auditory core region, whereas the dorsal auditory stream courses posteriorly into the caudolateral belt areas and on into the parietal cortex. Given the anatomic separation of these 2 streams, we reasoned that, by carefully tracking the scalp topographies of processing before P1, and through source-localization methods, we might be able to observe a dissociation of activation flow that corresponds to the ventral and dorsal streams, respectively.
Methods
Subjects
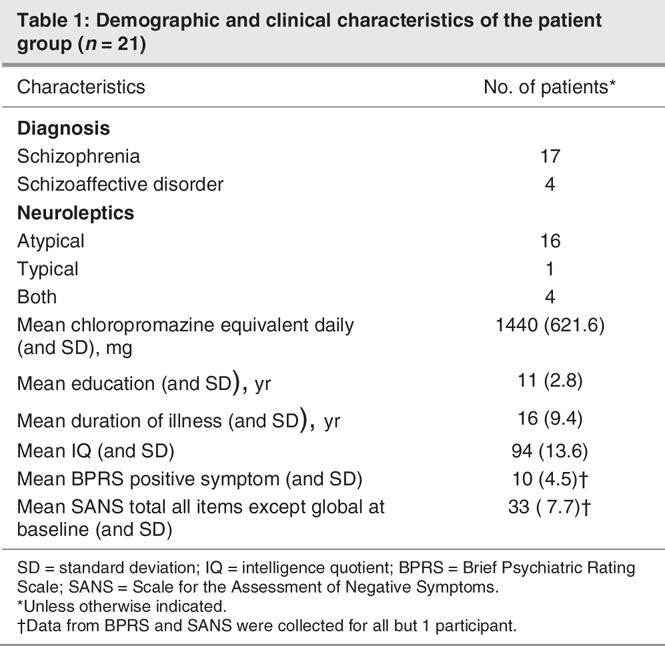
Twenty-one male patients aged 20–50 years (mean 35, standard deviation [SD], 10 yr) participated in the study. Of these, 17 had a diagnosis of longer-term schizophrenia and 4 of schizoaffective disorder, as defined by the Diagnostic and Statistical Manual of Mental Disorders, fourth edition (DSM-IV)38 criteria. Data from 1 patient were eliminated due to anomalous morphology and no discernible componentry. Control subjects comprised 15 paid volunteers (2 women) aged 22–52 (mean 35, SD 9.4,) years. The mean age of patients and control subjects did not differ significantly (t34 = 2.03, p = 0.72); all reported normal hearing. Handedness was determined by the Edinburgh Handedness Inventory39; 3 patients and 1 control subject were left-handed.
Patients met the following inclusion criteria: 1) current DSM-IV–defined diagnosis of schizophrenia or schizoaffective disorder. A best estimate diagnostic approach was used, in which information from the Structured Clinical Interview for DSM-IV Axis I Disorders (SCID-I/P)40,41 was supplemented by information from family members, psychiatrists and medical records to generate a diagnosis; 2) aged 18 to 55 years; and 3) competent and willing to sign informed consent. Capacity evaluations were performed by a licensed professional on the research team. Subjects were excluded from inclusion if they had organic brain disorder, mental retardation, or significant medical illness. We excluded people with a current substance-induced psychotic disorder or a psychotic disorder due to a general medical condition, as determined by DSM-IV criteria, and those who posed significant risk of suicidal or homicidal behaviour. Participants with prior intermittent alcohol or substance use were not excluded unless they met DSM-IV criteria for current alcohol or drug dependence in the last 6 months. We excluded subjects with any history of hearing loss or injury to the ears or any additional axis I diagnoses. Results of hearing tests were available for 13 of 21 patients; results indicated normal hearing in these patients.
Normal control subjects met the following inclusion criteria: 1) matched for age to patients with schizophrenia; 2) no current axis I or axis II disorder or mood or psychotic disorder for the last 5 years, as assessed by the SCID-I–nonpatient version)42; 3) no current or past history of psychotropic medication use; 4) no family history of psychotic illness; 5) aged between 18 and 55 years; and 6) willing to sign informed consent. We excluded subjects with an organic brain disorder, mental retardation, or significant medical illness, as well as those with a significant risk of suicidal or homicidal behaviour. Participants with prior intermittent alcohol or substance use were not excluded unless they met DSM-IV criteria for current alcohol or drug dependence in the last 6 months. We also excluded subjects with any history of hearing loss or injury to the ears.
We collected demographic information for all patients, including age, sex and illness duration (Table 1). Symptom ratings were analyzed with the Brief Psychiatric Rating Scale (BPRS) and the Scale for the Assessment of Negative Symptoms (SANS).43 Clinical global impression (CGI) ratings were obtained. Doses of antipsychotic, anticholinergic and adjuvant medications (e.g., antidepressants, sedatives or hypnotics, antimanics, antiepileptics) were recorded. Antipsychotic doses were translated into chlorpromazine equivalents, using the best available literature at the time of data analysis for conversion of dose levels of newer antipyschotic drugs (e.g., sertindole, quetiapine).
Table 1
This study was approved by the Nathan S. Kline Institute for Psychiatric Research, the Rockland Psychiatric Center Institutional Review Board and the Institutional Review Board of The Graduate Center of the City University of New York.
Procedure
Subjects were seated in a comfortable chair in a dimly illuminated, sound-attenuated, electrically shielded (Braden Shielding Systems, Tulsa, Okla.) chamber and were asked to keep head and eye movements to a minimum, while watching a silent subtitled movie. Standard 1000 Hz 74 dB sound pressure level (SPL) tones of 250 ms duration, with a 10-ms rise and fall time and with a fixed interstimulus interval (ISI) of 500 ms stimulus onset asynchrony (SOA) = 750 ms were delivered binaurally to subjects through headphones. Ten percent of the total tones presented were duration deviants (100 ms); these deviants were not analyzed here and will be investigated further in a separate publication. Acoustical stimuli were created and presented with the Gentask module of the Neuroscan STIM system (Herndon, Va.). Stimuli were transduced through Sennheiser HD600 headphones.
Data acquisition
Continuous EEG was acquired through the ActiveTwo BioSemi electrode system from 168 scalp electrodes, digitized at 512 Hz. For display purposes, data were filtered with a low-pass 0-phase shift 96 dB 40 Hz filter after acquisition. With the BioSemi system, every electrode or combination of electrodes can be assigned as the reference, which is done purely in software after acquisition. BioSemi replaces the ground electrodes that are used in conventional systems with 2 separate electrodes: Common Mode Sense (CMS) active electrode and Driven Right Leg (DRL) passive electrode. These 2 electrodes form a feedback loop, thus rendering them references. For a detailed description of the referencing and grounding conventions used by the BioSemi active electrode system, visit www.biosemi.com/faq/cms&drl.htm. After acquiring the data, we rereferenced them to the nasion for analysis. After each recording session, before the electrode cap was removed from the subject's head, the 3D coordinates of all 168 electrodes with reference to anatomic landmarks on the head (nasion, preauricular notches) were digitized with a Polhemus Magnetic 3D digitizer. Data were epoched (–100 ms prestimulus to 600 ms poststimulus) and then averaged off-line. Upwards of 2700 trials were collected for each subject. We defined baseline as the mean voltage over –50 ms to 0 ms preceding the onset of the stimulus. Trials with blinks and large eye movements were rejected offline on the basis of horizontal and vertical electrooculogram recordings. An artifact rejection criterion of 80–100 μV was used at all other electrode sites to exclude periods of high EMG and other noise transients. From the remaining artifact-free trials, we computed averages for each subject. These averages were then visually inspected for each individual to ensure that clean recordings with sufficient trial numbers were obtained and that no artifacts were still included. Data were ultimately averaged across all subjects (grand mean averages) within a given group (patient or control) for visual comparison at the group level and for display purposes. Throughout this paper, we use the familiar nomenclature of the modified 10–20 electrode system to refer to the positioning of electrode sites. Because our montage contains considerably more scalp sites than this nomenclature allows for, in some cases, we refer to the nearest site in the 10–20 electrode system.
Analysis strategy
For each electrode, the data from all subjects in each group (patients and control subjects) were collapsed into a single average waveform. These group-averaged waveforms were visually inspected across all scalp sites, and the familiar components of the AEP were identified. This allowed for definition of the precise timing of a given component and delineation of the scalp sites at which each component was of maximal amplitude. We expected to identify evoked responses to these simple tonal stimuli that were consistent with the literature: the typical sequence of AEP components (P0, P20, Pa, P1, N1), albeit with more precise scalp localization than typical, due to the high-density montage used here. Expected latencies and amplitudes for the components were based on Picton's seminal paper from 1974,19 which provides detailed characterizations of each of these components. We expected to observe scalp distributions for the components typical of responses that are generated in both the thalamus (early MLRs) and the auditory cortex (later MLRs), as suggested by the literature.19
Defining the components in this way allows the overall waveform to be used to constrain the number of analyses undertaken. It also allows the experimenter to define the exact timeframes and scalp sites from which measures will be taken for statistical analysis, without reference to the differential responses between patients and control subjects. Further, although the use of broadly defined component peaks is an excellent means of limiting the number of statistical tests that will be conducted, these components clearly represent the activity of many simultaneously active brain generators at any given moment (e.g., Foxe and Simpson14). Limiting the analysis to a set of discrete component peaks for electrodes where the components are maximal represents a highly conservative approach to the analysis of high-density ERP data and raises the likelihood of missed effects (type II errors) in these rich data sets. Therefore, we also undertook an exploratory (post-hoc) analysis phase (described in the Statistical cluster plots section).
For each component of interest (P0, P20, Pa, P1), we calculated the area under the waveform for an epoch centred on the peak of the grand mean (epochs were either 4, 6 or 10 ms depending on the width of the respective component's peak). These area measures were then used as the dependent variable. To investigate differences between the AEPs of patients and control subjects, we tested each identified component with a 2 × 2 × 3 mixed analysis of variance (ANOVA). The factors were group (patients v. control subjects), hemisphere (right v. left) and electrode. Analyses were performed across 3 pairs of scalp electrodes for each component; we chose 3 electrodes at homologous locations on each side of the scalp that best represented the maximal amplitude of the component of interest in a given analysis (Fig. 1). Statistical analyses were conducted with the SPSS software package (SPSS version 11.5).
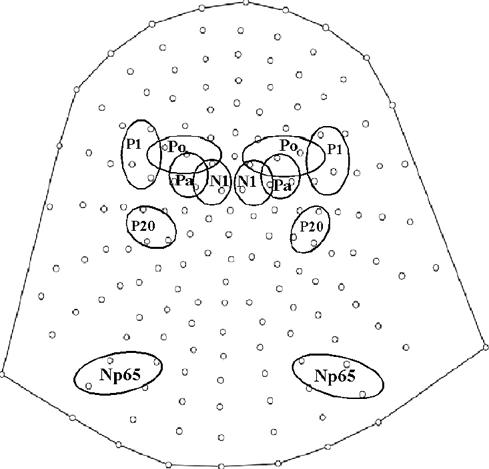
Fig. 1: Selected scalp areas used to analyze each component of interest. Maximum amplitude for each component was found in the outlined regions.
The ERP data were also inspected post hoc for further components of interest. We identified a negativity occurring over the posterior parietooccipital scalp at approximately 65 ms. The amplitude of this negativity was measured within a 10-ms window centred on its estimated peak latency of about 65 ms at 3 electrode sites in each hemisphere (PO7, PO3, O1, PO8, PO4, O2). Voltage maps were constructed with the brain electrical source analysis (BESA, version 5.0.4) software package (MEGIS Software GmbH, Munich, Germany, 2003).
Power analysis
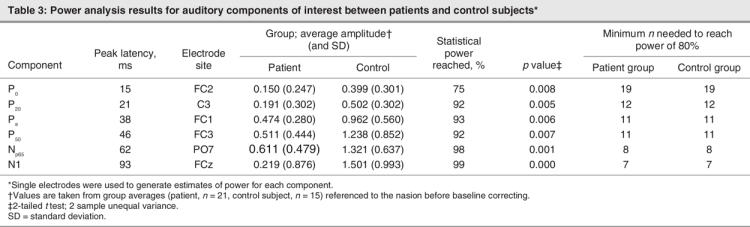
Because a central premise of this study is that potentially small effects might have been missed or overlooked in previous studies, we sought to fully characterize issues of power to identify effects in the low-amplitude early MLR responses. Our primary question concerned the earliest patient differences in the AEP. To determine our sensitivity to any such differences, we conducted power analyses on the basis of single-electrode comparisons (2-tailed t test), using average amplitudes of each component of interest at the peak latency. For this power analysis, we chose a single electrode at the maximum amplitude to represent each component rather than aggregating electrodes, to avoid obfuscating small effects. This way, we were able to determine where we had power to find significance and where we might lack power.
Statistical cluster plots
As described above, we took a conservative approach to the analysis of the high-density ERP data to limit the number of statistical tests performed, with the spatiotemporal properties of the componentry delimiting the tests. Our conservative approach raises the likelihood of missed effects. We therefore performed an exploratory analysis as a means of fully exploring the richness of our data set and as a hypothesis-generating tool for future research. We have devised a simple method for testing the entire data matrix for possible effects, which we term statistical cluster plots. These cluster plots were derived by calculating point-wise, paired, 2-tailed t tests between the AEP of patients and control subjects. The results were then arrayed on a single grid, with scalp regions (electrode positions) plotted on the y axis and poststimulus time plotted on the x axis; this provided a snapshot overview of significant differences between the groups across scalp regions over time. In the present data treatment, periods of significant difference were only plotted if a strict alpha criterion of 0.01 was exceeded for at least 6 consecutive data points (see Weathell and Levitt44).
Source analysis
We used dipole source analysis, as implemented in the BESA software suite (version 5.0.4), to estimate the intracranial generators underlying the greatest patient–control differences. BESA models the best-fit location and orientation of multiple intracranial dipole generator configurations to produce the waveform observed at the scalp, using iterative adjustments to minimize the residual variance between the solution and the observed data (see, for example, Scherg and Von Cramon45). For the purpose of the modelling, an idealized 3-shell spherical head model with a radius of 85 mm and scalp and skull thickness of 6 mm and 7 mm was assumed. Group averaged waveforms were used to maintain the highest possible signal-to-noise ratio. No filters were applied in BESA.
We employed 2 a priori strategies for source modelling. The first was to step through each of our components of interest individually, building on the model with each addition of a dipole pair. First, in the control group, 2 dipoles were allowed to freely fit for both location and orientation within a 6-to-12– ms period the first peak, using the genetic algorithm module of BESA 5.0.4. Additional pairs of symmetrically constrained dipoles were fitted to the next 2 components such that a 6-dipole solution was created. The solution for the control group was then applied to the patient group. Talairach coordinates for all dipoles were used to estimate the Brodmann's areas of the closest grey-matter structures. Notably, in dipole analysis, each of the modelled equivalent current dipoles represents an oversimplification of the activity in the areas, thus each should be considered as representative of centres of gravity and not necessarily discrete neural locations.46–48
Our second strategy was employed to assess where in the auditory cortex the earliest differences between patients and control subjects occurred. We reasoned that, if the earliest differences fell anterior to the auditory core region, this would implicate the ventral auditory stream, and if these differences fell posterior and superior to the auditory core (Heschl's gyrus), this would implicate generators in the auditory dorsal stream. We describe the specific steps we took for this source analysis (source analysis II) in the Results section.
Results
Electrophysiological results
We begin with a description of the general ERP patterns observed in the data of our 15 control subjects. Figure 2 shows data from group-averaged waveforms taken from an anterior and a posterior electrode. The timing and scalp topographies of the components identified here are highly consistent with those found in the literature.19 We were able to reliably identify components as early as the Po, which peaked at approximately 15 ms poststimulus over the frontal, frontocentral and central scalp sites. The next component we saw clearly was the P20, which peaked posteriorly at about 21 ms. The Pa was present at about 38 ms over frontal and frontocentral sites. The P1 peaked at about 46 ms at frontocentral and central sites. The N1 peaked at about 95 ms over the central scalp.
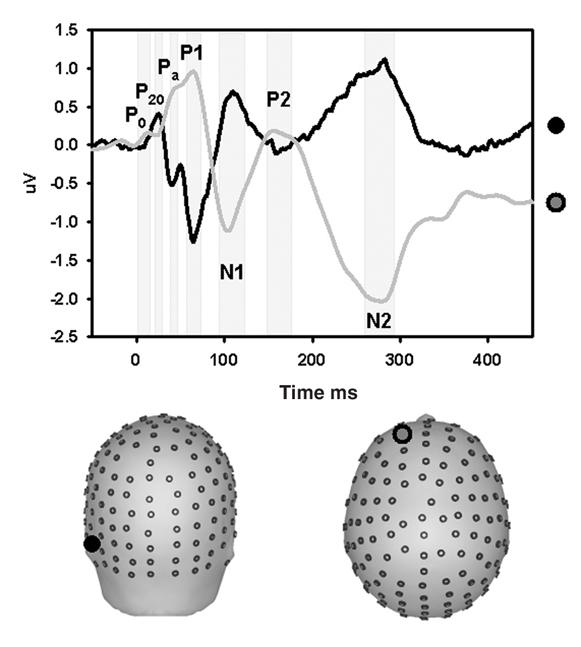
Fig. 2: Early components of the auditory evoked potential in a group of healthy control subjects (n = 15). Waveforms are derived from group averages taken from a representative anterior site (grey waveform) and a posterior electrode (black waveform). Components are labelled on the basis of the latency of the peak amplitude, polarity and sequential position of the major deflections. Most of the early AEPs are clearly identified in the waveform from the anterior site. The P20 is best viewed in the posterior waveform. A magnified view of the period 0–200 ms is included above the entire epoch view.
We compared the electrophysiological responses of healthy control subjects to those of our patient group (Fig. 3). As in the control subjects, the classical AEP componentry was evident and the earliest peaks (P0, P20 and Pa) all had identical latencies to those of the control subjects. Very slight delays in peak latency were noted for the P1, which peaked at approximately 50 ms frontocentrally and centrally. The N1 peaked over central scalp sites at about 95 ms. By fully describing and characterizing middle latency components of the AEP over the entire scalp surface of control subjects and schizophrenia patients, we found evidence for the earliest point of auditory sensory dysfunction in schizophrenia from time points as early as the first identifiable MLR component (P0).

Fig. 3: Auditory evoked potentials in control subjects (n = 15) are blue and in patients (n = 21) are red (interstimulus interval = 500 ms). Data from 10 electrodes spanning anterior to posterior scalp sites are presented.
Individual components
The P0
As above, the P0 had a peak latency of approximately 15 ms in both groups and was evident at both the frontal and parietal scalp sites. The ANOVA revealed a significant main effect of group (F1,34 = 35.65, p = 0.031), reflecting the fact that the amplitude of P0 was significantly attenuated for patients. No other main effect or interaction was significant (for a summary of ANOVA results, see Table 2). Topographic mapping showed a similar parietal distribution for the P0 in both groups (Fig. 4, row A). A subtraction map (far right panel) shows the map of the difference between control subjects and patients, indicating a largely similar distribution to that of the base P0 map. The exploratory statistical cluster plots (Fig. 5) indicated that this difference began very early, and assessment of the running t tests showed an onset at just 8 ms. We conducted a posthoc ANOVA over the 8–12 ms window to better characterize this effect. A main effect of group was significant (F1,34 = 8.99, p = 0.005).
Table 2
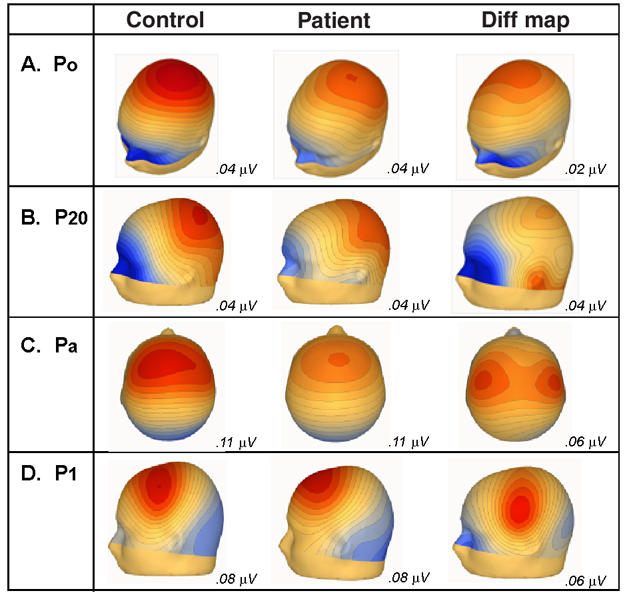
Fig. 4: Voltage scalp topographies from the control and patient group-averaged waveforms, for the Po, P20, Pa, and P1, and the corresponding difference between the control subject and the patient.
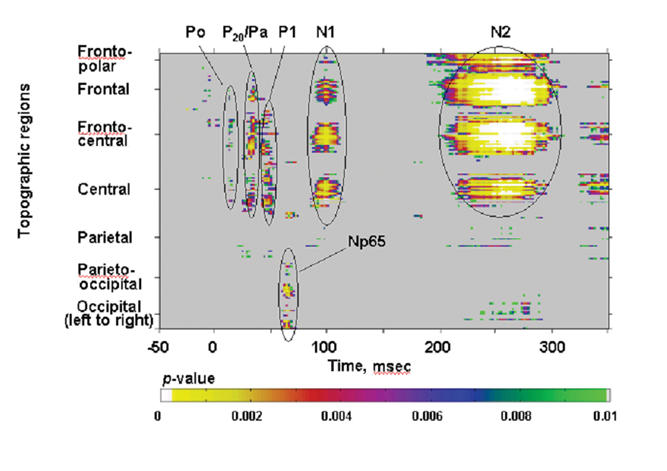
Fig. 5: The Np65: A pronounced negative-going deflection over the posterior scalp, peaking at 65 ms. This is shown for patients (red) and control subjects (blue), from right and left occipital sites where the response was maximal.
The P20
In our data, the P20 was represented by a positivity that peaked at about 21 ms posteriorly and centrally in both groups. The ANOVA revealed a significant main effect of group (F1,34 = 7.47, p = 0.01). It also revealed a significant effect of hemisphere (F1,34 = 6.43, p = 0.016), attributable to greater amplitudes at this latency over the left hemisphere for both control subjects and patients. As with the P0, the topographic maps (Fig. 4, row B) show a strong parietal positivity, with a concomitant frontopolar negativity for control subjects. The P20 distribution for patients was very similar, with a parietal positivity. The frontopolar negativity was substantially weaker. This was particularly evident in the subtraction map, where the largest difference between groups was concentrated over the frontopolar and inferior-frontal scalp. The subtraction map also suggested that a lateral inferotemporal source might be implicated during this timeframe.
The Pa
The Pa had a peak latency of approximately 38 ms over anterior scalp sites for both patients and control subjects. An ANOVA for this component revealed a significant main effect of group (F1,34 = 12.16, p = 0.001), again reflecting substantial attenuation of Pa amplitude in patients. Topographic mapping showed a frontocentral positivity for both groups, broadly distributed across both hemispheres, with a concomitant occipital negativity (Fig. 4, row C). The subtraction map had a clearly dissociable distribution from that of the base Pa maps. It revealed a pair of bilateral positive foci that were more lateralized and concentrated more posteriorly over the central scalp. The fact that this difference map is dissociable from the base Pa map indicates the multiple generator configurations that must underlie the activity pattern during this processing period. The maps suggest that the Pa reflects both lateral activity as well as contributions from more fronto–central generators. It also suggests that the fronto–central aspect of the response is more preserved in patients, whereas the bulk of the deficit for this group is in the more lateral responses.
The P1
As with the Pa, the P1 component likely reflects the activity of multiple simultaneously active generators. Over frontocentral regions, the P1 had a peak latency of about 46 ms for control subjects and patients. A robust main effect of group was found (F1,33 = 6.68, p = 0.014). The topographies of the P1 for control subjects showed a central positivity with a concomitant occipital negativity, whereas the patients' positivity was distinctly more frontal and had a similar occipital negativity (Fig. 4, row D). Here, the subtraction map was distinctly different from either base P1 map, again suggesting contributions from more posterior generators.
In our investigation of the earliest components that reveal differences between patients and control subjects, we used the data to make estimates of power (Table 3). We hypothesized that there would be significant attenuation of AEPs in patients, compared with control subjects, from time points as early as the first recognizable component (the P0). However, we anticipated the effect size for this difference to be quite small. Indeed the power analysis revealed the lowest level of power for the P0; nevertheless, this low was a healthy 75%. While this is slightly below 80%, we are confident in this medium-sized effect, with highly significant differences in the amplitude of the P0 of patients and control subjects.
Table 3
To better detect effects between patients and control subjects in this large data set, we computed a statistical cluster plot (see Methods). This served as a hypothesis-generating tool; it provided us with a snapshot of where and when significant differences were occurring between groups. Thus, we observed the clear and distinct clusters corresponding in latency to known auditory components (P0, P20, Pa, P1, N1, N2) (Fig. 6). This reveals differences at the earliest discernible component, which appear to propagate up the auditory processing stream. By and large, the statistical cluster plots correspond to the effects uncovered by our ANOVAs, for which we had a priori hypotheses. In addition, the plot revealed an unpredicted difference at about 65 ms, which we have termed the Np65; this component is discussed below. Substantial amplitude differences were observed at the latency of the N2, as we would expect, given that patient deficits at later latencies follow the earlier deficits, which are the focus of our study.
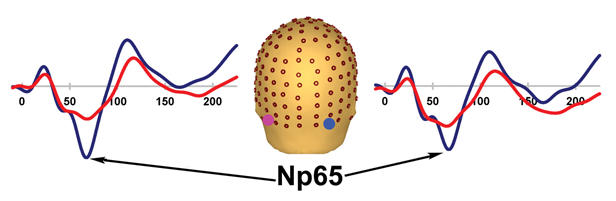
Fig. 6: Statistical cluster plot of the results of the point-wise running t tests comparing the amplitudes of the patient and control subject auditory evoked potentials. Time, with respect to stimulus onset, is presented on the x axis and topographic regions of 168 electrode positions on the y axis. Colour corresponds to significance level. Note that there is overlap between the P20 and Pa.
The Np65
A previously uncharacterized negative-going component was discovered in the course of this investigation. Appearing posteriorly at about 65 ms, it was very pronounced in our control subjects. Here, we refer to this component as the Np65. This component was highly attenuated in patients. The amplitude of the Np65 was measured within a 6-ms window centred on its peak latency of 62 ms at 3 electrode sites on the left and 3 on the right. An ANOVA revealed a robust effect of group (F1, 34 = 11.25, p = 0.002) (Fig. 5). The component is clearly dissociable from the known AEPs.
Results of dipole source analysis I: subcortical–cortical distinction
We used the BESA genetic algorithm dipole analysis module to determine the location of the generators of the middle latency components. A symmetrically constrained pair of dipoles was allowed to freely fit for a 6-ms time window around the first peak, the P0 (12–18 ms). The resulting model, explaining 95.8% of the variance, placed sources bilaterally in the thalamus (Talairach coordinates x = 13, y = –7, z = 7). Given previous findings of major contributions from the primary auditory cortex to the middle latency potentials (see Discussion), we constrained a pair of dipoles to the primary auditory cortices bilaterally (46, –24, 12) to test whether such a model could also satisfactorily explain P0 activity. This model explained only 70.3% of the variance. Further, when the dipoles were allowed to freely fit from this starting point in the primary auditory cortex, they returned to the thalamus (Fig. 7, panel A).

Fig. 7: Dipole source analysis I. Panel A: source analysis of the P0 in control subjects and patients reliably models the generators bilaterally in the thalamus; this 2-dipole model explains 95.8% of the variance for control subjects and 87.6% for patients during a 12–18 ms time window. Panel B: overlay of the fit of dipoles 1 (red) and 2 (blue) in patients and control subjects.
In the next step, we fixed the first dipole pair in their original thalamic locations and then a symmetrically constrained second dipole pair was fit to a 6-ms time window around the next discernible peak, the P20 (18–24 ms). Bilateral sources were modelled in the insula (45, 10, 15), with 98.2% of the variance explained. These sources fell approximately 10 mm anterior to the primary auditory cortex. As a test, dipoles were fixed in the core of primary auditory cortices bilaterally (46, –24, 12); this model explained 96.8% of the variance.
A third symmetrically constrained dipole pair was allowed to fit to a 12-ms time window around the next discernible peak, the Pa (32–44 ms). This model placed bilateral sources in the region of the inferior parietal lobule (IPL; 43, –28, 25) and explained 99.2% of the variance across the 32–44 ms epoch. Given that it was only explaining 1.0% more of the variance than the 4-dipole model, these sources likely reflect subtle contributions from posterior regions. Previous electrophysiological investigations49,50 have shown Heschl's gyrus to be the generator of the Pa. Once more, we fixed this dipole pair in the primary auditory cortex (46, –24, 12) and found that it still explained 94.3% of the variance for this epoch.
When the epoch around the P1 was selected (50–72 ms), the 6-dipole solution already explained 98.7% of the variance, rendering further dipoles uninformative. For the entire epoch of interest, encompassing the P0, P20, Pa and P1 (0–72 ms), the model explained 98.6% of the variance. For the epoch 0–50 ms, which excludes the P1 contribution, 98.3% of the variance continued to be explained.
Next, we applied this model to our patient data (Fig. 7, panel B). For the 0–72 ms epoch, the model explained 97.8% of the variance. Excluding the P1, the model explained 98% of the variance for the epoch 0–50 ms.
Results of dipole source analysis II: exploration of dorsal-ventral dissociation
To explore where the differences between patients and control subjects are localized, we employed the following strategy: first, we separately source localized the P1 for control subjects and patients to provide us with a metric of 1 well-known auditory component, the major generators of which are known to be in and around the core region of the auditory cortices10,51–54 (Fig. 8, panel A). We placed a pair of symmetric dipoles in the primary auditory cortex (42, –28, 12); the model explained 92.2% of the variance. For the patients, this model explained 94.0% of the variance.
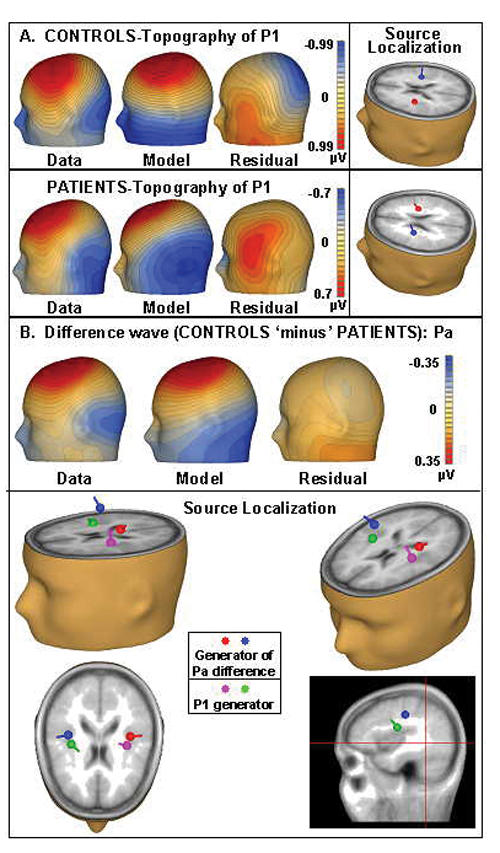
Fig. 8: Source analysis II. Panel A: source analysis of the P1 for both patients and control subjects reveals remarkably similar localizations of the generators for both groups. Panel B: the green and purple dipoles demarcate the modelled source of the P1 in control subjects. The red and blue dipoles, which show the modelled difference (control subjects minus patients) for the Pa, are both posterior and superior to the first pair.
Next, we sought to localize the generator of one early significant difference between the AEP of patients and control subjects — the Pa (Fig. 8, panel B). Using a difference wave (control subjects minus patients) for this model, we freely fit a pair of symmetric dipoles to the 25–45 ms time frame to determine where the generators for the early difference were localized, relative to those of the P1. By comparing this with the P1 source analysis, we hypothesized that we would have an indicator as to whether the differences between patients and control subjects were more apparent in areas falling in the dorsal or the ventral auditory pathway. With 88.6% of the variance explained, we found bilateral stable generators that were distinctly superior and posterior to those of the P1 for control subjects and patients (47, –18, 24), a trajectory that we would expect to see for components in the dorsal stream. This suggests that these earliest differences can be explained by a trend that seems to favour the dorsal stream. Our first dipole source model (Dipole Source Analysis I) corroborates this finding, in that model bilateral sources for the Pa were localized exactly 13 mm posterior and superior to the primary auditory cortex in the IPL.
When these source localization results for differences in patients and control subjects were contrasted with the same for the ERPs, it was clear that, in both, a dorsal–ventral distinction could be observed. In the average waveforms, there were clearly observable differences between anterior and posterior (corresponding to ventral and dorsal auditory pathways, respectively) AEPs generated in patients versus control subjects. For example, the difference between patients' and subjects' P1 at an anterior site (F2) failed to reach statistical significance (p = 0.270): here, patients' P1 (0.753, SD 0.705) was 25% smaller than that of control subjects (1.008, SD 0.649). However, the difference in P1 amplitude at a posterior site (P3) was significant (p = 0.000): the P1 of patients (–0.003, SD 0.367) was 87% smaller than that of control subjects (0.346, SD 0.452) (Fig. 3).
Discussion
The present data show robust decreases in amplitude during the middle latency AEP in patients with schizophrenia. In fact, significant differences were uncovered as early as 15 ms poststimulation. We see significant attenuation in patients as early as the P0 (15 ms), the first auditory component after the ABR. The next of the classically defined midlatency components, the P20, is also substantially attenuated in our patient group, as is the Pa (39 ms). As such, these data strongly support the notion that auditory sensory processing is impaired in schizophrenia from the moment of initial cortical afference in the primary auditory cortex and appears to strongly imply that impairment begins even earlier, during subcortical processing. Additionally, topographic mapping and source analysis techniques suggest that the early cortical deficits may be weighted more toward the dorsal than the ventral auditory processing pathway. The implications of these results are discussed in more detail in what follows.
Early auditory processing deficits in schizophrenia
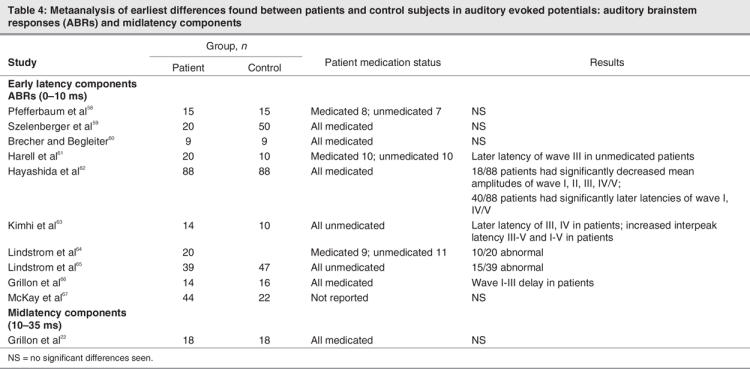
There is a substantial literature describing effects on later-latency AEP components (> 50 ms) in patients with schizophrenia, and deficits in these components (e.g., P1, N1, mismatch negativity [MMN]) have been consistently documented.55–57 Likewise, investigations of early subcortical responses, auditory brainstem responses (ABRs), are abundant, although findings from these studies have been somewhat equivocal (Table 4). For example, Lindstrom and colleagues published 2 studies,64,65 with the first reporting abnormal ABRs in just 10 of 20 patients, and the second reporting less than one-half the patients (15 of 39) showing abnormal ABRs. Four studies by other groups also found significant latency delays in the ABRs of patients,61–63,66 while 4 other studies found no differences between the ABRs of patients and control subjects.58–60,67 Although our understanding of ABRs in schizophrenia is incomplete, these studies appear to suggest that auditory processing deficits may well occur before initial afference of the primary auditory cortex (i.e., subcortically). Unfortunately, the next time period of auditory processing that has been the focus of significant research efforts begins with the auditory P1 component, some 45 ms after the end of the ABR. As outlined in the introduction, the intervening MLR potentials have been largely skipped over, despite the fact that they demarcate a key period in sensory processing; they bracket the point of initial afference of the primary auditory cortex.
Table 4
With regard to the P1, unlike the ABR responses, there is widespread agreement in the literature pointing to patient deficits (See, for example, Erwin et al,6 Clementz et al,7 Freedman et al,8 Boutros et al,9 Nagamoto et al68 and Braffe69). This component is most often studied in the context of a gating paradigm that involves presenting a tone (S1) followed by a short interstimulus interval (200–500 ms) before presenting a second tone (S2).7,8,20,70,71 Typically, the amplitude of the P1 evoked by the second of these tones (S2) is measured as a function of the amplitude of the P1 evoked by the first tone (S1). Control subjects show a clearly attenuated P1 to S2, presumably due to sensory gating. This attenuation is frequently found to be decreased in patients.7,8,69–71 More importantly for our study, it has been shown that this effect is largely a consequence of an attenuated P1 to the first S1 stimulus.72 However, our data suggest that the point of divergence between the auditory evoked response of patients and healthy individuals comes much earlier, the significance of which lies in bridging our knowledge about subcortical versus cortical deficits in schizophrenia.
Regarding medications, several studies have indicated that the effects of medications do not account for early sensory processing deficits. For example, work done in our laboratory revealed visual processing deficits in both medicated and unmedicated patients, as well as in the first degree relatives of patients with schizophrenia (reviewed in Butler et al73). Ford and colleagues74 showed that both auditory and visual ERPs, especially the early automatic components, were unaffected by antipsychotic administration. In the auditory domain, Michie55 reported that duration MMN reduction cannot be attributed to neuroleptic medication. Roemer and Shagass75 found that antipsychotic medications normalized the N1 in a patient population. Valkonen-Korhonen and colleagues56 reviewed findings that, although antipsychotic agents may improve attention-dependent processing, they do not necessarily ameliorate preattentive deficits. In a delayed tone-matching task, Rabinowicz and colleagues76 reported that patients' impaired performance could not be attributed to medication. In terms of the effects of psychoactive drugs other than antipsychotics, one investigation of diazepam failed to find an effect for this benzodiazepine on P50 gating.77 Another group of investigators found that neuroleptic medication acting on dopaminergic systems actually increased P50 amplitudes in patients.78
Source localization of midlatency auditory evoked responses
Thus far, what we know about the sources of the midlatency potentials has been largely determined through magneto-encephalographic (MEG) recordings, and there tends to be consensus in the MEG literature that these components are mainly generated in the primary auditory cortex. Using 37-channel MEG recordings, Kuriki and colleagues79 source localized the M10, M18 and M30 to the medial part of Heschl's gyrus on the supratemporal plane. However, they modelled data from only 4 subjects (only 2 for the M10), and these researchers acknowledged that the existence of additional subcortical sources could not be excluded. Also, using 37-channel MEG and recording from 6 subjects, Yvert and colleagues49 localized the Pa, Nb and Pb (28, 40, and 52 ms, respectively) to the medial and anterolateral portions of Heschl's gyri. Yoshiura and colleagues50 used 7-channel MEG recordings taken from 7 subjects; the sources of Na, Pa, Nb, and Pb were all estimated to be in the supratemporal auditory cortex. Makela and colleagues80 recorded from 9 control subjects with a 122-channel array, also pointing to cortical generators for the P30. It is clear from these studies that at least the later MLR components are generated mainly in auditory cortices on the superior temporal plane, which is consistent with the source localizations reported here; however, these recordings do not rule out subcortical sources for the earliest MLR components. It is important to emphasize that a major limitation of MEG is its insensitivity to activity from deep sources,81 and it is thought that subcortical sources cannot be effectively detected.82 Indeed, Hillebrand and Barnes81 found that source depth was the single most important factor in determining the sensitivity of MEG to brain activity.81 They show that the probability of finding a source decreases as the distance from the skull surface increases. Further, they specifically determined that MEG has a relatively low detection probability for areas in the temporal lobe, an issue that will be further compounded for deeper sources in the thalamus.
Another human study of the midlatency AEPs used intracranial recordings in the auditory cortices of 37 humans to localize the generators of auditory components at 30, 50, 60 and 75 ms10; all were found to be distributed mediolaterally along Heschl's gyrus. However, intracranial recordings taken from the primary auditory cortex are insensitive to subcortical generators, because they will only detect highly local activity. These researchers acknowledged that their data could not exclude a subcortical generator for the earliest of the MLRs, the Na, which was a negative inversion of the P20 found in their data set at 19 ms.
Until now, there has been limited discussion of subcortical versus cortical sources of the MLRs. One exception was a study done by Kaseda and colleagues in 1991.83 This electrophysiological investigation of the midlatency responses found the Na to be abnormal in patients with localized lesions of the thalamus and subcortical white matter. Consistent with their findings, our data suggest that there are thalamic generators of the earliest of the middle latency components (P0), and cortical generators of the P20, Pa and P1. Although our model is unable to identify the specific thalamic nucleus of the source, because resolution of this spatial order is beyond the capacity of dipole analysis, it seems likely that the medial geniculate body (MGB) is the major generator. Our topographic map of the P0 corroborates the existence of a subcortical generator, because it reflects widely distributed activity over frontal and posterior regions, with a distribution that is not consistent with generators on the supratemporal plane or primary auditory cortex (Fig. 4).
The implication is clear that the earliest afferent inputs to the primary auditory cortex arrive from subcortical regions that already show evidence of dysfunction in patients with schizophrenia, arguing for a bottom-up model of auditory processing deficits. A recent study from our group by Butler and colleagues84 reflects analogous findings in the visual system of patients; these researchers found cortical processing deficits preceded by subcortical dysfunction. These findings may represent an organizing principle for neurocognitive dysfunction in schizophrenia.
Dorsal–ventral auditory pathways
There is growing evidence for functionally distinct auditory pathways in humans29,32 pointing to a “what/where” distinction analogous to that seen in the visual system.85 These have been identified as a spatial stream that subserves sound localization and courses dorsally and a pattern or object stream that subserves sound–object recognition and courses ventrally.33 Dorsal and ventral streams have been studied in the visual system to a much greater extent than in the auditory system, and it is well established in the visual system that 2 functionally distinct pathways exist.85 In work done in our laboratory, we have seen consistent deficits of dorsal stream processing in the visual system of patients with schizophrenia, relative to ventral stream processing. Visual P1 amplitudes were significantly reduced to a much greater degree over the dorsal scalp than in the ventral scalp in a study by Foxe and colleagues.2 This finding has since been replicated twice by our group in studies of dorsal–ventral visual stream interaction in schizophrenia.35,36 Although this study did not expressly test the functional integrity of the dorsal and ventral auditory pathways in patients, automatic sensory activation of these pathways is an inherent result of performing virtually any auditory task. Therefore, we analyzed these data with an eye toward the relative functioning of these separable streams. Topographic analysis of the early sensory processing effects suggested that more posterior generators were involved in the observed deficits, and exploratory source analysis suggested that these deficits were localized within regions of the inferior parietal lobes. These data are consistent with relatively greater impairment of dorsal auditory pathway functioning in patients. It may be surprising to learn that parietal lobes contribute to auditory processing at such an early stage, but a recent intracranial investigation of human auditory processing from our group showed substantial contributions to both the Pa and the P1 from the superior parietal lobule, beginning as early as 25 ms.86
If it is determined that patients have a dorsal auditory deficit, an obvious prediction is that they should show deficits in auditory sound localization tasks. To date, some studies have assessed sound localization in schizophrenia, with mixed results.87–90 In 1961, McGhie and Chapman87 collected subjective reports from patients suggesting they experienced difficulty identifying the source of a sound. Balogh and colleagues88 examined the ability of patients to judge the direction of auditory stimuli; results were mixed. de Gelder and colleagues89 reported that a patient group performed as well as control subjects in sound localization, but these findings were derived from an audiovisual integration task. Another study found the “precendence effect,” a phenomenon by which inhibitory processes in the auditory system aid in sound localization, to be intact in patients.90 None of these studies has investigated the underlying neurophysiology of sound localization in schizophrenia. Although the exploratory results presented here suggest deficits specific to the dorsal pathway, studies that employ tasks that are specifically designed to tap the functional integrity of both dorsal and ventral pathways are warranted.
Implications of early sensory deficits for higher-order function
The hallmark of schizophrenia is dysfunction of higher-order cognitive functioning; this, however, raises the question of how early sensory deficits play into the clinical manifestations of the disorder. Evidence is now forthcoming that these early deficits may be the antecedents of what appear to be higher-order deficits. When Kraepelin described dementia praecox in 1911,91 he identified the dysfunction of attention as a cardinal feature of the disease. However, we now know that disrupted attentional processes may actually be due to basic auditory processing deficits. Evidence to support this assertion comes from studies of the auditory MMN; numerous studies have found the MMN to both duration and frequency deviants to be highly attenuated in patients with schizophrenia,4,5,92 and this attenuation has been correlated with behavioural outcomes, such as subsequent deficits in attention-dependent processing.93 One patient study found that lack of left-hemisphere lateralization of the MMN was associated with positive symptoms.94 Baldeweg and colleagues95 found MMN amplitude in patients to be significantly correlated with cognitive impairment. Further evidence that higher-order processing is impaired subsequent to deficits in basic sensory processing comes from auditory and visual experiments done in our laboratory. Leitman and colleagues96 have shown that impairments in interpreting affective prosody (a higher-level social-cognitive function) are secondary to basic auditory deficits. In the visual system, deficits in the magnocellular system are associated with reading difficulties,97 whereas early visual processing deficits are associated with deficits in independent living skills in patients.73
Conclusions
This study establishes that auditory sensory processing deficits are ubiquitous in patients with schizophrenia from time points as early as 15 ms. A source localization model of the first major component of the MLR (P20) in healthy control subjects and in patients indicates that it is generated subcortically, whereas subsequent midlatency components are mainly generated cortically. This argues for a bottom-up model of impairment in auditory sensory processing. Further, the present findings warrant further investigation of a possible dorsal–ventral distinction in the auditory processing of patients. Such an investigation could lead us to a better understanding of possible organizing principles of dysfunction in schizophrenia. Elucidating such overarching principles will ultimately allow for the development of more specific diagnostic and therapeutic interventions. Measures developed in the course of investigations such as this may serve as endophenotypes for etiological investigations of schizophrenia (for example, Yeap and others98).
Acknowledgments
This work was supported by grants from the National Institute of Mental Health (RO1-MH65350 to Dr. Foxe) and by a Ruth L. Kirschstein predoctoral fellowship to Ms. Leavitt (NRSA–MH074284). Dr. Molholm received support from a Kirschstein postdoctoral fellowship (NRSA – MH068174). Thanks to Manuel Gomez-Ramirez and Galia Koonyevsky for their ongoing support and to the team at the Cognitive Neurophysiology laboratory for their dedication and hard work. We thank Ms. Gail Silipo for her assistance in recruiting subjects and her enduring dedication to the patients.
Footnotes
Contributors: Ms. Leavitt and Drs. Molholm, Ritter and Foxe designed the study. Ms. Leavitt and Shpaner and Dr. Foxe acquired the data, which Ms. Leavitt and Drs. Molholm and Foxe analyzed. Ms. Leavitt and Drs. Molholm and Foxe wrote the article, and all authors revised it. All authors gave final approval for the article to be published.
Competing interests: None declared.
Correspondence to: Dr. John J. Foxe, The Cognitive Neurophysiology Laboratory, Nathan S. Kline Institute for Psychiatric Research, Program in Cognitive Neuroscience and Schizophrenia, 140 Old Orangeburg Rd., Orangeburg, NY 10962; fax 845 398-6545; foxe@nki.rfmh.org
References
- 1.Butler PD, Schechter I, Zemon V, et al. Dysfunction of early-stage visual processing in schizophrenia. Am J Psychiatry 2001;158:1126-33. [DOI] [PubMed]
- 2.Foxe JJ, Doniger GM, Javitt DC. Early visual processing deficits in schizophrenia: impaired P1 generation revealed by high-density electrical mapping. Neuroreport 2001;12:3815-20. [DOI] [PubMed]
- 3.Buchsbaum MS, Awsare SV, Holcomb HH, et al. Topographic differences between normals and schizophrenics: the N120 evoked potential component. Neuropsychobiology 1986;15:1-6. [DOI] [PubMed]
- 4.Javitt DC, Doneshka P, Grochowski S, et al. Impaired mismatch negativity generation reflects widespread dysfunction of working memory in schizophrenia. Arch Gen Psychiatry 1995;52:550-8. [DOI] [PubMed]
- 5.Javitt DC, Strous RD, Grochowski S, et al. Impaired precision, but normal retention, of auditory sensory (“echoic”) memory information in schizophrenia. J Abnorm Psychol 1997;106:315-24. [DOI] [PubMed]
- 6.Erwin RJ, Mawhinney-Hee M, Gur RC, et al. Midlatency auditory evoked responses in schizophrenia. Biol Psychiatry 1991;30:430-42. [DOI] [PubMed]
- 7.Clementz BA, Blumenfeld LD, Cobb S. The gamma band response may account for poor P50 suppression in schizophrenia. Neuroreport 1997;8:3889-93. [DOI] [PubMed]
- 8.Freedman R, Adler LE, Gerhardt GA, et al. Neurobiological studies of sensory gating in schizophrenia. Schizophr Bull 1987;13:669-78. [DOI] [PubMed]
- 9.Boutros NN, Korzyukov O, Jansen B, et al. Sensory gating deficits during the mid-latency phase of information processing in medicated schizophrenia patients. Psychiatry Res 2004;126:203-15. [DOI] [PubMed]
- 10.Liegeois-Chauvel C, Musolino A, Badier JM, et al. Evoked potentials recorded from the auditory cortex in man: evaluation and topography of the middle latency components. Electroencephalogr Clin Neurophysiol 1994;92:204-14. [DOI] [PubMed]
- 11.Rupp A, Hack S, Gutschalk A, et al. Fast temporal interactions in human auditory cortex. Neuroreport 2000;11:3731-6. [DOI] [PubMed]
- 12.Scherg M, Von Cramon D. Evoked dipole source potentials of the human auditory cortex. Electroencephalogr Clin Neurophysiol 1986;65:344-60. [DOI] [PubMed]
- 13.Lakatos P, Pincze Z, Fu KM, et al. Timing of pure tone and noise-evoked responses in macaque auditory cortex. Neuroreport 2005; 16: 933-7. [DOI] [PubMed]
- 14.Foxe JJ, Simpson GV. Flow of activation from V1 to frontal cortex in humans. A framework for defining “early” visual processing. Exp Brain Res 2002;142:139-50. [DOI] [PubMed]
- 15.Foxe JJ, Schroeder CE. The case for feedforward multisensory convergence during early cortical processing. Neuroreport 2005;16:419-23. [DOI] [PubMed]
- 16.Schroeder CE, Lindsley RW, Specht C, et al. Somatosensory input to auditory association cortex in the macaque monkey. J Neurophysiol 2001;85:1322-7. [DOI] [PubMed]
- 17.Bullier J. Feedback connections and conscious vision. Trends Cogn Sci 2001;5:369-70. [DOI] [PubMed]
- 18.Knight RT, Staines WR, Swick D, et al. Prefrontal cortex regulates inhibition and excitation in distributed neural networks. Acta Psychol (Amst) 1999;101:159-78. [DOI] [PubMed]
- 19.Picton TW, Hillyard SA, Krausz HI, et al. Human auditory evoked potentials. I. Evaluation of components. Electroencephalogr Clin Neurophysiol 1974;36:179-90. [DOI] [PubMed]
- 20.Adler LE, Waldo MC, Freedman R. Neurophysiologic studies of sensory gating in schizophrenia: comparison of auditory and visual responses. Biol Psychiatry 1985;20:1284-96. [DOI] [PubMed]
- 21.Mukundan CR. Middle latency components of evoked potential responses in schizophrenics. Biol Psychiatry 1986;21:1097-100. [DOI] [PubMed]
- 22.Grillon C, Ameli R, Braff DL. Middle latency auditory evoked potentials (MAEPs) in chronic schizophrenics. Schizophr Res 1991; 5:61-6. [DOI] [PubMed]
- 23.Roemer RA, Shagass C, Straumanis JJ, et al. Somatosensory and auditory evoked potential studies of functional differences between the cerebral hemispheres in psychosis. Biol Psychiatry 1979; 14: 357-73. [PubMed]
- 24.Huang MX, Edgar JC, Thoma RJ, et al. Predicting EEG responses using MEG sources in superior temporal gyrus reveals source asynchrony in patients with schizophrenia. Clin Neurophysiol 2003; 114: 835-50. [DOI] [PubMed]
- 25.Tian B, Reser D, Durham A, et al. Functional specialization in rhesus monkey auditory cortex. Science 2001;292:290-3. [DOI] [PubMed]
- 26.Romanski LM, Tian B, Fritz J, et al. Dual streams of auditory afferents target multiple domains in the primate prefrontal cortex. Nat Neurosci 1999;2:1131-6. [DOI] [PMC free article] [PubMed]
- 27.Rauschecker JP, Tian B. Mechanisms and streams for processing of “what” and “where” in auditory cortex. Proc Natl Acad Sci U S A 2000; 97:11800-6. [DOI] [PMC free article] [PubMed]
- 28.Recanzone GH. Spatial processing in the primate auditory cortex. Audiol Neurootol 2001;6:178-81. [DOI] [PubMed]
- 29.Arnott SR, Binns MA, Grady CL, et al. Assessing the auditory dual-pathway model in humans. Neuroimage 2004;22:401-8. [DOI] [PubMed]
- 30.Weeks RA, Aziz-Sultan A, Bushara KO, et al. A PET study of human auditory spatial processing. Neurosci Lett 1999;262:155-8. [DOI] [PubMed]
- 31.Clarke S, Bellmann A, Meuli RA, et al. Auditory agnosia and auditory spatial deficits following left hemispheric lesions: evidence for distinct processing pathways. Neuropsychologia 2000;38:797-807. [DOI] [PubMed]
- 32.Clarke S, Bellmann Thiran A, Maeder P, et al. What and where in human audition: selective deficits following focal hemispheric lesions. Exp Brain Res 2002;147:8-15. [DOI] [PubMed]
- 33.Zatorre RJ, Bouffard M, Ahad P, et al. Where is ‚where' in the human auditory cortex? Nat Neurosci 2002;5:905-9. [DOI] [PubMed]
- 34.Poremba A, Saunders RC, Crane AM, et al. Functional mapping of the primate auditory system. Science 2003;299:568-72. [DOI] [PubMed]
- 35.Doniger GM, Foxe JJ, Murray MM, et al. Impaired visual object recognition and dorsal/ventral stream interaction in schizophrenia. Arch Gen Psychiatry 2002;59:1011-20. [DOI] [PubMed]
- 36.Foxe JJ, Murray MM, Javitt DC. Filling-in in schizophrenia: a high-density electrical mapping and source-analysis investigation of illusory contour processing. Cereb Cortex 2005;15:1914-27. Epub 2005 Mar 16. [DOI] [PubMed]
- 37.Christensen BK, Bilder RM. Dual cytoarchitectonic trends: an evolutionary model of frontal lobe functioning and its application to psychopathology. Can J Psychiatry 2000;45:247-56. [DOI] [PubMed]
- 38.American Psychiatric Association. Diagnostic and statistical manual of mental disorders. 4th ed. Washington: The Association; 1994.
- 39.Oldfield RC. The assessment and analysis of handedness: The Edinburgh Inventory. Neuropsychologia 1971;9:97-113. [DOI] [PubMed]
- 40.First MB, Spitzer RL, Gibbon M, et al. Structured Clinical Interview for DSM-IV-TR Axis I Disorders. Research version, patient ed. New York: Biometrics Research, New York State Psychiatric Institute; 2002.
- 41.First MB, Frances AJ, Pincus HA, et al. DSM-IV in progress. Changes in substance-related, schizophrenic, and other primarily adult disorders. Hosp Community Psychiatry 1994;45:18-20. [DOI] [PubMed]
- 42.First MB, Spitzer RL, Gibbon M, et al. Structured Clinical Interview for DSM-IV-TR Axis I Disorders, Research version, non-patient ed. New York: Biometrics Research, New York State Psychiatric Institute; 2002.
- 43.Lindenmayer JP, Bernstein-Hyman R, Grochowski S. Five-factor model of schizophrenia. Initial validation. J Nerv Ment Dis 1994;182:631-8. [DOI] [PubMed]
- 44.Wetherill GB, Levitt H. Sequential estimation of points on a psychometric function. Br J Math Stat Psychol 1965;18:1-10. [DOI] [PubMed]
- 45.Scherg M, Von Cramon D. Two bilateral sources of the late AEP as identified by a spatio-temporal dipole model. Electroencephalogr Clin Neurophysiol 1985;62:32-44. [DOI] [PubMed]
- 46.Murray MM, Wylie GR, Higgins BA, et al. The spatiotemporal dynamics of illusory contour processing: combined high-density electrical mapping, source analysis, and functional magnetic resonance imaging. J Neurosci 2002;22:5055-73. [DOI] [PMC free article] [PubMed]
- 47.Dias EC, Foxe JJ, Javitt DC. Changing plans: a high density electrical mapping study of cortical control. Cereb Cortex 2003;13:701-15. [DOI] [PubMed]
- 48.Foxe JJ, McCourt ME, Javitt DC. Right hemisphere control of visuospatial attention: line-bisection judgments evaluated with high-density electrical mapping and source analysis. Neuroimage 2003; 19: 710-26. [DOI] [PubMed]
- 49.Yvert B, Crouzeix A, Bertrand O, et al. Multiple supratemporal sources of magnetic and electric auditory evoked middle latency components in humans. Cereb Cortex 2001;11:411-23. [DOI] [PubMed]
- 50.Yoshiura T, Ueno S, Iramina K, et al. Source localization of middle latency auditory evoked magnetic fields. Brain Res 1995;703:139-44. [DOI] [PubMed]
- 51.Farrell DE, Tripp JH, Norgren R, et al. A study of the auditory evoked magnetic field of the human brain. Electroencephalogr Clin Neurophysiol 1980;49:31-7. [DOI] [PubMed]
- 52.Reite M, Teale P, Zimmerman J, et al. Source origin of a 50-msec latency auditory evoked field component in young schizophrenic men. Biol Psychiatry 1988;24:495-506. [DOI] [PubMed]
- 53.Reite M, Teale P, Zimmerman J, et al. Source location of a 50 msec latency auditory evoked field component. Electroencephalogr Clin Neurophysiol 1988;70:490-8. [DOI] [PubMed]
- 54.Godey B, Schwartz D, de Graaf JB, et al. Neuromagnetic source localization of auditory evoked fields and intracerebral evoked potentials: a comparison of data in the same patients. Clin Neurophysiol 2001;112:1850-9. [DOI] [PubMed]
- 55.Michie PT. What has MMN revealed about the auditory system in schizophrenia? Int J Psychophysiol 2001;42:177-94. [DOI] [PubMed]
- 56.Valkonen-Korhonen M, Purhonen M, Tarkka IM, et al. Altered auditory processing in acutely psychotic never-medicated first-episode patients. Brain Res Cogn Brain Res 2003;17:747-58. [DOI] [PubMed]
- 57.Javitt DC, Jayachandra M, Lindsley RW, et al. Schizophrenia-like deficits in auditory P1 and N1 refractoriness induced by the psychomimetic agent phencyclidine (PCP). Clin Neurophysiol 2000; 111: 833-6. [DOI] [PubMed]
- 58.Pfefferbaum A, Horvath TB, Roth WT, et al. Auditory brain stem and cortical evoked potentials in schizophrenia. Biol Psychiatry 1980; 15:209-23. [PubMed]
- 59.Szelenberger W. Brain stem auditory evoked potentials and personality. Biol Psychiatry 1983;18:157-74. [PubMed]
- 60.Brecher M, Begleiter H. Brain stem auditory evoked potentials in unmedicated schizophrenic patients. Biol Psychiatry 1985;20:199-202. [DOI] [PubMed]
- 61.Harell M, Englender M, Demer M, et al. Auditory brain stem responses in schizophrenic patients. Laryngoscope 1986;96:908-10. [DOI] [PubMed]
- 62.Hayashida Y, Mitani Y, Hosomi H, et al. Auditory brain stem responses in relation to the clinical symptoms of schizophrenia. Biol Psychiatry 1986;21:177-88. [DOI] [PubMed]
- 63.Kimhi R, Englender M, Zohar M, et al. Brainstem auditory evoked responses in hospitalized unmedicated schizophrenic patients. Isr J Psychiatry Relat Sci 1987;24:289-94. [PubMed]
- 64.Lindstrom L, Klockhoff I, Svedberg A, et al. Abnormal auditory brain-stem responses in hallucinating schizophrenic patients. Br J Psychiatry 1987;151:9-14. [DOI] [PubMed]
- 65.Lindstrom LH, Wieselgren IM, Klockhoff I, et al. Relationship between abnormal brainstem auditory-evoked potentials and subnormal CSF levels of HVA and 5-HIAA in first-episode schizophrenic patients. Biol Psychiatry 1990;28:435-42. [DOI] [PubMed]
- 66.Grillon C, Ameli R, Glazer WM. Brainstem auditory-evoked potentials to different rates and intensities of stimulation in schizophrenics. Biol Psychiatry 1990;28:819-23. [DOI] [PubMed]
- 67.McKay CM, Headlam DM, Copolov DL. Central auditory processing in patients with auditory hallucinations. Am J Psychiatry 2000; 157: 759-66. [DOI] [PubMed]
- 68.Erwin RJ, Shtasel D, Gur RE. Effects of medication history on midlatency auditory evoked responses in schizophrenia. Schizophr Res 1994; 11:251-8. [DOI] [PubMed]
- 69.Clementz BA, Geyer MA, Braff DL. Poor P50 suppression among schizophrenia patients and their first-degree biological relatives. Am J Psychiatry 1998;155:1691-4. [DOI] [PubMed]
- 70.Nagamoto HT, Adler LE, Waldo MC, et al. Sensory gating in schizophrenics and normal controls: effects of changing stimulation interval. Biol Psychiatry 1989;25:549-61. [DOI] [PubMed]
- 71.Braff DL. Information processing and attention dysfunctions in schizophrenia. Schizophr Bull 1993;19:233-59. [DOI] [PubMed]
- 72.Clementz BA, Blumenfeld LD. Multichannel electroencephalographic assessment of auditory evoked response suppression in schizophrenia. Exp Brain Res 2001;139:377-90. [DOI] [PubMed]
- 73.Butler PD, Zemon V, Schechter I, et al. Early-stage visual processing and cortical amplification deficits in schizophrenia. Arch Gen Psychiatry 2005;62:495-504. [DOI] [PMC free article] [PubMed]
- 74.Ford JM, White PM, Csernansky JG, et al. ERPs in schizophrenia: effects of antipsychotic medication. Biol Psychiatry 1994;36:153-70. [DOI] [PubMed]
- 75.Roemer RA, Shagass C. Replication of an evoked potential study of lateralized hemispheric dysfunction in schizophrenics. Biol Psychiatry 1990;28:275-91. [DOI] [PubMed]
- 76.Rabinowicz EF, Silipo G, Goldman R, et al. Auditory sensory dysfunction in schizophrenia: imprecision or distractibility? Arch Gen Psychiatry 2000;57:1149-55. [DOI] [PubMed]
- 77.van Luijtelaar G. The effects of diazepam on sensory gating in healthy volunteers. Neurosci Lett 2003;341:65-8. [DOI] [PubMed]
- 78.Moxon KA, Gerhardt GA, Adler LE. Dopaminergic modulation of the P50 auditory-evoked potential in a computer model of the CA3 region of the hippocampus: its relationship to sensory gating in schizophrenia. Biol Cybern 2003;88:265-75. [DOI] [PubMed]
- 79.Kuriki S, Nogai T, Hirata Y. Cortical sources of middle latency responses of auditory evoked magnetic field. Hear Res 1995;92:47-51. [DOI] [PubMed]
- 80.Makela JP, Hamalainen M, Hari R, et al. Whole-head mapping of middle-latency auditory evoked magnetic fields. Electroencephalogr Clin Neurophysiol 1994;92:414-21. [DOI] [PubMed]
- 81.Hillebrand A, Barnes GR. A quantitative assessment of the sensitivity of whole-head MEG to activity in the adult human cortex. Neuroimage 2002;16:638-50. [DOI] [PubMed]
- 82.Okada Y. Neurogenesis of evoked magnetic fields. In: Williamson SJ, Romani GL, Kaufman, L, Modena I, editors. Biomagnetism: an interdisciplinary approach. New York: Plenum Press; 1993. p. 399-408.
- 83.Kaseda Y, Tobimatsu S, Morioka T, et al. Auditory middle-latency responses in patients with localized and non-localized lesions of the central nervous system. J Neurol 1991;238:427-32. [DOI] [PubMed]
- 84.Butler PD, Martinez A, Foxe JJ, et al. Subcortical visual dysfunction in schizophrenia drives secondary cortical impairments. Brain 2006; 130;417-30. Epub 2006 Sep 19. [DOI] [PMC free article] [PubMed]
- 85.Mishkin M, Lewis ME, Ungerleider LG. Equivalence of parieto-preoccipital subareas for visuospatial ability in monkeys. Behav Brain Res 1982;6:41-55. [DOI] [PubMed]
- 86.Molholm S, Sehatpour P, Mehta AD, et al. Audio-visual multisensory integration in superior parietal lobule revealed by human intracranial recordings. J Neurophysiol 2006;96:721-9. [DOI] [PubMed]
- 87.McGhie A, Chapman J. Disorders of attention and perception in early schizophrenia. Br J Med Psychol 1961;34:103-16. [DOI] [PubMed]
- 88.Balogh DW, Leventhal DB. The use of temporal and amplitude cues by schizophrenics, psychiatric controls, and aged normals in auditory lateralization. J Nerv Ment Dis 1982;170:553-60. [DOI] [PubMed]
- 89.de Gelder B, Vroomen J, Annen L, et al. Audio-visual integration in schizophrenia. Schizophr Res 2003;59:211-8. [DOI] [PubMed]
- 90.Mickey BJ, Dalack GW. Auditory gating in schizophrenia: a pilot study of the precedence effect. Schizophr Res 2005;73:327-31. [DOI] [PubMed]
- 91.Kraepelin E. Dementia praecox and paraphrenia [Translated and edited by Barclay RB]. Edinburgh (UK): E .S. Livingston; 1919.
- 92.Oades RD, Dittmann-Balcar A, Zerbin D, et al. Impaired attention-dependent augmentation of MMN in nonparanoid vs paranoid schizophrenic patients: a comparison with obsessive-compulsive disorder and healthy subjects. Biol Psychiatry 1997;41:1196-210. [DOI] [PubMed]
- 93.Javitt DC. Intracortical mechanisms of mismatch negativity dysfunction in schizophrenia. Audiol Neurootol 2000;5:207-15. [DOI] [PubMed]
- 94.Youn T, Park HJ, Kim JJ, et al. Altered hemispheric asymmetry and positive symptoms in schizophrenia: equivalent current dipole of auditory mismatch negativity. Schizophr Res 2003;59:253-60. [DOI] [PubMed]
- 95.Baldeweg T, Klugman A, Gruzelier J, et al. Mismatch negativity potentials and cognitive impairment in schizophrenia. Schizophr Res 2004;69:203-17. [DOI] [PubMed]
- 96.Leitman DI, Foxe JJ, Butler PD, et al. Do affective speech recognition deficits in schizophrenia have early cortical antecedents? Biol Psychiatry 2005.
- 97.Revheim N, Butler PD, Schechter I, et al. Reading impairment and visual processing deficits in schizophrenia. Schizophr Res 2006; 87:238-45. [DOI] [PMC free article] [PubMed]
- 98.Yeap S, Kelly SP, Sehatpour P, et al. Early visual sensory deficits as endophenotypes for schizophrenia: high-density electrical mapping in clinically unaffected first-degree relatives. Arch Gen Psychiatry 2006;63:1180-8. [DOI] [PubMed]