

Abstract
Increased expression of CD11b, the β-integrin marker of microglia, represents microglial activation during neurodegenerative inflammation. However, the molecular mechanism behind increased microglial CD11b expression is poorly understood. The present study was undertaken to explore the role of nitric oxide (NO) in the expression of CD11b in microglial cells. Bacterial lipopolysaccharide (LPS) induced the production of NO and increased the expression of CD11b in mouse BV-2 microglial cells and primary microglia. Either a scavenger of NO (PTIO) or an inhibitor of inducible nitric-oxide synthase (L-NIL) blocked this increase in microglial CD11b expression. Furthermore, co-microinjection of PTIO with LPS was also able to suppress LPS-mediated expression of CD11b and loss of dopaminergic neuronal fibers and neurotransmitters in striatum in vivo. Similarly, other inducers of NO production such as interferon-γ, interleukin-1β, human immunodeficiency virus type-1 gp120, and double-stranded RNA (poly(IC)) also increased the expression of CD11b in microglia through NO. The role of NO in the expression of CD11b was corroborated further by the expression of microglial CD11b by GSNO, an NO donor. Because NO transduces many intracellular signals via guanylate cyclase (GC), we investigated the role of GC, cyclic GMP (cGMP), and cGMP-activated protein kinase (PKG) in microglial expression of CD11b. Inhibition of LPS- and GSNO-mediated up-regulation of CD11b either by NS2028 (a specific inhibitor of GC) or by KT5823 and Rp-8-bromo-cGMP (specific inhibitors of PKG), and increase in CD11b expression either by 8-bromo-cGMP or by MY-5445 (a specific inhibitor of cGMP phosphodiesterase) alone suggest that NO increases microglial expression of CD11b via GC-cGMP-PKG. In addition, GSNO induced the activation of cAMP response element-binding protein (CREB) via PKG that was involved in the up-regulation of CD11b. This study illustrates a novel biological role of NO in regulating the expression of CD11b in microglia through GC-cGMP-PKG-CREB pathway that may participate in the pathogenesis of devastating neurodegenerative disorders.
Microglia are considered as CNS2 resident professional macrophages that function as the principal immune effector cells of the CNS responding to any pathological event. Activation of microglia has been implicated in the pathogenesis of a variety of neurodegenerative diseases, including Alzheimer disease, Parkinson disease, Creutzfeld-Jacob disease, HIV-associated dementia, stroke, and multiple sclerosis (1). It has been found that activated microglia accumulate at sites of injury or plaques in neurodegenerative CNS (1–6). Although activated microglia scavenge dead cells from the CNS and secrete different neurotrophic factors for neuronal survival (1, 5, 6), it is believed that severe activation causes various autoimmune responses leading to neuronal death and brain injury (1–6). During severe activation microglia not only secrete various neurotoxic molecules but also express different proteins and surface markers. Among different surface markers, CD11b is the most potential one with immense biological significance (6, 7). It acts as a binding protein for intracellular cell adhesion molecule-1 and complement C3bi (8). It is reported that in various neuroinflammatory diseases, the increased Cd11b expression corresponds to the severity of microglial activation (1, 6, 7). Morphologically, microglial activation is associated with intense ramification and cytoskeletal rearrangement in which changes in shape and motility correlate with increased expression of CD11b (1, 6, 7). During this activation process, the cytoplasmic domain of CD11b is believed to interact increasingly with cytoskeletal protein (1). However, the mechanism by which microglial expression of CD11b is increased in neurodegenerative CNS remains unclear.
Because activated microglia also express inducible nitric-oxide synthase (iNOS) to produce an excessive amount of NO, a molecule implicated virtually in all reported neurodegenerative and neuroinflammatory conditions (9, 10), we were prompted to investigate whether NO plays a role in the microglial expression of CD11b. Here we report that NO is instrumental in increasing the expression of CD11b in microglia. Different inducers of NO production such as LPS, IFN-γ, IL-1β, HIV-1 gp120, and poly(IC) stimulated microglial expression of CD11b via NO. Furthermore, we also demonstrate that NO employed the guanylate cyclase (GC)–cGMP–cGMP-activated protein kinase (PKG)–cAMP response element-binding protein (CREB) pathway to up-regulate the expression of CD11b in microglia.
Materials and Methods
Reagents
Fetal bovine serum and Dulbecco's modified Eagle's medium/F-12 were from Mediatech Inc. LPS (Escherichia coli), actinomycin D, and poly(IC) were purchased from Sigma. HIV-1 coat protein gp120 was obtained from US Biological. L-N6-(1-Iminoethyl)-lysine (L-NIL), NS-2028 (an inhibitor of guanylate cyclase), 8-Br-cGMP, MY-5445 (an inhibitor of cGMP phosphodiesterase), and KT5823 (an inhibitor of PKG) were obtained from Biomol. Recombinant mouse IFN-γ and IL-1β were obtained from R&D.
Isolation of Mouse Microglia
Microglial cells were isolated from mixed glial cultures according to the procedure of Giulian and Baker (11). Briefly, on day 7–9 the mixed glial cultures were washed three times with Dulbecco's modified Eagle's medium/F-12 and subjected to shaking at 240 rpm for 2 h at 37 °C on a rotary shaker. The floating cells were washed and seeded on to plastic tissue culture flasks and incubated at 37 °C for 2 h. The attached cells were removed by trypsinization and seeded onto new plates for further studies. Ninety to ninety-five percent of this preparation was found to be positive for Mac-1 surface antigen. Mouse BV-2 microglial cells (kind gift from Virginia Bocchini of University of Perugia) were also maintained and induced as indicated above.
Assay for NO Synthesis
Synthesis of NO was determined by assay of culture supernatants for nitrite, a stable reaction product of NO with molecular oxygen, using Griess reagent as described (12, 13).
Flow Cytometry
Surface expression of CD11b on BV-2 microglial cells was checked by flow cytometry as described earlier (14, 15). Briefly, 1 × 10 6 cells suspended in RPMI 1640-fetal bovine serum were incubated in the dark with appropriately diluted fluorescein isothiocyanate-labeled antibodies to CD11b (Mac-1 Integrin) (BD Pharmingen) at 4 °C for 30 min. Following incubation, cell suspension was centrifuged, washed thrice, and resuspended in 500 μl of RPMI-fetal bovine serum. The cells were then analyzed through FACS (Becton Dickinson). A minimum of 10,000 cells was accepted for FACS analysis. Cells were gated based on morphological characteristics. Apoptotic and necrotic cells were not accepted for FACS analysis.
Immunofluorescence Analysis
It was performed as described earlier (16). Briefly, cover slips containing 100–200 cells/mm2 were fixed with 4% paraformaldehyde for 20 min followed by treatment with cold ethanol (−20 °C) for 5 min and two rinses in phosphate-buffered saline. Samples were blocked with 3% bovine serum albumin in phosphate-buffered saline-Tween-20 (PBST) for 30 min and incubated in PBST containing 1% bovine serum albumin and rabbit anti-CD11b (1:50). After three washes in PBST (15 min each), slides were further incubated with Cy2 (Jackson ImmunoResearch Laboratories, Inc.). For negative controls, a set of culture slides was incubated under similar conditions without the primary antibodies. The samples were mounted and observed under a Bio-Rad MRC1024ES confocal laser-scanning microscope.
Microinjection of LPS into the Striatum of C57BL/6 Mice
Male C57BL/6 mice (8–10-week old) were anesthetized with ketamine and xylazine and underwent cerebellar operations in a Kopf small animal stereotaxic instrument (David Kopf, CA). Briefly, the animal was mounted in a stereotaxic frame on a heating blanket. Body temperature was maintained at 37 ± 0.5 °C during the time of surgery. A midsagittal incision was made to expose the cranium and a hole <0.5 mm in diameter was drilled with a dental drill over the cerebrum according to the following coordinates: 5 mm anterior to lambda, lateral (L) 2.2 mm, ventral (V) 3.5 (as shown in Fig. 6A). Four micrograms of LPS in the presence or absence of L-NIL (10 μg) and PTIO (10 μg) dissolved in 3 μl of saline was injected using a 5-μl syringe (Hamilton, Reno, Nevada) over a period of 2 min, and the needle was held in place for another minute before withdrawing it from the skull to prevent reflux up the needle tract. Similarly control mice received 3 μl of saline. The incision was closed with surgical staples and covered with a mixture of bacitracin and Hurricane (20% benzocaine).
FIGURE 6. Effect of PTIO on LPS-induced loss of TH-positive fibers in vivo in the striatum.

Four micrograms of LPS in the presence or absence of PTIO (10 μg) dissolved in 3 μl of saline was stereotaxically injected into striatum of C57/BL6 mice. After 5 days of microinjection, TH immunostaining (A) and optical density of TH+ fibers (B) were performed as described under “Materials and Methods.” Results are mean ± S.D. of five different mice. a, p < 0.001 versus saline control; b, p < 0.001 versus LPS.
Tyrosine Hydroxylase Immunostaining
Five days after microinjection, mice were perfused with 4% paraformaldehyde, and their brains were processed for immunohistochemical studies. Sections (10 μm) were incubated with a polyclonal anti-tyrosine hydroxylase (TH, 1,000 dilution, Calbiochem) for 24 h at 4 °C. Biotinylated secondary antibodies followed by avidin-biotin complex were used. Immunoreactivity was visualized by Vectastatin Elite ABC kit (Vector Laboratories, Inc.). Striatal optical density of TH immunostaining, measured by SpotDenso Analysis Tools in Fluorochem 8800 Imaging System, was used as an index of striatal density of TH innervation.
Measurement of Dopamine and Its Metabolite Levels in Striatal Tissues
After 5 days of microinjection, mice were sacrificed, and their striata were dissected out and stored at −80 °C until analysis. On the day of the assay, striatal tissues were sonicated in 0.2 M perchloric acid (0.5 ml/100 mg of tissue) containing isoproterenol (100 ng/100 mg of tissue) as internal standard. After centrifugation at 20,000 × g for 15 min at 4 °C, the pH of supernatants was adjusted to pH 3.0 with 1 M sodium acetate. After filtration, 10 μl of supernatant was injected onto a Eicompak SC-3ODS column (Complete Stand-Alone HPLC-ECD System EiCOMHTEC-500 from JM Science Inc., Grand Island, NY) and analyzed for dopamine, dihydroxyphenylacetic acid, and homovanillic acid following manufacturer's protocol. Briefly, the mobile phase consisted of 20% methanol and 80% 0.1 M citrate-acetate buffer (pH 3.5) with 220 mg/l sodium octane sulfate and 5 mg/l disodium EDTA. The flow rate was maintained at 340–400 μl/min.
Semiquantitative RT-PCR Analysis
Total RNA was isolated from BV-2 microglial cells, primary microglia, or striatal tissues surrounding the point of microinjection using Ultraspec-II RNA reagent (Biotecx Laboratories, Inc.) following manufacturer's protocol. To remove any contaminating genomic DNA, total RNA was digested with DNase. Semiquantitative RT-PCR was carried out as described earlier (17) using a RT-PCR kit from Clontech. Briefly, 1 μg of total RNA was reverse-transcribed using oligo(dT)12–18 as primer and MMLV reverse transcriptase (Clontech) in a 20-μl reaction mixture. The resulting cDNA was appropriately diluted, and diluted cDNA was amplified using titanium TaqDNA polymerase and the following primers. Amplified products were electrophoresed on a 1.8% agarose gel and visualized by ethidium bromide staining: CD11b, sense: 5′-CAGATCAACAATGT-GACCGTATGGG-3′, antisense: 5′-CATCATGTCCTTGTACTGC-CGCTTG-3′; IL-1β, sense: 5′-CTCCATGAGCTTTGTACAAGG-3′, antisense: 5′-TGCTGATGTACCAGTTGGGG-3′; glyceraldehyde-3-phosphate dehydrogenase, sense: 5′-GGTGAAGGTCGGTGT-GAACG-3′, antisense: 5′-TTGGCTCCACCCTTCAAGTG-3′. The relative expression of either CD11b or IL-1β (CD11b or IL-1β/glyceraldehyde-3-phosphate dehydrogenase) was measured after scanning the bands with a Fluor Chem 8800 Imaging System (Alpha Innotech Corporation).
Real Time PCR analysis for CD11b mRNA
It was performed using the ABI-Prism7700 sequence detection system (Applied Biosystems) as described earlier (17). Briefly, reactions were performed in 96-well optical reaction plates on cDNA equivalent to 50 ng of DNase-digested RNA in a volume of 25 μl, containing 12.5 μl of TaqMan Universal Master mix and optimized concentrations of carboxyfluorescein-labeled probe, forward and reverse primers, following manufacturer's protocol. All primers and FAM-labeled probes for mouse CD11b and glyceraldehyde-3-phosphate dehydrogenase were obtained from Applied Biosystems. The mRNA expression of CD11b was normalized to the level of glyceraldehyde-3-phosphate dehydrogenase mRNA. Data were processed by the ABI Sequence Detection System 1.6 software and analyzed by analysis of variance.
Electrophoretic Mobility Shift Assay
Nuclear extract preparation and electrophoretic mobility shift assay was performed as described previously with some modifications (15, 18). Briefly, oligonucleotides containing the consensus binding sequence for CREB (5′-AGAGAT-TGCCTGACGTCAGAGAGCTAG-3′) (Promega) was radiolabeled with [γ-32P]ATP using polynucleotide T4 kinase. Labeled probe was purified with chroma spin column (BD Biosciences). Six-micrograms of nuclear extract was incubated with binding buffer and nonspecific oligonucleotides for 15 min in ice prior to incubation with labeled probe for another 15 min. Subsequently, samples were separated on a 6% polyacrylamide gel in 0.25× TBE buffer (Tris borate-EDTA), which were then dried and exposed to generate autoradiograms.
Results
Bacterial LPS Increases the Expression of CD11b in Mouse BV-2 Microglial Cells via NO
Microglia express CD11b, however, during microglial activation the expression of CD11b is markedly increased. Because microglial activation is also associated with the production of NO, we investigated the role of NO in microglial expression of CD11b. Mouse BV-2 microglial cells were stimulated with different concentrations of LPS, the prototype inducer of different immune cells including CNS microglia (18, 19). It is clear from Fig. 1A that LPS dose dependently increased the expression of CD11b in BV-2 cells with maximum increase observed at 0.75 or 1.0 μg/ml of LPS. An assay of nitrite in culture supernatants shows that the increase in CD11b expression was associated with the production of NO (Fig. 1B). Next during a time-dependent analysis of LPS-mediated up-regulation of CD11b expression, we observed that LPS was unable to increase the mRNA expression of CD11b within 6 h of stimulation (Fig. 1C). However, the increase in CD11b expression was visible at 12 h with the maximum up-regulation observed at 24 h of stimulation (Fig. 1C). When we measured the time-dependent production of nitrite in response to LPS, we observed that the induction of NO production began at 12 h and reached the maximum at 24 h (Fig. 1D). In fact, the expression of CD11b paralleled to the production of NO suggesting a possible involvement of NO in the increase in CD11b expression.
FIGURE 1. Role of NO in LPS-mediated up-regulation of CD11b expression in mouse BV-2 microglial cells.

Cells were stimulated with different concentrations of LPS under serum-free condition. After 24 h of stimulation, the expression of CD11b was analyzed in cells by semiquantitative RT-PCR (A) and concentration of nitrite was measured in supernatants (B) by Griess reagent as described under “Materials and Methods.” Next cells were stimulated with 0.75 μg/ml of LPS under serum-free condition for different time periods followed by analysis of CD11b and IL-1β mRNA expression in cells (C) and assay of nitrite (D) in supernatants. Cells were stimulated with 10 ng/ml of IL-1β for different time periods followed by analysis of CD11b mRNA expression by RT-PCR (E). Cells preincubated with different concentrations of L-NIL (F) and PTIO (G) for 1 h were stimulated with 0.75 μg/ml of LPS. After 24 h of stimulation, the expression of CD11b mRNA was analyzed in cells by semiquantitative RT-PCR. Quantitative real time PCR (H) was also employed to further clarify the mRNA expression of CD11b. Results are mean ± S.D. of three different experiments. a, p < 0.001 versus LPS. GAPDH, glyceraldehyde-3-phosphate dehydrogenase.
We then compared the expression pattern of another inducible gene in microglia. In contrast to the expression pattern of CD11b, marked induction of IL-1β mRNA was observed within 6 h of stimulation with LPS (Fig. 1C). Because the expression of IL-1β was observed before the increase in CD11b expression, we also investigated whether IL-1β was playing a role in LPS-induced expression of CD11b. The time course of IL-1β-induced CD11b expression shows that IL-1β was unable to stimulate the expression of CD11b within 12 h of stimulation (Fig. 1E). However, at 24 h of stimulation, the up-regulation of CD11b was clearly visible (Fig. 1E) suggesting that IL-1β may not be involved in LPS-induced expression of CD11b.
Therefore, to investigate the role of NO in LPS-mediated up-regulation of CD11b, we examined the effect of L-NIL (an inhibitor of NOS) and carboxyl PTIO (a scavenger of NO) on the LPS-mediated increase in CD11b mRNA expression in BV-2 glial cells. It is clearly evident from semiquantitative RT-PCR analysis that both L-NIL and PTIO markedly inhibited LPS-mediated expression of CD11b (Fig. 1, F and G). Quantitative real time PCR analysis also reveals a marked inhibition of LPS-mediated expression of CD11b mRNA by L-NIL and PTIO (Fig. 1H). Next we investigated the effect of L-NIL and PTIO on the expression of CD11b protein in LPS-stimulated cells. Because CD11b is a surface protein, we analyzed its expression by FACS using FITC-labeled antibodies against CD11b. Fig. 2A represents auto-fluorescence, as this was observed in unconjugated normal BV-2 glial cells. As areas under M1 and M2 in Fig. 2 A–E, represent auto-fluorescence and fluorescence, respectively, because of CD11b there was some expression of CD11b on the surface of normal BV-2 glial cells (Fig. 2B) in contrast to marked increase in CD11b expression on the surface of LPS-stimulated cells (Fig. 2C). Consistent to the inhibition of CD11b mRNA expression, both L-NIL and PTIO markedly inhibited LPS-mediated stimulation of CD11b protein expression (Fig. 2, D and E). Immunofluorescence analysis of CD11b in BV-2 microglial cells also shows that LPS stimulation increased the expression of CD11b and that L-NIL and PTIO attenuated LPS-mediated CD11b expression (Fig. 2F). Taken together, these studies suggest that LPS up-regulates the expression of CD11b in BV-2 microglial cells via NO.
FIGURE 2. Effect of L-NIL and PTIO on LPS-mediated up-regulation of CD11b protein expression in mouse BV-2 microglial cells.
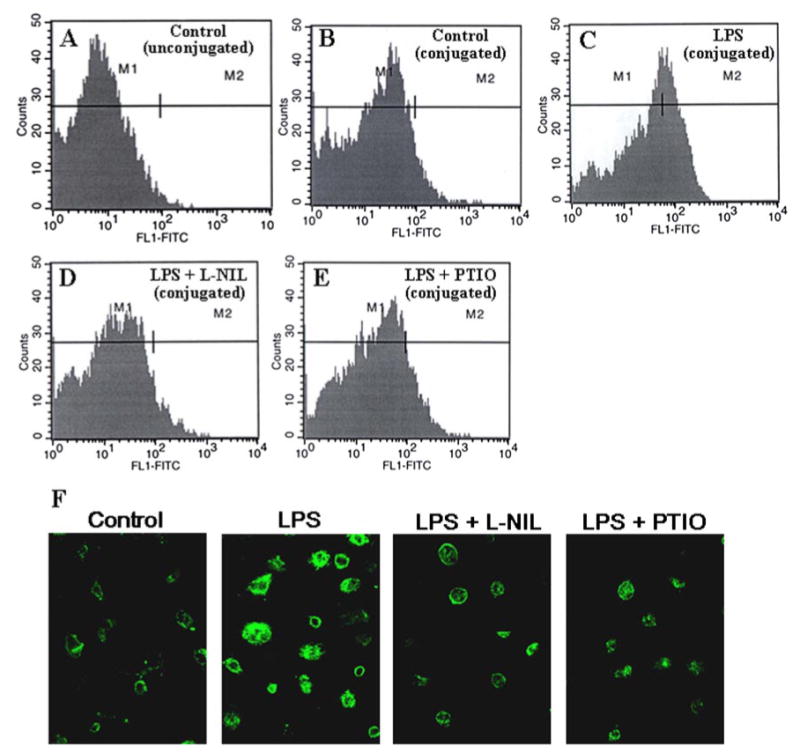
Cells preincubated with L-NIL (75 μM) and PTIO (75 μM) for 1 h were stimulated with 0.75 μg/ml of LPS. After 24 h of stimulation, cells were also analyzed for surface expression of CD11b protein by FACS (A, unconjugated control; B, conjugated control; C, LPS; D, LPS + L-NIL; E, LPS + PTIO). F, cells were also immunostained with CD11b as described under “Materials and Methods.”
LPS Increases the Expression of CD11b in Mouse Primary Microglia via NO
To understand whether NO is required for the increase in CD11b expression by LPS in primary cells, we examined the effect of L-NIL and PTIO on LPS-mediated expression of CD11b in mouse primary microglia (Fig. 3). Consistent with the induction of NO production and increase in CD11b mRNA expression in BV-2 microglial cells, LPS induced the production of NO (Fig. 3A) and increased the expression of CD11b mRNA as revealed by semiquantitative RT-PCR (Fig. 3B) and quantitative real time PCR analyses (Fig. 3C) in mouse primary microglia. However, either blocking the production of NO by L-NIL or scavenging NO by PTIO (Fig. 3A) markedly suppressed LPS-mediated stimulation of CD11b mRNA expression (Fig. 3, B and C) in primary microglia. Apart from CD11b, microglia express many other surface markers such as, CD18, CD11a, CD11c, etc. In addition, CD11b pairs with CD18 to exhibit functional activity, therefore, we wondered whether NO was also regulating the expression of other surface markers including CD18. In mouse primary microglia, LPS increased the expression of CD18, CD11a, and CD11c compared with control (Fig. 3D). Interestingly, similar to the regulation of CD11b, both L-NIL and PTIO suppressed the LPS-mediated increase in CD18, CD11c, and CD11a expression in primary microglia (Fig. 3D) suggesting that NO is capable of regulating the expression of various surface markers of microglia associated with its activation.
FIGURE 3. Effect of L-NIL and PTIO on LPS-mediated increase in CD11b and other surface marker expression in mouse primary microglia.

Cells preincubated with L-NIL (75 μM) and PTIO (75 μM) for 1 h were stimulated with 0.75 μg/ml of LPS. After 24 h of stimulation, the production of nitrite was assayed in supernatants (A), and the expression of CD11b mRNA was analyzed in cells by semiquantitative RT-PCR (B) and quantitative real time PCR (C). Results are mean ± S.D. of three different experiments. a, p < 0.001 versus LPS. D, the expression of CD18, CD11c, and CD11a was also analyzed by semiquantitative RT-PCR.
Involvement of NO in Proinflammatory Cytokine-, Double-stranded RNA- and HIV-1 gp120-mediated Increase in CD11b Expression in BV-2 Microglial Cells
Microglia are activated under various pathological conditions, such as inflammation, viral infection, etc. (1, 20, 21). Because LPS increased the expression of CD11b in microglia through NO, we investigated whether other inducers of microglial activation also increase CD11b expression via NO. Therefore, BV-2 microglial cells were stimulated with proinflammatory cytokines (IL-1β and IFN-γ), HIV-1 coat protein gp120 (22), and double-stranded RNA in the form of polyinosinic-polycytidilic acid (poly(IC)) (23) in the presence or absence of L-NIL and PTIO. All four stimuli (IFN-γ, IL-1β, gp120, and poly(IC)) induced the production of NO and increased the expression of CD11b in BV-2 microglial cells (Fig. 4). Similar to the inhibition of LPS-mediated expression of CD11b, either blocking the production of NO by L-NIL or scavenging NO by PTIO knocked down IFN-γ-, IL-1β-, gp120-, and poly(IC)-mediated increase in CD11b mRNA expression (Fig. 4, A–D) suggesting that different neuroinflammatory and neurodegenerative stimuli also up-regulate the expression of CD11b in microglia via NO.
FIGURE 4. Effect of L-NIL and PTIO on IFN-γ-, IL-1β-, HIV-1 gp120-, and poly(IC)-mediated increase in CD11b expression in mouse BV-2 microglial cells.
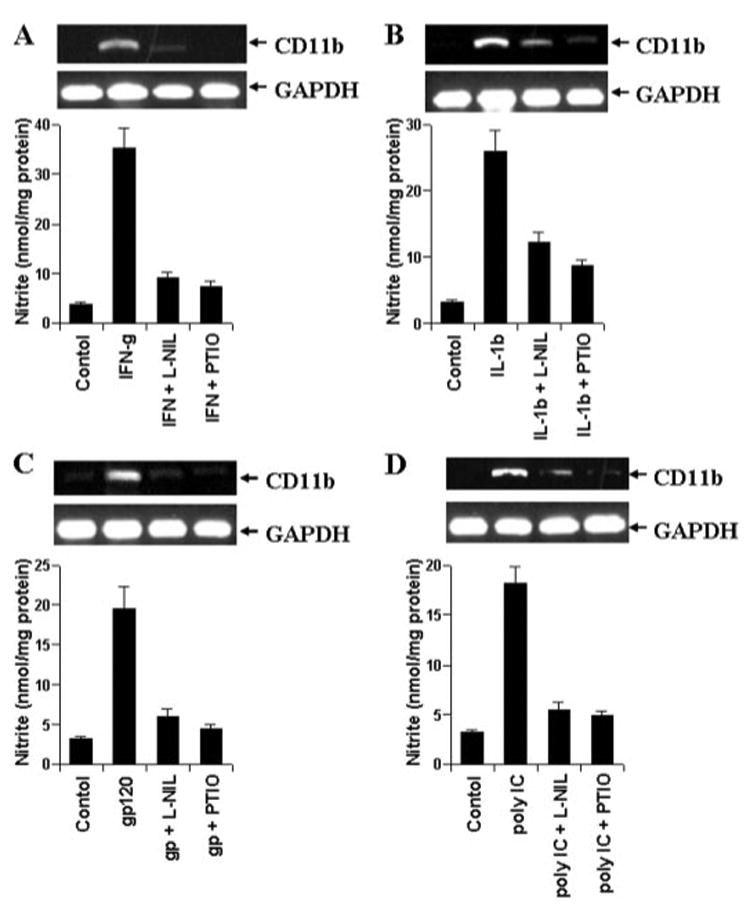
Cells preincubated with L-NIL (75 μM) and PTIO (75 μM) for 1 h were stimulated with 6.25 units/ml of IFN-γ (A), 10 ng/ml of IL-1β (B), 200 pg/ml of gp120 (C), or 100 μg/ml of poly(IC) (D). After 24 h of stimulation, the expression of CD11b mRNA was analyzed in cells by semiquantitative RT-PCR, and the concentration of nitrite was measured in supernatants. Results are mean ± S.D. of three different experiments. GAPDH, glyceraldehyde-3-phosphate dehydrogenase.
LPS-mediated Increase in CD11b Expression in Vivo in the Striatum Depends on NO
Using various approaches, the studies presented above have shown that different neurotoxins increase the expression of CD11b in microglial cells or cultured primary microglia via NO. However, these studies do not indicate whether NO may have the capacity to influence the expression of CD11b in vivo in the CNS. It is increasingly becoming clear that microglial activation plays an important role in the loss of dopaminergic neurons in striatum and nigra of patients with Parkinson disease (3–5). Therefore, we were prompted to investigate whether NO is also involved in the up-regulation of CD11b expression in vivo in the striatum. As expected, the microinjection of LPS but not saline into the striatum of 8–10-week-old male C57BL/6 mice induced the expression of iNOS (Fig. 5B) and CD11b (C and D). Next to analyze the role of NO in LPS-mediated expression of CD11b, PTIO was microinjected together with LPS. As revealed by semiquantitative RT-PCR (Fig. 5C) and quantitative real time PCR (Fig. 5D), PTIO knocked down LPS-mediated increase in CD11b expression in vivo in the striatum (Fig. 5C and D). This has been further supported by immunofluorescence analysis. Increased number of CD11b+ microglia was observed in LPS-microinjected brain sections compared with that in saline-microinjected sections (Fig. 5E). However, co-microinjection of PTIO markedly inhibited LPS-mediated increase in CD11b+ microglia (Fig. 5E) suggesting the requirement of NO in LPS-induced microgliosis in vivo in the brain.
FIGURE 5. Effect of PTIO on LPS-mediated up-regulation of CD11b expression in vivo in mouse striatum.

Four micrograms of LPS in the presence or absence of PTIO (10 μg) dissolved in 3 μl of saline was stereotaxically injected into striatum (A) of C57/ BL6 mice. After 24 h of microinjection, the expression of iNOS protein was examined by immunofluorescence analysis (B) and the expression of CD11b mRNA was analyzed by semiquantitative RT-PCR (C) and quantitative real time PCR (D). Results are mean ± S.D. of three different experiments. a, p < 0.001 versus LPS. Brain sections were also immunostained for the expression of CD11b protein (E). GAPDH, glyceraldehyde-3-phosphate dehydrogenase.
LPS-mediated Loss of Dopaminergic Neuronal Fibers and Neurotransmitters in Vivo in the Striatum also Depends on NO
Because NO is involved in microglial expression of CD11b, and microglial activation plays an important role in the loss of dopaminergic neurons in midbrain (3–5), we investigated whether mitigation of microglial activation by PTIO had any effect on the integrity of striatal dopaminergic fibers in LPS-intoxicated striatum. We stained fibers of dopaminergic neurons in striatum by TH immunoreactivity. As evident from Fig. 6, A and B, TH+ neuronal fibers are present in saline-microinjected striatum. However, microinjection of LPS caused marked loss of TH+ fibers in striatum (Fig. 7, A and B). On the other hand, PTIO exhibited almost complete protection against LPS-mediated loss of TH+ fibers in striatum (Fig. 6, A and B) suggesting the possible involvement of NO in inflammation-coupled striatal loss of TH-containing fibers. To further corroborate these results, we measured the levels of dopamine and its metabolites, dihydroxyphenylacetic acid and homovanillic acid, in vivo in the striatum as a functional index of dopaminergic system. In LPS-microinjected mice that did not receive any PTIO, there was marked reduction of dopamine and dihydroxyphenylacetic acid but not homovanillic acid compared with vehicle control (Table 1). However, in LPS-microinjected mice that did receive PTIO, the levels of dopamine and dihydroxyphenylacetic acid were all significantly higher than those in LPS-microinjected mice that did not receive PTIO (Table 1). Taken together, these results suggest that the attenuation of NO production in vivo in the striatum is capable of protecting LPS-mediated loss of TH+ fibers and neurotransmitter levels probably by reducing microglial activation.
FIGURE 7. GSNO increases the expression of CD11b in mouse BV-2 microglial cells.

Cells were stimulated with different concentrations of GSNO under serum-free condition. After 24 h of stimulation, the expression of CD11b was analyzed in cells by semiquantitative RT-PCR (A) and quantitative real time PCR (B). Results are mean ± S.D. of three different experiments. a, p < 0.001 versus control. C, cells were stimulated with 200 μM GSNO for different time periods followed by analysis of CD11b mRNA expression. D, cells preincubated with different concentrations of actinomycin D for 15 min were stimulated with 200 μM GSNO. After 1 h of stimulation, the expression of CD11b mRNA was analyzed by semiquantitative RT-PCR. GAPDH, glyceraldehyde-3-phosphate dehydrogenase.
TABLE 1. Levels of dopamine and its metabolites in striatal tissues.
Five days after microinjection, mice were sacrificed, and the levels of dopamine (DA), dihydroxyphenylacetic acid (DOPAC), and homovanillic acid (HVA) were measured in striatum as described under “Materials and Methods.” Data represents mean ± S.D. of 6 mice/group.
| Treatments | Amount (ng/mg of tissue) | ||
|---|---|---|---|
| DA | DOPAC | HVA | |
| Control/vehicle | 11.2 ± 2.3 | 0.82 ± 0.15 | 1.2 ± 0.07 |
| LPS | 5.7 ± 0.8 | 0.45 ± 0.07 | 1.02 ± 0.16 |
| LPS + L-NIL | 12.8 ± 1.6a | 0.76 ± 0.09a | 1.12 ± 0.09 |
| LPS + PTIO | 18.9 ± 2.7a | 1.05 ± 0.11a | 1.32 ± 0.15 |
p < 0.001 compared with the LPS-treated group without L-NIL and PTIO.
S-Nitrosoglutathione (GSNO) Alone Increases the Expression of CD11b in BV-2 Microglial Cells
Because LPS and other inducers of iNOS increased the expression of CD11b via NO, next we investigated whether NO alone was capable of increasing the expression of CD11b in microglia. Therefore, we examined the effect of GSNO, a NO donor, on CD11b expression in BV-2 microglial cells. As evident from semiquantitative RT-PCR analysis (Fig. 7A) and quantitative real time PCR analysis (Fig. 7B), GSNO alone dose dependently increased the expression of CD11b mRNA with maximum increase observed at 200 or 500 μM. These results suggest that NO alone is sufficient to increase the expression of CD11b in microglia. Because we are considering NO as a possible mediator of LPS-induced increased expression of CD11b, we performed a time-course experiment for GSNO-mediated increase in CD11b expression. Although LPS-mediated up-regulation of CD11b was visible after 12 or 18 h of stimulation (Fig. 1C), GSNO was capable of increasing the expression of CD11b within 60 min of stimulation (Fig. 7C) suggesting that NO functions downstream to LPS in regulating the expression of CD11b in microglia. Next we investigated the possibility of whether NO regulates the expression of CD11b at the level of transcription or post-transcription. Inhibition of GSNO-mediated increase in CD11b expression by actinomycin D (an inhibitor of RNA synthesis) (Fig. 7D) suggests that NO-mediated up-regulation of CD11b is possibly a transcriptional event.
Involvement of GC in LPS- and GSNO-mediated Increase in CD11b Expression in Microglia
Next we investigated mechanisms by which NO may up-regulate the expression of CD11b in microglia. Because GC is intimately coupled to NO-induced downstream signaling events (24, 25), we attempted to explore the role of GC in LPS- and GSNO-mediated increase in CD11b expression in microglial cells. We examined the effect of NS-2028, a very specific inhibitor of GC (26), on LPS- and GSNO-mediated expression of CD11b in BV-2 microglial cells. As evident from semiquantitative RT-PCR analyses (Fig. 8, A and C) and real time PCR analysis (B and D), NS-2028 markedly inhibited LPS- as well as GSNO-mediated increase in CD11b expression suggesting that NO itself and inducers of NO increase the expression of CD11b via GC.
FIGURE 8. Effect of NS-2028 on LPS- and GSNO-mediated increase in CD11b expression in mouse BV-2 microglial cells.
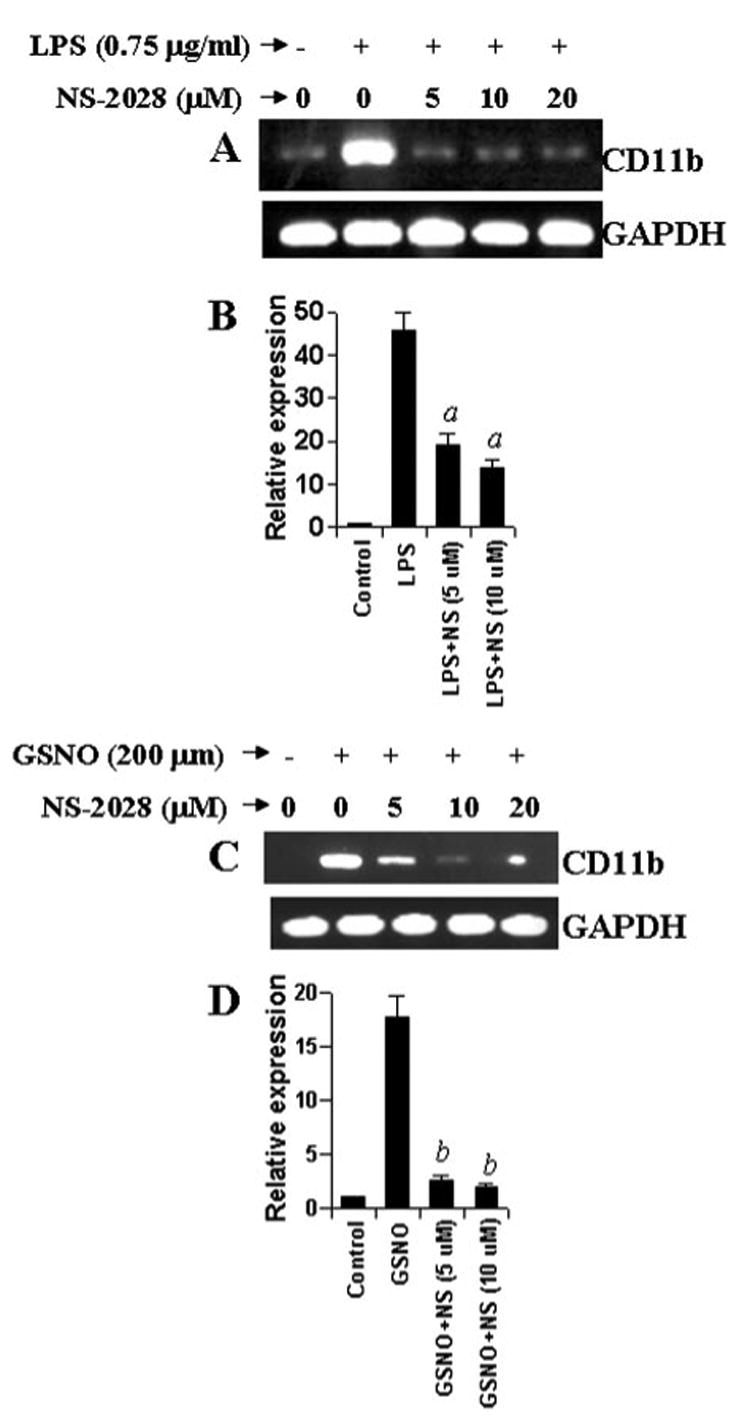
Cells preincubated with different concentrations of NS-2028 for 1 h were stimulated with either 0.75 μg/ml LPS (A and B) or 200 μM GSNO (C and D) under serum-free conditions. After 24 h of stimulation, the expression of CD11b was analyzed in cells by semiquantitative RT-PCR (A and C) and quantitative real time PCR (B and D). Results are mean ±S.D. of three different experiments. a, p < 0.001 versus LPS. b, p < 0.001 versus GSNO. GAPDH, glyceraldehyde-3-phosphate dehydrogenase.
Does cGMP Alone Increase the Expression of CD11b in Microglia?
Because GC catalyzes the formation of cGMP from GTP, we investigated whether cGMP alone is sufficient to increase the expression of CD11b in microglial cells. The level of cGMP in a cell could be increased by either a cell-permeable cGMP derivative (8-Br-cGMP) or an inhibitor of cGMP phosphodiesterase (MY5445). Interestingly, 8-Br-cGMP alone increased the expression of CD11b with the maximum increase observed at 100 or 200 μM 8-Br-cGMP (Fig. 9A). Time-course experiment showed that 8-Br-cGMP was capable of increasing the expression of CD11b within 60 min of stimulation (Fig. 9B). Next the effect of MY5445 on the expression of CD11b was tested in BV-2 microglial cells. As expected, MY5445 alone also markedly increased the expression of CD11b (Fig. 9C). These results suggest that LPS increases microglial expression of CD11b via NO-GC-cGMP pathway.
FIGURE 9. 8-Br-cGMP and MY-5445 increase the expression of CD11b in mouse BV-2 microglial cells.

A, cells were stimulated with different concentrations of 8-Br-cGMP and after 24 h, the expression of CD11b was analyzed by semiquantitative RT-PCR. B, cells were stimulated with 100 μM 8-Br-cGMP for different time periods followed by analysis of CD11b mRNA expression. C, cells were stimulated with different concentrations of MY-5445 for 24 h followed by analysis of CD11b mRNA expression. GAPDH, glyceraldehyde-3-phosphate dehydrogenase.
Role of PKG in LPS- and GSNO-mediated Up-regulation of CD11b mRNA Expression in Microglia
Because cGMP transduces many of its downstream signaling pathways via PKG (27), we were prompted to investigate whether PKG was involved in LPS- and NO-mediated increase in CD11b expression in microglia. It is clearly evident from Fig. 10, A and B that KT5823, a specific cell-permeable inhibitor of PKG (28), dose dependently attenuated LPS-mediated up-regulation of CD11b mRNA with maximum inhibition observed at 25 or 50 μM. Similarly, semiquantitative RT-PCR (Fig. 10C) and quantitative real time PCR (Fig. 10D) analyses also reveal marked inhibition of GSNO-mediated expression of CD11b mRNA by KT5823 in BV-2 microglial cells. To confirm the involvement of PKG further, we examined the effect of Rp-8-Br-cGMP (another specific inhibitor of PKG) on NO-mediated increase in CD11b expression. As evident from Fig. 10E, Rp-8-Br-cGMP strongly inhibited GSNO-mediated increase in CD11b expression. These results suggest that LPS increases microglial expression of CD11b via NO-GC-cGMP-PKG pathway.
FIGURE 10. Effect of inhibitors of protein kinase G on NO-mediated increase in CD11b expression in mouse BV-2 microglial cells.

Cells preincubated with different concentrations of KT5823 for 1 h were stimulated with either 0.75 μg/ml LPS (A and B) or 200 μM GSNO (C and D) under serum-free conditions. After 24 h of stimulation, the expression of CD11b was analyzed in cells by semiquantitative RT-PCR (A and C) and quantitative real time PCR (B and D). Results are mean ± S.D. of three different experiments. a, p < 0.001 versus LPS. b, p < 0.001 versus GSNO. E, cells preincubated with different concentrations of Rp-8-Br-cGMP (Rp) for 1 h were stimulated with 200 μM GSNO for 24 h followed by analysis of CD11b mRNA expression by semiquantitative RT-PCR. GAPDH, glyceraldehyde-3-phosphate dehydrogenase.
Role of CREB in NO-mediated Up-regulation of CD11b mRNA Expression in Microglia
Next we decided to find out mechanism(s) that possibly couple the NO–GC–cGMP–PKG pathway to the expression of CD11b. Using the MatInspector V2.2 search machinery; we have found the presence of six CREs in the promoter of mouse CD11b gene. Therefore, we hypothesized whether CREB was involved in NO-mediated up-regulation of CD11b downstream of GC-cGMP-PKG. Activation of CREB was monitored by DNA-binding activity that was evaluated by the formation of a distinct and specific complex in a gel shift DNA-binding assay. Treatment of BV-2 microglial cells with 200 μM GSNO resulted in the time-dependent induction of DNA binding activity of CREB (Fig. 11A). This gel shift assay detected a specific band in response to GSNO that was competed off by an unlabeled probe suggesting that GSNO induces the DNA-binding activity of CREB. Consistently, GSNO (200 μM) alone also induced the transcriptional activity of CREB as monitored by a 3.3 ± 0.4-fold increase in luciferase activity from pCRE-Luc (CREB-dependent reporter construct; Stratagene) by GSNO over the control (data not shown). Because PKG functions downstream to NO in the regulation of CD11b expression, we then tested whether NO was inducing the activation of CREB via PKG. Inhibition of GSNO-induced activation of CREB by KT5823 (Fig. 11B) suggests that NO is inducing the activation of CREB via PKG. Next, to investigate whether CREB is involved in NO-mediated up-regulation of CD11b, we used antisense oligonucleotides to knock down CREB. The following antisense (ASO) and scrambled (ScO) oligonucleotides were used for this study: CREB ASO, 5′-GTCTGCTCCAGATTC-3′ and CREB ScO, 5′-GATCCCGATTCGTCT-3′.
FIGURE 11. Involvement of CREB in NO-mediated increase in CD11b expression in mouse BV-2 microglial cells.

A, cells were stimulated with 200 μM GSNO under serum-free conditions and at different minute intervals, the DNA binding activity of CREB was analyzed by electrophoretic mobility shift assay. In the last lane, the DNA-binding activity of nuclear extract (90 min) was competed out by 50-fold excess unlabeled probe. The upper and lower arrows indicate CREB DNA-binding and unbound probe, respectively. B, cells preincubated with different concentrations of KT5823 for 1 h were stimulated with 200 μM GSNO under serum-free conditions. After 1 h of stimulation, the DNA binding activity of CREB was analyzed by electrophoretic mobility shift assay. The figure represents three independent experiments. C, cells received 1 μM of either antisense (ASO) or scrambled oligonucleotides (ScO) against CREB. After 42 h of incubation, cells were analyzed for the expression of CREB mRNA by semiquantitative RT-PCR. D, cells preincubated with 1 μM ASO or ScO against CREB for 42 h received 200 μM GSNO. After 1 h of stimulation, the expression of CD11b was analyzed by semiquantitative RT-PCR. GAPDH, glyceraldehyde-3-phosphate dehydrogenase.
As shown in Fig. 11C, ASO but not ScO against CREB inhibited the expression of CREB mRNA. Interestingly, ASO but not ScO against CREB abrogated GSNO-mediated up-regulation of CD11b mRNA (Fig. 11D). These results suggest that LPS increases microglial expression of CD11b via NO–GC–cGMP–PKG–CREB pathway.
Discussion
Although the substantia nigra has an extremely high density of resting microglia (29), in general, microglia comprise only 2–5% of total brain cells in a healthy human being (1). However, after any degenerative injury or insult, the microglial number increases dramatically and the microglial population may represent up to 12% of total brain cells (1, 21). Therefore, common pathological hallmarks of several neurodegenerative diseases include the loss of invaluable neurons associated with or followed by massive activation of microglia (1, 21, 30). Although microglial activation has an important repairing function, once microglia become activated in neurodegenerating microenvironment, it always goes beyond control and eventually detrimental effects override beneficial effects. Therefore, understanding mechanisms that regulate microglial activation is an important area of investigation that may enhance the possibility of finding a primary or an adjunct therapeutic approach against incurable neurodegenerative disorders. Microglial activation is represented by increased expression of CD11b. Several lines of evidence presented in this manuscript clearly demonstrate that NO plays a key role in microglial expression of CD11b. First, in LPS-stimulated microglial cells, the increase in CD11b expression began after the production of NO. Second, LPS and other inducers of iNOS (IFN-γ, IL-1β, HIV-1 gp120, and poly(IC)) were unable to stimulate the expression of CD11b in microglia where either NO was scavenged by PTIO or NO production was inhibited by L-NIL. Similarly, microinjection of LPS into the striatum caused marked up-regulation of CD11b. Consistent to the effect observed in isolated microglia, L-NIL and PTIO strongly inhibited the LPS-mediated increase in striatal CD11b expression in vivo. Microglial activation is believed to play a pivotal role in the loss of dopaminergic neurons in striatum and nigra of patients with Parkinson disease. This loss of dopaminergic neurons then leads to deficiency in dopamine, a chemical substance that enables people to move normally and smoothly. Interestingly, attenuation of LPS-mediated increase in striatal CD11b expression by PTIO was also associated with protection against LPS-induced deficits of striatal dopaminergic system as observed by restoration of TH-positive fibers and neurotransmitters. Third, NO alone was also capable of stimulating the expression of CD11b in microglial cells. Microglia in the healthy brain usually do not express iNOS but following ischemic, traumatic, neurotoxic, or inflammatory damage, microglia express iNOS and produce excessive amount of NO in mouse, rat, and human (14, 18, 19, 21, 30, 31). Our results clearly indicate that the up-regulation of CD11b expression in reactive microglia follows NO production. Apart from CD11b, up-regulation of various other surface markers such as CD18, CD11a, and CD11c is observed in reactive microglia. Interestingly, NO is also involved in the up-regulation of these surface markers in microglia.
The signaling mechanisms for the increase in CD11b expression in microglia are not known. Because the up-regulation of microglial CD11b depends on NO, and among many downstream targets of NO, activation of GC represents the most important one because of its involvement in many physiological processes including vasodilation, modulation of synaptic transmission, and inhibition of platelet aggregation (24, 25), we were prompted to explore the role of GC in microglial expression of CD11b. Interestingly, our results demonstrate that NO employs GC to stimulate the expression of CD11b in microglia. Our conclusion is based on the following. First, LPS as well as GSNO, a NO donor, was unable to increase the expression of CD11b in microglia that was treated with NS-2028, an inhibitor of GC. Second, a cell-permeable cGMP analog (8-Br-cGMP) and MY-5445, an inhibitor of cGMP phosphodiesterase, were also capable of stimulating microglial expression of CD11b. Third, cGMP is known to execute its function via PKG. Consistently, KT5823, a specific inhibitor of PKG, attenuated LPS- and GSNO-mediated increase in CD11b expression. Fourth, the promoter of mouse CD11b contains six cAMP response elements (CRE). GSNO induced the activation of CREB via PKG in microglia and earlier Chan et al. (32) have reported possible phosphorylation of CREB by PKG in nucleus tractus solitarii. Interestingly, antisense knock down of CREB abrogated GSNO-mediated up-regulation of microglial CD11b suggesting that NO up-regulates the expression of CD11b through GC-cGMP-PKG-mediated activation of CREB. Because microglial activation is involved in the pathophysiology of several neurodegenerative disorders, our results suggest that NO-coupled GC-cGMP-PKG-CREB signaling pathway may also be an important player under neurodegenerative conditions.
NO, a short-lived and diffusible free radical, plays many roles as a signaling and effector molecule in diverse biological systems; it is a neuronal messenger and is involved in vasodilation as well as in antimicrobial and antitumor activities (33). On the other hand, NO has also been implicated in several CNS disorders, including inflammatory, infectious, traumatic, and degenerative diseases (34–38). There are considerable evidences for the transcriptional induction of iNOS (the high output isoform of NOS) in the CNS that is associated with autoimmune reactions, acute infection, and degenerative brain injury (34–38). NO is potentially toxic to neurons and oligodendrocytes that may mediate toxicity through the formation of iron-NO complexes of iron-containing enzyme systems (39), oxidation of protein sulfhydryl groups (40), nitration of proteins, and nitrosylation of nucleic acids and DNA strand breaks (41). Here we demonstrate that NO is a key player in microglial activation as well, in which NO increases microglial expression of CD11b. Therefore, specific targeting of NO either by iNOS inhibitors or NO scavengers may be an important step for the attenuation of microglial activation.
The abbreviations used are
- CNS
central nervous system
- iNOS
inducible nitric-oxide synthase
- LPS
lipopolysaccharide
- IL
interleukin
- HIV-1
human immunodeficiency virus type-1
- PKG
cGMP-activated protein kinase
- CREB
cAMP response element-binding protein
- GC
guanylate cyclase
- L-NIL
L-N6-(1-Iminoethyl)-lysine
- 8-Br-cGMP
8-bromo-cGMP
- FACS
fluorescence-activated cell sorter
- TH
tyrosine hydroxylase
- RT-PCR
reverse transcription-PCR
- ASO
antisense oligonucleotide
- ScO
scrambled oligonucleotide
Footnotes
This study was supported by Grants NS39940 and NS48923 from the National Institutes of Health, Grant RG3422A1/1 from the National Multiple Sclerosis Society, and the Michael J. Fox Foundation for Parkinson's Research.
References
- 1.Gonzalez-Scarano F, Baltuch G. Annu Rev Neurosci. 1999;22:219–240. doi: 10.1146/annurev.neuro.22.1.219. [DOI] [PubMed] [Google Scholar]
- 2.Barcia C, Sanchez Bahillo A, Fernandez-Villalba E, Bautista V, Poza Y, Poza M, Fernandez-Barreiro A, Hirsch EC, Herrero MT. Glia. 2004;46:402–409. doi: 10.1002/glia.20015. [DOI] [PubMed] [Google Scholar]
- 3.Dauer W, Przedborski S. Neuron. 2003;39:889–909. doi: 10.1016/s0896-6273(03)00568-3. [DOI] [PubMed] [Google Scholar]
- 4.Wu DC, Jackson-Lewis V, Vila M, Tieu K, Teismann P, Vadseth C, Choi DK, Ischiropoulos H, Przedborski S. J Neurosci. 2002;22:1763–1771. doi: 10.1523/JNEUROSCI.22-05-01763.2002. [DOI] [PMC free article] [PubMed] [Google Scholar]
- 5.Carson MJ. Glia. 2002;40:218–231. doi: 10.1002/glia.10145. [DOI] [PMC free article] [PubMed] [Google Scholar]
- 6.Rock RB, Gekker G, Hu S, Sheng WS, Cheeran M, Lokensgard JR, Peterson PK. Clin Microbiol Rev. 2004;17:942–964. doi: 10.1128/CMR.17.4.942-964.2004. [DOI] [PMC free article] [PubMed] [Google Scholar]
- 7.Ling EA, Wong WC. Glia. 1993;7:9–18. doi: 10.1002/glia.440070105. [DOI] [PubMed] [Google Scholar]
- 8.Schwarz M, Nordt T, Bode C, Peter K. Thromb Res. 2002;107:121–128. doi: 10.1016/s0049-3848(02)00207-4. [DOI] [PubMed] [Google Scholar]
- 9.Stewart VC, Heales SJ. Free Radic Biol Med. 2003;34:287–303. doi: 10.1016/s0891-5849(02)01327-8. [DOI] [PubMed] [Google Scholar]
- 10.Ischiropoulos H, Beckman JS. J Clin Investig. 2003;111:163–169. doi: 10.1172/JCI17638. [DOI] [PMC free article] [PubMed] [Google Scholar]
- 11.Giulian D, Baker TJ. J Neurosci. 1986;6:2163–2178. doi: 10.1523/JNEUROSCI.06-08-02163.1986. [DOI] [PMC free article] [PubMed] [Google Scholar]
- 12.Jana M, Liu X, Koka S, Ghosh S, Petro TM, Pahan K. J Biol Chem. 2001;276:44527–44533. doi: 10.1074/jbc.M106771200. [DOI] [PMC free article] [PubMed] [Google Scholar]
- 13.Liu X, Jana M, Dasgupta S, Koka S, He J, Wood C, Pahan K. J Biol Chem. 2002;277:39312–39319. doi: 10.1074/jbc.M205107200. [DOI] [PMC free article] [PubMed] [Google Scholar]
- 14.Dasgupta S, Jana M, Liu X, Pahan K. J Biol Chem. 2002;277:39327–39333. doi: 10.1074/jbc.M111841200. [DOI] [PMC free article] [PubMed] [Google Scholar]
- 15.Dasgupta S, Jana M, Liu X, Pahan K. J Biol Chem. 2003;278:22424–22431. doi: 10.1074/jbc.M301789200. [DOI] [PMC free article] [PubMed] [Google Scholar]
- 16.Jana A, Pahan K. J Neurosci. 2004;24:9531–9540. doi: 10.1523/JNEUROSCI.3085-04.2004. [DOI] [PMC free article] [PubMed] [Google Scholar]
- 17.Dasgupta S, Jana M, Zhou Y, Fung YK, Ghosh S, Pahan K. J Immunol. 2004;173:1344–1354. doi: 10.4049/jimmunol.173.2.1344. [DOI] [PubMed] [Google Scholar]
- 18.Pahan K, Sheikh FG, Liu X, Hilger S, McKinney MJ, Petro TM. J Biol Chem. 2001;276:7899–7905. doi: 10.1074/jbc.M008262200. [DOI] [PMC free article] [PubMed] [Google Scholar]
- 19.Kim HS, Whang SY, Woo MS, Park JS, Kim WK, Han IO. J Neuroimmunol. 2004;151:85–93. doi: 10.1016/j.jneuroim.2004.02.006. [DOI] [PubMed] [Google Scholar]
- 20.Saha RN, Pahan K. J Neurochem. 2003;86:1057–1071. doi: 10.1046/j.1471-4159.2003.01942.x. [DOI] [PMC free article] [PubMed] [Google Scholar]
- 21.Gonzalez-Scarano F, Martin-Garcia J. Nat Rev Immunol. 2005;5:69–81. doi: 10.1038/nri1527. [DOI] [PubMed] [Google Scholar]
- 22.Dawson VL, Dawson TM, Uhl GR, Snyder SH. Proc Natl Acad Sci U S A. 1993;90:3256–3259. doi: 10.1073/pnas.90.8.3256. [DOI] [PMC free article] [PubMed] [Google Scholar]
- 23.Auch CJ, Saha RN, Sheikh FG, Liu X, Pahan K. FEBS Lett. 2004;563:223–228. doi: 10.1016/S0014-5793(04)00302-3. [DOI] [PMC free article] [PubMed] [Google Scholar]
- 24.Bredt DS. Mol Pharmacol. 2003;63:1206–1208. doi: 10.1124/mol.63.6.1206. [DOI] [PubMed] [Google Scholar]
- 25.Hawkins RD, Son H, Arancio O. Prog Brain Res. 1998;118:155–172. doi: 10.1016/s0079-6123(08)63206-9. [DOI] [PubMed] [Google Scholar]
- 26.Stoner MC, Kellum JM. Surgery. 2001;130:236–241. doi: 10.1067/msy.2001.115903. [DOI] [PubMed] [Google Scholar]
- 27.Monfort P, Munoz MD, Kosenko E, Felipo V. J Neurosci. 2002;22:10116–10122. doi: 10.1523/JNEUROSCI.22-23-10116.2002. [DOI] [PMC free article] [PubMed] [Google Scholar]
- 28.Jouvert P, Revel MO, Lazaris A, Aunis D, Langley K, Zwiller J. J Neurosci. 2004;24:10716–10725. doi: 10.1523/JNEUROSCI.1398-04.2004. [DOI] [PMC free article] [PubMed] [Google Scholar]
- 29.Lawson LJ, Perry VH, Dri P, Gordon S. Neuroscience. 1990;39:151–170. doi: 10.1016/0306-4522(90)90229-w. [DOI] [PubMed] [Google Scholar]
- 30.Pahan K, Sheikh FG, Namboodiri AMS, Singh I. J Clin Investig. 1997;100:2671–2679. doi: 10.1172/JCI119812. [DOI] [PMC free article] [PubMed] [Google Scholar]
- 31.Hill KE, Zollinger LV, Watt HE, Carlson NG, Rose JW. J Neuroimmunol. 2004;151:171–179. doi: 10.1016/j.jneuroim.2004.02.005. [DOI] [PubMed] [Google Scholar]
- 32.Chan SH, Chang KF, Ou CC, Chan JY. Mol Pharmacol. 2004;65:319–325. doi: 10.1124/mol.65.2.319. [DOI] [PubMed] [Google Scholar]
- 33.Nathan C. FASEB J. 1992;6:3051–3064. [PubMed] [Google Scholar]
- 34.Brosnan CF, Battistini L, Raine CS, Dickson DW, Casadevall A, Lee SC. Dev Neurosci. 1994;16:152–161. doi: 10.1159/000112102. [DOI] [PubMed] [Google Scholar]
- 35.Merrill JE, Ignarro LJ, Sherman MP, Melinek J, Lane TE. J Immunol. 1993;151:2132–2141. [PubMed] [Google Scholar]
- 36.Mitrovic B, Ignarro LJ, Montestruque S, Smoll A, Merril JE. Neurosci. 1994;61:575–585. doi: 10.1016/0306-4522(94)90435-9. [DOI] [PubMed] [Google Scholar]
- 37.Akama KT, Albanese C, Pestell RG, Van Eldik LJ. Proc Natl Acad Sci U S A. 1998;95:5795–5800. doi: 10.1073/pnas.95.10.5795. [DOI] [PMC free article] [PubMed] [Google Scholar]
- 38.Samdani AF, Dawson TM, Dawson VL. Stroke. 1997;28:1283–1288. doi: 10.1161/01.str.28.6.1283. [DOI] [PubMed] [Google Scholar]
- 39.Drapier JC, Hibbs JB. J Immunol. 1988;140:2829–2838. [PubMed] [Google Scholar]
- 40.Radi R, Beckman JS, Bush KM, Freeman BA. J Biol Chem. 1991;266:4244–4250. [PubMed] [Google Scholar]
- 41.Wink DA, Kasprazak KS, Maragos CM, Elespuru RK, Misra M, et al. Science. 1991;254:1001–1003. doi: 10.1126/science.1948068. [DOI] [PubMed] [Google Scholar]