
Figure 3. Altered Rhythmic Expression of vri, pdp1ε, and per in cwo Mutants.
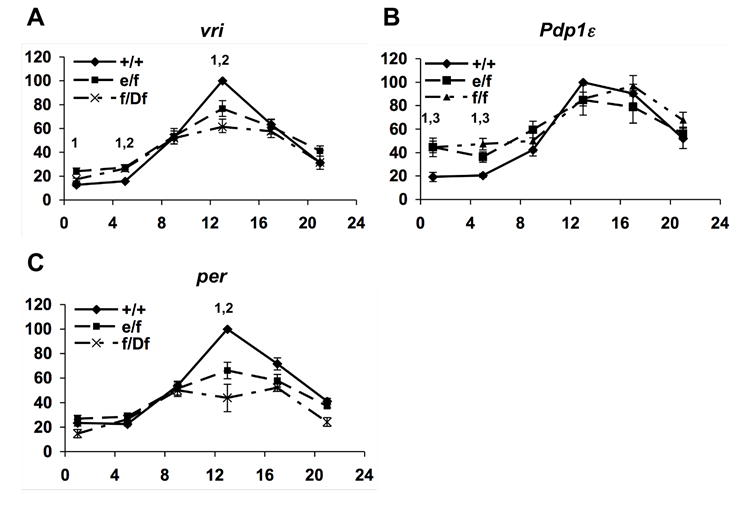
Quantitative real-time RT-PCR analysis of vri (A), pdp1ε (B), and per (C) expression during the first day of DD. X-axis indicates circadian time. Wild-type (+/+) levels at CT 13 (peak) are set to 100 and indicated as a closed line. cwo mutants cwoe/cwof (e/f), cwof/Df(3R)ED5495 (f/Df), and cwof/cwof (f/f) are indicated as dashed lines. Data for f/f not shown for vri but is similar to e/f. Statistical significance (p<.05) is indicated with a “1” for comparing +/+ with e/f, “2” for comparing +/+ with f/Df, and “3” for comparing +/+ with f/f. N experiments ≥ 3 except f/Df CT5,9,17,21, where N=2. Error bars indicate SEM.