

Abstract
The human RFC (hRFC) gene is regulated by five major 5’ non-coding exons, characterized by alternate transcription start sites and splice forms. The result is up to 14 hRFC transcripts for which different 5’ untranslated regions (UTRs) are fused to a common coding sequence. By in vitro translation assays with hRFC constructs corresponding to the major transcript forms, most of the forms were translated poorly. Upon expression of the 5’UTR-hRFC constructs in hRFC-null HeLa cells, a range of steady state hRFC proteins and transcripts were detected that reflected relative transcript stabilities and, to a lesser extent, translation efficiencies. Transcripts including 5’ UTRs derived from non-coding exon A encoded a modified hRFC protein translated from an upstream initiation site. When this modified hRFC protein was expressed in hRFC-null K562 cells, there were only minor differences in surface targeting, stability, or transport function from wild type hRFC. Our results demonstrate an important role for posttranscriptional determinants of cellular hRFC levels and activity.
INTRODUCTION
Genes that are critical to life are frequently subject to an intricate and highly integrated regulation. The reduced folate carrier (RFC) is a prototype of this class, since folates are essential to cell survival and RFC is the primary means for uptake of reduced folates into mammalian cells and tissues [1]. RFC is ubiquitously but differentially expressed in assorted tissues [2]. RFC is also the primary transporter of antifolate drugs such as methotrexate (MTX) used to treat a variety of cancers [3].
The human RFC (hRFC) gene is regulated by 5 major upstream non-coding exons (designated A1/A2, A, B, C, and D), each apparently transcribed from a unique promoter (Figure 1) [2,4]. At least 14 distinct hRFC transcripts can be envisaged in which different 5’ untranslated regions (UTRs) are fused to a common splice acceptor region (positions −1 to −49, relative to ATG at position +1) within the first coding exon, with a common 1776 bp hRFC open reading frame (ORF). The 5’ non-coding exons are characterized by alternate transcription start sites, multiple splice forms, and selective tissue distributions [2,4]. Alternate 5’UTRs can impact mRNA stabilities and translation efficiencies, and result in synthesis of modified proteins translated from upstream AUGs (uAUGs) [5]. Translation from an in-frame uAUG in the A1/A2 non-coding region results in the synthesis of a larger hRFC protein with transport properties somewhat distinct from those for wild type hRFC [4]. However, other aspects of hRFC posttranscriptional regulation have not been characterized. In this report, we explore the role of the alternate 5’UTRs in the posttranscriptional regulation of hRFC.
Fig. 1. Schematic representation of the human reduced folate carrier (hRFC) upstream region showing alternate non-coding exons.
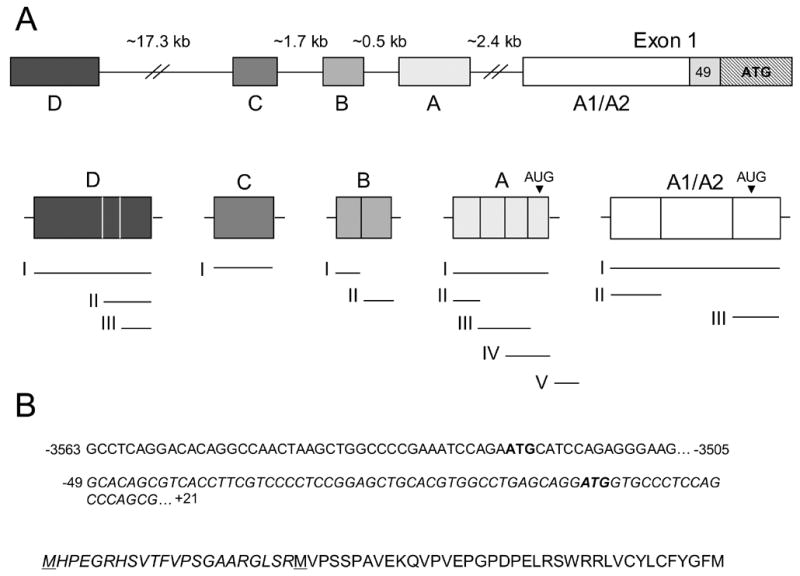
Panel A: The upper panel shows the upstream region of the hRFC gene including five major non-coding regions (A1/A2 and A–D) and the first coding exon (Exon 1) including the major ATG translation start site (position +1). The lower panel shows the origin of the 14 alternate 5’UTRs from the five major non-coding regions including 3 for A1/A2, 5 for A, 2 for B, 1 for C, and 3 for D. Each 5’UTR is linked to a common 49 bp non-coding sequence (positions −1 to −49) and a common hRFC ORF (not shown). The locations of uAUGs in the A1/A2 and A non-coding regions that initiate translation resulting in alternate hRFC proteins with additional N-teminal sequence are noted. Panel B: In the upper panel, the nucleotide sequence of the AV non-coding region is shown in its entirety (positions −3563 to −3505) which is spliced to the 5' sequence of coding exon 1 at position −49. The uAUG in exon A and the downstream AUG (ATG) at position +1 are in bold. All numbering corresponds to the distance from the translation start site with the A of the ATG in exon 1 representing +1. In the lower panel, the amino acid sequence encoded from the uAUG within non-coding exon A, and continuing into the common coding sequence for hRFC is shown. Italicized amino acids designate the additional residues encoded from exon A and the translation initiation methionines are underlined.
MATERIALS AND METHODS
Chemicals
[alpha-32P] dCTP (3000 Ci/mmol) was purchased from Perkin Elmer Life Sciences (Boston, MA). [3′,5′,7-3H]MTX (20 Ci/mmol) was purchased from Moravek Biochemicals (Brea, CA). Unlabeled MTX and (6R,S)-5-formyl tetrahydrofolate (Leucovorin) were provided by the Drug Development Branch, National Cancer Institute (Bethesda, MD). Both labeled and unlabeled MTX were purified by high-pressure liquid chromatography prior to use [6]. Folic acid was purchased from the Sigma Chemical Co. (St. Louis, MO). The sources of the antifolate drugs were as follows: Raltitrexed [N-(5-[N-(3,4-dihydro-2-methyl-4-oxyquinazolin-6-ylmethyl)-N-methyl-amino]-2-thenoyl)-L-glutamic acid] was obtained from AstraZeneca Pharmaceuticals (Maccesfield, Cheshire, England); Pemetrexed [N-{4-[2-(2-amino-3,4-dihydro-4-oxo-7H-pyrrolo[2,3-D]pyrimidin-5-yl)ethyl]benzoyl}-L-glutamic acid] was from Eli Lilly and Co. (Indianapolis, IN); and GW1843U89 [(S)-2-(5-(((1,2-dihydro-3-methyl-1-oxo-benzo(F)quinazolin-9-yl) methyl) amino)1-oxo-2-isoindolinyl) glutaric acid] was from the GlaxoWellcome-SmithKline Co. (Research Triangle Park, NC). Molecular biology reagents were from Promega (Madison, WI) or Invitrogen (Carlsbad, CA).
Cell culture
The origin, characteristics, and culture of the hRFC-null K562 cells (designated K500E), and the K500E subline transfected with the 11-hRFC construct [contains sequence from positions −1 to −11, the full length hRFC ORF, and a hemaglutinin (HA) epitope at Gln587 cloned in the pCDNA3 vector (Invitrogen)] have been described [4,7,8]. Likewise, the origin and culture of the R5 (hRFC-null) HeLa subline were described [9,10].
Preparation of the 5’UTR-hRFC constructs
Primers used for preparing the expression constructs are in Table 1. The 5’UTR-hRFC constructs, with the individual 5’UTRs fused to the hRFC coding sequence and a C-terminal HA epitope (in pCDNA3), were prepared by “Soeing” PCR [11] from 5’ RACE clones [2,4], genomic DNA, or cDNA constructs [12], using 5’UTR sense and the n-1 antisense primers. hRFC coding sequence was amplified from the 11-hRFC template, using n-1 sense and rHA7 antisense primers. The products were mixed and reamplified with the respective 5’UTR sense and rHA7 antisense primers. The kmAV-hRFC construct containing a mutated Kozak consensus sequence for the downstream AUG translation start (at position +1) was prepared by Soeing PCR from the AV-hRFC construct using AV 5’UTR sense/kAUG1 antisense and kAUG1sense/rHA7 antisense primer pairs, with secondary amplification using the AV 5’UTR/rHA7 primers [4]. For all constructs, the amplicons were digested with either KpnI or HindIII and NotI and subcloned into restriction- digested 11-hRFC construct. Constructs were verified by automated DNA sequencing.
Table 1.
PCR Primers.
| Primer Name | Primer Sequence |
|---|---|
| 5'UTR | |
| A1/A2I (sense) | 5′-GCTCAAGCTTGATTTGTGGTGGTGAGACGTGCCCTTGCCCGC-3′ |
| A1/A2II (sense) | 5′-GCTCGGTACCGATTTGTGGTGGTGAGACGTGCCCTTGCCCGC-3′ |
| A1/A2III (sense) | 5′-GCTCGGTACCTCAGCCTCGGAGACCCTGGAGGTGG-3′ |
| AI (sense) | 5′-GCTCGGTACCCTTCGGCGCGCCCAGGCACGTGTTG-3′ |
| AII (sense) | 5′-GCTCGGTACCCCGGGTCTGGAGGAAAGCGTGGATC-3′ |
| AIII (sense) | 5′-GCTCGGTACCGTGGGTGAACCCTGCCAGCCACGCG-3′ |
| AIV (sense) | 5′-GCTCGGTACCGTGGGTCCTTCCAACACCGCTACAG-3′ |
| AV (sense) | 5′-GCTCGGTACCGCCTCAGGACACAGGCCAACTAAGC-3′ |
| BI (sense) | 5′-GCTCGGTACCCGCGTGCGCGGGGCCGGGTCCGGGA-3′ |
| BII (sense) | 5′-GCTCGGTACCGCCGCGTGTCGGGGGCTGCGGGGTG-3′ |
| C (sense) | 5′-GCTCGGTACCTTACAACTGCCAAGTGCTGTTGGTGGCAGAAG-3′ |
| DI (sense) | 5′-GCTCGGTACCTCTCCCGAGGCTTGCTTTGAACGTT-3′ |
| DII (sense) | 5′-GCTCGGTACCGTAAATTCAGCTCCTTCCCCTCTGA-3′ |
| DIII (sense) | 5′-GCTCGGTACCGTAAATTCAGCTCCTTCCCCTCTGA-3′ |
| hRFC Soeing | |
| n-1 (sense) | 5′-CAGCGTCACCTTCGTCCCCTCCGGAGCT-3′ |
| n-1 (anti) | 5′-AGCTCCGGAGGGGACGAAGGTGACGCTG-3′ |
| rHA7 (anti) | 5′-CTCGTTCCACAGGATGTGCAC-3′ |
| kmAV hRFC | |
| kAUG1 (sense) | 5′-CACGTGGCCTGAGCCGGATGGTGCCCTCCAGC-3′ |
| kAUG1 (anti) | 5′-GCTGGAGGGCACCATCCGGCTCAGGCCACGTG -3′ |
All underlined nucleotides represent restriction enzyme sites (5’UTR restriction sites are all KpnI except for the HindIII site in A1/A2I). Bold italicized letters in the kmAV hRFC primers designate mutant nucleotides.
Transfections of 5’UTR-hRFC constructs and confocal microscopy
Transient transfections of the 5’UTR-hRFC (3.6 μg) constructs into the R5 HeLa subline were performed as previously described [10]. The AV-hRFC and kmAV-hRFC constructs were stably transfected into K500E cells using Lipofectin® (Invitrogen) as described [6]. hRFC cellular targeting was assessed by confocal microscopy using anti-HA antibody (Roche), with secondary staining with goat anti-mouse IgG conjugated with Alexa Fluor 488 antibody (Invitrogen-Molecular Probes) [8,10].
Northern blot and hRFC transcript stability assays
R5 HeLa cells were transiently transfected with the 5’UTR-hRFC expression constructs and total RNAs were isolated by TRIzol reagent [12]. For transcript stability experiments, R5 HeLa transfectants were treated with 10 μg/ml Actinomycin D and RNAs were prepared at 2 hour intervals over 8 hours. Northern blots were performed as described previously [12] and probed with 32P-labeled hRFC cDNA, labeled with the Prime-a-Gene® labeling system (Promega). Loading was normalized by ethidium bromide staining the 18S and 28S RNAs. Densitometry of the X-ray films at several exposures and the ethidium bromide-stained 28S rRNAs were quantitated with the Odyssey® Imaging System (LI-COR, Lincoln, NE). For the actinomycin D experiments, densitometry ratios were plotted versus time, and linear regression was used to extrapolate and determine transcript half lives.
Western blot analysis and protein stabilities
Plasma membranes were prepared for Western blot analysis of membrane proteins [8,10]. Detection was with anti-HA rabbit polyclonal (Covance, Berkeley, CA) or Na,K ATPase monoclonal (Novus Biologicals, Littleton, CO) antibodies, and secondary IRDyeTM 800-conjugated antibodies (Rockland, Gilbertsville, PA). N-glycosidase F (New England Biolabs, Ipswich, MA) digestions were performed as described previously [4]. hRFC protein turnovers were measured on Western blots of membrane proteins from cells treated with cycloheximide (0.2 mg/ml) over 24 h [13]. Detection and densitometry of the blots was performed with the Odyssey® Imaging System.
In vitro translation experiments
In vitro translations were performed over 90 min using the TNT Quick T7 Coupled Transcription/Translation System (Promega) with 1 μg of empty pCDNA3 or 5’UTR-hRFC constructs. Reactions were analyzed by Western blots with anti-HA antibody. Detection was with the Odyssey® Imaging System
Transport methodology
[3H]MTX (1 μM) uptake was measured in transfected R5 cells, as previously described [10]. For the stably transfected K500E cells, kinetic constants (Kt, Vmax) were calculated from Lineweaver-Burk plots for a range of 3H-MTX concentrations, and inhibition constant Ki values for assorted transport substrates were determined from Dixon plots with 3H-MTX (1 μM) [4,7,8].
RESULTS AND DISCUSSION
A refinement of hRFC upstream gene structure
hRFC is regulated by multiple promoters, involving both ubiquitously expressed and tissue-specific transcription factors and cis elements [14-18]. We originally identified 7 non-coding regions (designated A1, A2, A, B, C, D, and E) for hRFC by 5’RACE (5’ Rapid Amplification of cDNA Ends) assay in RNAs from normal human tissues [2]. As many as 18 potential 5’UTRs were identified that could have arisen by variable splicing of the alternate non-coding exons. We later established that the A1 and A2 sequences are derived from a single ~1021 bp A1/A2 non-coding region that expands the first coding exon to ~1258 bp [4]. Moreover, the original transcript forms AVI, CII, DIV, DV and E, if genuine, were certainly rare, having been identified in only one or two out of over 500 5’RACE clones [2,4]. Accordingly, we have revised our model of hRFC gene structure to include the 5 major non-coding exons that are spliced to generate as many as 14 different 5’UTRs fused to a common splice acceptor site at position −49, and to a common 1776 bp hRFC ORF (Figure 1A). The upstream non-coding sequences for hRFC were deposited in GenBank®1.
In vitro translation analyses
Based on the scanning model for translation, efficient translation typically involves 5’UTRs that are moderately short (<210 bp), have a low percentage of guanines and cytosines (GC content <65%), are unstructured, and do not contain uAUGs [19–22]. We used the Mfold algorithm (http://www.bioinfo.rpi.edu/applications/mfold) to model RNA sequences and identify complex secondary structures (e.g., stem-loop structures) for the hRFC 5’UTRs [23]. Using the predicted Gibbs free energy values (ΔG) calculated by Mfold, overall stabilities were determined by dividing the ΔG values by the individual 5’UTR lengths since -ΔG increases with 5’UTR length proportional to the extent of secondary structure along the length. Many of the 14 major hRFC 5’UTR sequences have features likely to adversely impact translation, most notably extensive secondary structure (as reflected in the high GC contents and free energy values), and the presence or absence of uAUGs (Table 2).
Table 2.
Characteristics of the hRFC 5’ UTRs.
| 5’UTR | Size | % GC | uAUG | ΔG (kcal/mol/nuc (10−3)) | Position |
|---|---|---|---|---|---|
| A1/A2 I | 1072 | 63.24 | 9 | −416.49 | −1069 to −50 |
| A1/A2 II | 319 | 63.32 | 4 | −374.57 | −1069 to −803 |
| A1/A2 III | 293 | 65.87 | 1 | −406.45 | −290 to −50 |
| A I | 422 | 64.25 | 1 | −418.97 | −3874 to −3505 |
| A II | 122 | 69.67 | −490.98 | −3906 to -3837 | |
| A III | 233 | 64.8 | −382.27 | −3836 to −3656 | |
| A IV | 203 | 62.23 | 1 | −347.34 | −3655 to −3505 |
| A V | 111 | 62.16 | 1 | −326.12 | −3563 to −3505 |
| B I | 108 | 76.85 | −419.44 | −4473 to −4418 | |
| B II | 129 | 74.41 | −473.64 | −4391 to −4310 | |
| C | 257 | 66.14 | −376.65 | −6380 to −6187 | |
| D I | 518 | 52.5 | 5 | −265.81 | −24531 to −24066 |
| D II | 212 | 53.3 | 1 | −214.43 | −24225 to −24066 |
| D III | 132 | 56.06 | −229.31 | −24145 to −24066 |
5’ UTR characteristic sequences include the 49 splice acceptor region as well as the translational start site nucleotides. The predicted ΔG free energy values were determined using Mfold, and then divided by 5’ UTR size [23]. The position numbers correspond to the minus distance from the translational start site at position +1, based on genomic DNA sequence.
To assess effects of the 5’UTRs on hRFC translation efficiency, we prepared constructs in which each of the 14 major 5’UTRs was fused (at position -49) to the hRFC ORF with a carboxyl HA epitope (Figure 2A). Equal amounts of the 5’UTR-hRFC constructs were added to in vitro translation reactions. On Western blots (Figure 2B), levels of translation products for most of the 5’UTR hRFC constructs were low to undetectable. Only 3 constructs (AV, DII, and DIII), including some with the lowest percent GC and ΔG values and without uAUGs resulting in ORFs (see below), were efficiently translated in vitro. Interestingly, BI, the major transcript form detected in a wide variety of cultured cell lines and primary tissues [2,4,12], gave no detectable translation product in this assay at standard detection sensitivities (however, BI could be detected when the sensitivity of detection was increased; see below). This likely reflects the high GC content and high negative ΔG of the BI 5’UTR (Table 2).
Fig. 2. In vitro transcription and translation of 5’ UTR hRFC expression constructs.
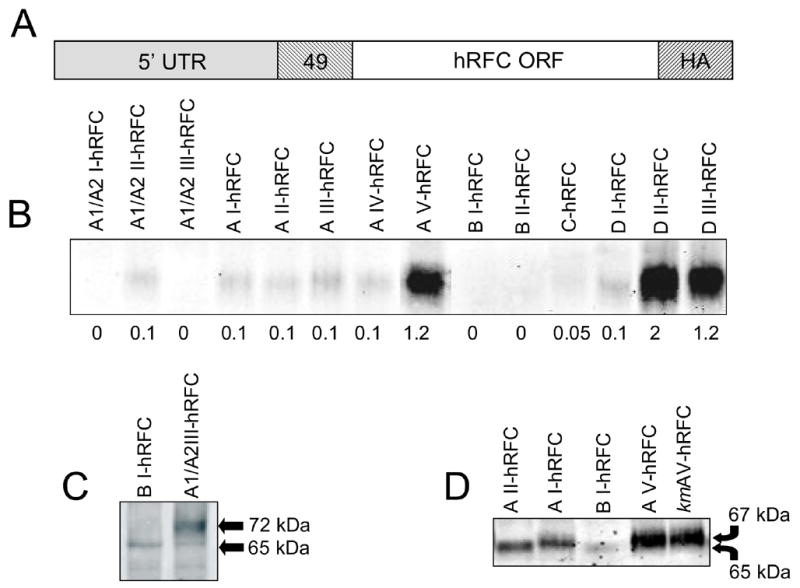
Various 5’ UTR hRFC fusion constructs cloned into pCDNA3 (1 μg each) were transcribed from the T7 promoter and in vitro translated. Ten microliters of each reaction were separated on a 7.5% SDS polyacrylamide gel, transferred to polyvinylidene difluoride membranes, and probed with HA-specific primary antibody. Panel A shows a representation of the hRFC expression constructs, including 5’UTR sequences as defined in Figure 1, the common 49 bp sequence and the full length hRFC open reading frame with a C-terminal HA epitope at Gln587. Panel B shows a Western blot of in vitro translation products for all of the 5’UTR-hRFC fusion constructs. Densitometry values are shown below each lane. In panel C are shown the in vitro translation products of the BI-hRFC and A1/A2III-hRFC constructs such that the alternate (72 kDa) hRFC protein translated from an uAUG within non-coding exon A1/A2 is detected. In panel D are shown in vitro translation products of the AII-hRFC, AI-hRFC, BI-hRFC, AV-hRFC, and kmAV-hRFC constructs such that the alternate hRFC protein translated from an uAUG within non-coding exon A is detected (uAUG is present in the AI, AV, and kmAV constructs but not the AII or BI constructs). The arrows indicate the sizes of the traditional hRFC (65 kDa) and alternate (~67 kDa) A-hRFC isoforms, as described in the text. A greater sensitivity setting for the Odyssey detection system was used for the images shown in panels C and D. The results shown are representative of 3 experiments.
For several of the A1/A2- and A-hRFC transcript forms, uAUGs occur in-frame with the hRFC ORF (without upstream termination codons). For the A1/A2 5’UTRs, translation can initiate at the uAUG 192 bp upstream of the normal translation start site [4]. By in vitro translation, the 72 kDa hRFC translated from the A1/A2I and III forms could be detected when the detection sensitivity was increased (Figure 2C shows results for the A1/A2III form). Similarly, the AI, AIV, and AV transcripts (but not AII and AIII) included an in-frame uAUG 66 bp upstream from the normal translational start (Figure 1B). Initiation at this uAUG would result in a hRFC protein with a 22 amino acid leader and a molecular mass of 67,219 Da, or 2,222 Da larger than wild type hRFC. By extended electrophoresis, it was possible to detect highly reproducible differences (~2 kDa) between migrations of the in vitro translation products for forms AI and AV from those derived from AII and BI (Figure 2D). When the Kozak consensus sequence for the downstream initiation site (GCCA/GCCAUGG, where the purine at −3 and the G at +4 have the strongest effects) [24] was mutated (to CGGATGG) to further reduce translation initiation, the construct (designated kmAV-hRFC) encoded the ~67 kDa product, identical to that for the non-mutated AV construct (Figure 2D).
Effects of 5’UTRs on steady state hRFC mRNA and protein
We transfected the hRFC-null HeLa (R5) subline with the 14 5’UTR-hRFC constructs used for the in vitro translations. Steady state hRFC transcripts were measured on Northern blots and hRFC proteins were assayed on Western blots. In contrast with the in vitro translations, moderate to high levels of hRFC transcripts and proteins were detected for most of the 5’UTR-hRFC constructs, and the highest hRFC levels were measured for several of the constructs that translated most poorly in vitro (Figure 3A). Levels of steady state hRFC proteins generally paralleled levels of hRFC transcripts (Figure 3B). The slightly disproportionate levels of hRFC proteins for the AV- and DIII-hRFC transfectants are likely due to the efficient translation for these forms (Figure 2B). The transport activities for the hRFCs expressed in R5 HeLa cells were assayed with 3H-MTX. MTX uptakes paralleled levels of expressed hRFC protein (not shown).
Fig. 3. Effects of the hRFC 5’ UTRs on the steady state hRFC transcripts and proteins in transfected HeLa cells.
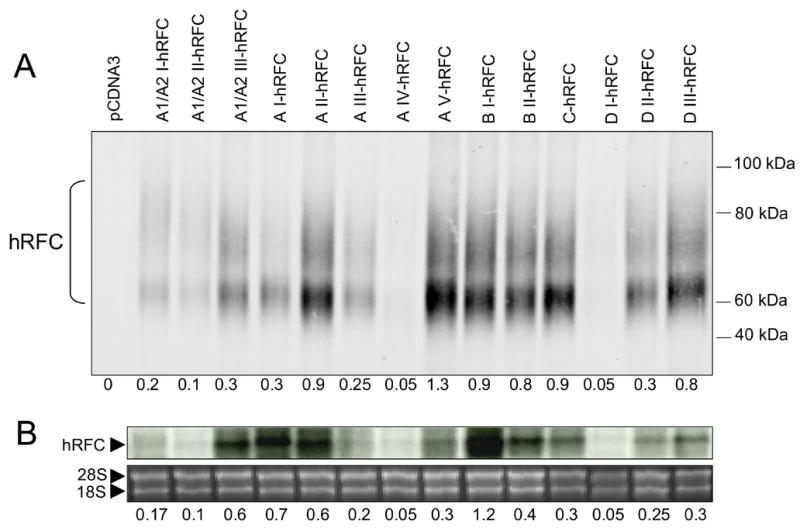
5’UTR-hRFC fusion constructs (3.6 μg each) were transfected into R5 HeLa cells, after which plasma membranes were isolated and hRFC protein levels were measured by Western blotting or total RNAs were isolated and hRFC transcript levels were measured by Northern blotting. In panel A is shown a Western blot of hRFC protein levels for the 5’UTR-hRFC fusion constructs, as measured with HA-specific antibody. Equal loading was established by stripping the membrane and reprobing with a Na,K ATPase antibody (not shown). hRFC migrates as a large complex due to its N-glycosylation site at asparagine 58 [8]. In panel B, total RNAs (10 μg) were fractionated on a 0.8% agarose/formaldehyde gel, capillary transferred to nitrocellulose, and probed with a 32P-labeled hRFC cDNA probe (top panel). Equal loading was established by ethidium bromide staining (lower panel). For both the Westerns and Northerns, intensities of the signals were measured by densitometry and the values reported below each lane. This experiment was repeated three times. Representative data are shown.
Effects of 5’UTRs on hRFC transcript stabilities
Although cis (e.g., AU) elements located in the 3’UTR of mRNAs are typically associated with transcript stabilities, 5’UTRs can also influence mRNA turnover [22,25]. All 5’UTR-hRFC constructs had an identical 3’ non-coding sequence. To assess the possibility that differences in steady state levels of hRFC transcripts were a function of effects of their 5’UTRs on transcript stabilities, we transfected R5 cells with 5’UTR-hRFC constructs after which the cells were treated with Actinomycin D and total RNAs were isolated at intervals over 8 h. RNAs were analyzed on Northern blots with 32P-labeled hRFC cDNA. hRFC transcript levels were normalized to RNA loading (assessed with ethidium bromide-stained 28S RNA) for calculation of half lives of first order transcript turnover. Results for the 14 5’UTR-hRFC constructs are shown in Figure 4 and the half lives are shown in parentheses. Interestingly, transcript half lives reproducibly fell into 3 distinct groups corresponding to fast (<3 h; A1/A2I, A1/A2II, AIV, DI), intermediate (3 to <6 h; A1/A2III, AI, AIII, AV, BII, C, DII, DIII), and slow (≥6 h; AII, BI) rates. Thus, turnover rates for the various hRFC mRNAs appear to be significantly determined by their 5’UTRs and are in general inversely proportional to steady state levels of hRFC transcripts in our R5 transfection model.
Fig. 4. Effects of hRFC 5’ UTRs on the hRFC transcript stabilities.
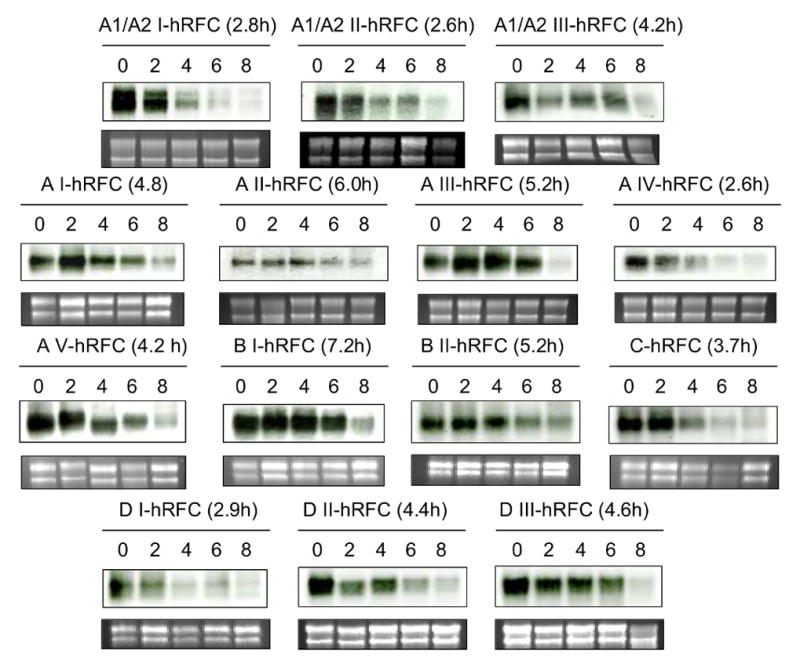
The 5’UTR hRFC constructs were transfected into R5 HeLa cells. The cells were treated with Actinomycin D (10 μg/ml), and total RNA samples (10 μg) were prepared at 0, 2, 4, 6, and 8 h, and analyzed by Northern blotting using a 32P-labeled hRFC cDNA probe (upper panels). Loading was established by ethidium bromide staining 18S and 28S ribosomal RNAs (lower panels). Densitometry was performed on multiple exposures of film and hRFC transcript levels were normalized to relative RNA loading (from densitometry of ethidium bromide-stained 28S RNA bands) for calculation of half lives of first order transcript turnover. Half lives from the experiment shown are in parentheses. The images shown are representative of duplicate experiments which gave identical results.
Further characterization of an alternate hRFC isoform translated from a uAUG within non-coding exon A
By in vitro translation (Figure 2D), a modified ~67 kDa hRFC polypeptide was identified that could be distinguished from the 65 kDa deglycosylated wild type hRFC initiated from the AUG at position +1. To assess the functional significance of the alternate ~67 kDa hRFC-A protein, hRFC-null K562 (K500E) cells were stably transfected with the AV- and kmAV-hRFC constructs. A parallel transfection was performed with the 11-hRFC wild type construct that includes 11 bp of upstream sequence and only the downstream AUG codon at position +1 for translation initiation. Transfectants were screened for similar levels of hRFC transcripts on Northerns (not shown) and for hRFC proteins on Westerns (Figure 5A). On Westerns, we identified clones expressing slight differences in the levels of hRFC proteins (~79% and 72% of wild type hRFC protein for the hRFC-A proteins from AV-hRFC and kmAV-hRFC, respectively). The glycosylated hRFC-A proteins migrated with masses slightly larger than for wild type hRFC (~85 kDa), a difference (~2kDa) that was more apparent following deglycosylation (Figure 5A, lower panel). Notably, there were no significant differences between the wild type and hRFC-A proteins in terms of subcellular localizations, as prominent signals at the cell surface were detected (although there was also some staining of intracellular structures; Figure 5B). When the stabilities of the A-hRFC and wild type hRFC protein isoforms were compared on Westerns over 24 h following treatment with cycloheximide, there were no significant differences in rates of turnover (Figure 5C).
Fig. 5. Expression of a hRFC-A protein isoform from an uAUG within non-coding exon.
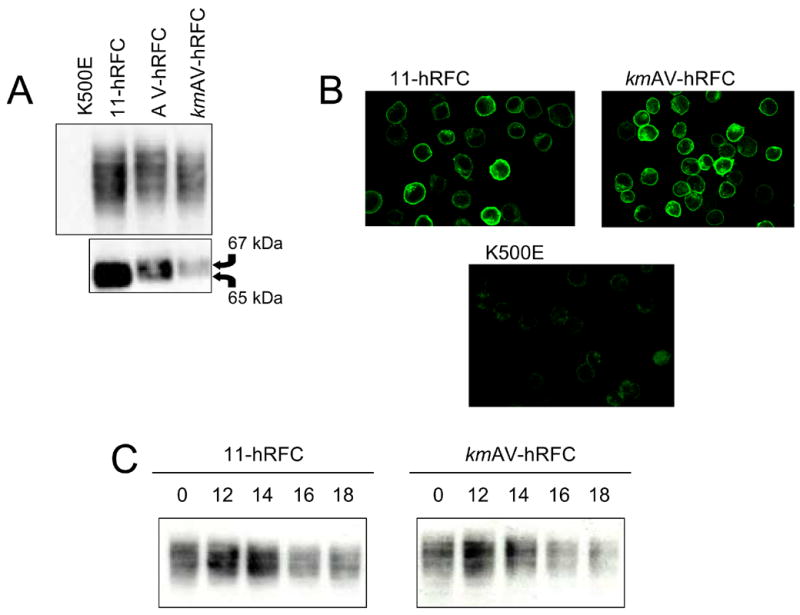
A. The 11-hRFC, AV-hRFC, and kmAV-hRFC constructs were stably transfected into the K500E (K562) hRFC-null cell line, as described in the Materials and Methods section. hRFC expression levels were measured by Western blotting, protein localization was determined by confocal microscopy, and rates of protein turnover were determined by treating the cells with cycloheximide and measuring protein expression on Western blots over 18 h. Panel A: hRFC proteins from crude plasma membranes from the stable clones and hRFC null K500 cell line were measured by Western blotting using an anti-HA primary and IRDye™ 800-conjugated secondary antibody (top panel). hRFC proteins were deglycosylated with N-glycosidase F prior to Western blot analysis (lower panel). The arrows indicate the approximate sizes for the different hRFC proteins isoforms. Panel B: Confocal microscopy of hRFC was used to demonstrate localization to the plasma membrane for the wild type protein (11-hRFC) and the alternate A-hRFC protein isoform (kmAV-hRFC). Cells were fixed with 3.3% paraformaldehyde, permeabilized with 0.1% Triton X-100, incubated with mouse anti-HA primary antibody, followed by anti-mouse IgG-Alexa Fluor 488-conjugated secondary antibody, and spun onto microscope slides. Slides were visualized with a Zeiss laser scanning microscope 310 using a x63 water immersion lens. Panel C: hRFC protein turnover was determined for the wild type carrier (11-hRFC) and the alternate hRFC isoform (kmAV-hRFC). Stable clones were treated with cycloheximide (0.2 mg/ml), and membrane fractions were isolated over 18 h, after which the membrane fractions were analyzed by Western blotting. For both 11-hRFC and kmAV-hRFC, approximately 50% of the hRFC protein decreased over 16 h.
Initial rates of 3H-MTX uptake were assayed over a range of concentrations for the 11-hRFC and kmAV-hRFC transfectants to compare kinetic constants for the wild type hRFC and the hRFC-A protein isoform initiated from the uAUG in exon A. As summarized in Table 3, there were no significant differences in the absolute Vmax or Kt values for MTX uptake. However, when normalized for the slight difference in expression on Westerns (see above), there is a modest increase (~35%) in Vmax for the hRFC-A protein. By Dixon analyses, Kis were calculated for a number of folate and antifolate substrates including raltitrexed, pemetrexed, GW1843U89, leucovorin, and folic acid. There were no significant differences between the 11-hRFC and kmAV-hRFC transfected cells in the calculated Kis (Table 3).
Table 3.
Kinetic constants for 11-hRFC and kmAV-hRFC clones.
| Parameter | Substrate | 11-hRFC | kmAV-hRFC |
|---|---|---|---|
| Kt (μM) | MTX | 2.17 ± 0.24 | 2.35 ± 0.25 |
| Vmax pmol/mg/3min | MTX | 18.7 ± 1.28 | 18.2 ± 2.06 |
| Vmax/Kt | MTX | 8.6 | 7.74 |
| Ki (μM) | Raltitrexed | 5.84 ± 0.85 | 5.92 ± 0.29 |
| Ki (μM) | Pemetrexed | 9.75 ± 1.08 | 8.03 ± 0.57 |
| Ki (μM) | GW1843U89 | 2.23 ± 0.169 | 1.17 ± 0.12 |
| Ki (μM) | Leucovorin | 12.8 ± 1.81 | 11 ± 0.48 |
| Ki (μM) | Folic Acid | 102 ± 12 | 85 ± 25 |
Kinetic constants were determined using Lineweaver-Burke and Dixon plots for the 11-hRFC and kmAV-hRFC transfectants, using 3H-MTX. The data shown are the mean values from three or more experiments ± SE.
Conclusions
hRFC transcript levels are subject to tissue-specific controls at the level of transcription and involve use of alternate promoters [14-18], reflecting levels and posttranslational modifications of transcription factors and/or effects of chromatin remodeling. We now show that posttranscriptional mechanisms can also be important, via use of alternate, variably spliced non-coding regions that result in transcript forms with differences in stabilities and propensities for 5’ cap-dependent translation, and/or that encode modified hRFC proteins. Although the effects of 5’UTR usage on steady state hRFC transcripts and proteins for several 5’UTRs appeared to be subtle and could be overshadowed by differences in promoter activities, for the 5’UTRs derived from several of the non-coding regions including A1/A2, A, and D, there were profound decreases in these parameters compared to other 5’UTRs. The biological significance of the N-terminally modified hRFC proteins translated from the A1/A2 [4] and A 5’UTRs is unclear, however, these may be especially important for tissues that express high levels of these transcript and protein forms.
An important goal of future studies involves identification of putative physiologic effectors of hRFC transcriptional and posttranscriptional regulation, including dietary folates and/or other tissue-specific stimuli. Defects involving these processes may significantly impact net hRFC levels and activity in vivo, including specialized tissue functions involved with reduced folate cofactors, thus contributing to the pathophysiology of folate deficiency (e.g., fetal abnormalities, cardiovascular disease, and cancer). Our recent results suggest that levels of hRFC-B transcripts are prognostic in children diagnosed with ALL whereas hRFC-A1/A2 transcripts are not [26], in support of the notion that differences in posttranscriptional factors may represent important determinants of clinical responses to MTX chemotherapy, as well.
Acknowledgments
We thank Dr. I. David Goldman for his generous gift of the R5 HeLa cell line. This study was supported by grant CA53535 from the National Cancer Institute, National Institutes of Health.
Footnotes
The nucleotide sequences for non-coding regions A1, A2, C, D, and E appear in GenBank and EMBL databases with accession numbers, AY089985, AY089986, AY089987, and AY089988. AY89985 for non-coding regions A1 and A2 has been amended to denote a single A1/A2 non-coding region contiguous with coding exon 1. Exons A and B appear under accession number AF046920. All numbering for both constructs and sequence corresponds to the negative distance upstream from the ATG translational start site in coding exon 1 and is based on the nucleotide sequence of chromosome 21 contig HS21C102 (accession # AL163302).
Publisher's Disclaimer: This is a PDF file of an unedited manuscript that has been accepted for publication. As a service to our customers we are providing this early version of the manuscript. The manuscript will undergo copyediting, typesetting, and review of the resulting proof before it is published in its final citable form. Please note that during the production process errors may be discovered which could affect the content, and all legal disclaimers that apply to the journal pertain.
References
- 1.Matherly LH, Goldman ID. Membrane transport of folates. Vitam Horm. 2003;66:404–456. doi: 10.1016/s0083-6729(03)01012-4. [DOI] [PubMed] [Google Scholar]
- 2.Whetstine JR, Flatley RM, Matherly LH. The human reduced folate carrier gene is ubiquitously and differentially expressed in normal human tissues: identification of seven noncoding exons and characterization of a novel promoter. Biochem J. 2002;367:629–640. doi: 10.1042/BJ20020512. [DOI] [PMC free article] [PubMed] [Google Scholar]
- 3.Zhao R, Goldman ID. Resistance to antifolates. Oncogene. 2003;47:7431–7457. doi: 10.1038/sj.onc.1206946. [DOI] [PubMed] [Google Scholar]
- 4.Flatley RM, Payton SG, Taub JW, Matherly LH. Primary acute lymphoblastic leukemia cells use a novel promoter and 5’non-coding exon for the human reduced folate carrier that encodes a modified carrier translated from an upstream translational start. Clin Cancer Res. 2004;10:5111–5222. doi: 10.1158/1078-0432.CCR-04-0116. Erratum in: 2005 Clin. Cancer Res. 20:7586. [DOI] [PubMed] [Google Scholar]
- 5.Ayoubi TAY, van de Ven WJM. Regulation of gene expression by alternative promoters. FASEB J. 1996;10:453–460. [PubMed] [Google Scholar]
- 6.Fry DW, Yalowich JC, Goldman ID. Rapid formation of poly-gamma-glutamyl derivatives of methotrexate and their association with dihydrofolate reductase as assessed by high pressure liquid chromatography in the Ehrlich ascites tumor cell in vitro. J Biol Chem. 1982;257:1890–1896. [PubMed] [Google Scholar]
- 7.Wong SC, McQuade R, Proefke SA, Matherly LH. Human K562 transfectants expressing high levels of reduced folate carrier but exhibiting low transport activity. Biochem Pharmacol. 1997;53:199–206. doi: 10.1016/s0006-2952(96)00710-1. [DOI] [PubMed] [Google Scholar]
- 8.Wong SC, Zhang L, Proefke SA, Matherly LH. Effects of loss of capacity for N-glycosylation on the transport activity and cellular localization of the human reduced folate carrier. Biochim Biophys Acta. 1998;1375:6–12. doi: 10.1016/s0005-2736(98)00118-7. [DOI] [PubMed] [Google Scholar]
- 9.Zhao R, Chattopadhyay S, Hanscom M, Goldman ID. Antifolate resistance in a HeLa cell line associated with impaired transport independent of the reduced folate carrier. Clin Cancer Res. 2004;10:8735–8742. doi: 10.1158/1078-0432.CCR-04-0932. [DOI] [PubMed] [Google Scholar]
- 10.Hou Z, Stapels SE, Haska CL, Matherly LH. Localization of a substrate binding domain of the human reduced folate carrier to transmembrane domain 11 by radio affinity labeling and cysteine-substituted accessibility methods. J Biol Chem. 2005;280:36206–36213. doi: 10.1074/jbc.M507295200. [DOI] [PubMed] [Google Scholar]
- 11.Horton RM, Cai ZL, Ho SN, Pease LR. Gene splicing by overlap extension: tailor-made genes using the polymerase chain reaction. Biotechniques. 1990;8:528–535. [PubMed] [Google Scholar]
- 12.Wong SC, Proefke SA, Bhushan A, Matherly LH. Isolation of human cDNAs that restore methotrexate sensitivity and reduced folate carrier activity in methotrexate transport-defective Chinese hamster ovary cells. J Biol Chem. 1995;270:17468–17475. doi: 10.1074/jbc.270.29.17468. [DOI] [PubMed] [Google Scholar]
- 13.Wong SC, Zhang L, Witt TL, Proefke SA, Bhushan A, Matherly ALH. Impaired methotrexate transport in methotrexate resistant CCRF-CEM cells involves early translation termination and increased turnover of a mutant reduced folate carrier. J Biol Chem. 1999;274:10388–10394. doi: 10.1074/jbc.274.15.10388. [DOI] [PubMed] [Google Scholar]
- 14.Whetstine JR, Matherly LH. The basal promoters for the human reduced folate carrier gene are regulated by a GC-box and a cAMP-response element/AP-1-like element. Basis for tissue-specific gene expression. J Biol Chem. 2001;276:6350–6358. doi: 10.1074/jbc.M008074200. [DOI] [PubMed] [Google Scholar]
- 15.Whetstine JR, Witt TL, Matherly LH. The human reduced folate carrier gene is regulated by the AP2 and Sp1 transcription factor families and a 61 base pair polymorphism. J Biol Chem. 2002;277:43873–4380. doi: 10.1074/jbc.M208296200. [DOI] [PubMed] [Google Scholar]
- 16.Liu M, Whetstine JR, Payton SG, Ge Y, Flatley RM, Matherly LH. Roles of USF, Ikaros, and Sp proteins in the transcriptional regulation of the human reduced folate carrier B promoter. Biochem J. 2004;383:249–257. doi: 10.1042/BJ20040414. [DOI] [PMC free article] [PubMed] [Google Scholar]
- 17.Payton SG, Liu M, Ge Y, Matherly LH. Transcriptional regulation of the human reduced folate carrierA1/A2 promoter: identification of critical roles for the USF and GATA families of transcription factors. Biochim Biophys Acta. 2005;1731:115–124. doi: 10.1016/j.bbaexp.2005.08.010. [DOI] [PubMed] [Google Scholar]
- 18.Payton SG, Whetstine JR, Ge Y, Matherly LH. Transcriptional regulation of the human reduced folate carrier gene promoter C; synergistic transactivation by Sp1 and C/EBPβ and identification of a downstream repressor. Biochim Biophys Acta. 2005;1727:45–57. doi: 10.1016/j.bbaexp.2004.11.006. [DOI] [PubMed] [Google Scholar]
- 19.Gray NK, Wickens MP. Control of translation initiation in animals. Annu Rev Cell Dev Biol. 1998;14:399–458. doi: 10.1146/annurev.cellbio.14.1.399. [DOI] [PubMed] [Google Scholar]
- 20.Kozak M. Pushing the limits of the scanning mechanism for initiation of translation. Gene. 2002;299:1–34. doi: 10.1016/S0378-1119(02)01056-9. [DOI] [PMC free article] [PubMed] [Google Scholar]
- 21.Dever TE. Gene specific regulation by translation factors. Cell. 2002;108:545–556. doi: 10.1016/s0092-8674(02)00642-6. [DOI] [PubMed] [Google Scholar]
- 22.Pesole G, Mignone F, Gissi C, Grillo G, Licciulli F, Liuni S. Structural and functional features of eukaryotic mRNA untranslated regions. Gene. 2001;276:73–81. doi: 10.1016/s0378-1119(01)00674-6. [DOI] [PubMed] [Google Scholar]
- 23.Zuker M. Mfold web server for nucleic acid folding and hybridization prediction. Nucleic Acids Res. 2003;31:3406–3415. doi: 10.1093/nar/gkg595. [DOI] [PMC free article] [PubMed] [Google Scholar]
- 24.Kozak M M. Initiation of translation in prokaryotes and eukaryotes. Gene. 1999;234:187–208. doi: 10.1016/s0378-1119(99)00210-3. [DOI] [PubMed] [Google Scholar]
- 25.Guhaniyogi J, Brewer G. Regulation of mRNA stability in mammalian cells. Gene. 2001;265:11–23. doi: 10.1016/s0378-1119(01)00350-x. [DOI] [PubMed] [Google Scholar]
- 26.Ge Y, Haska CL, LaFiura K, Devidas M, Linda SB, Liu M, Thomas R, Taub JW, Matherly LH. Prognostic role of the reduced folate carrier, the major membrane transporter for methotrexate, in childhood acute lymphoblastic leukemia: a report from the Children’s Oncology Group. Clin Cancer Res. doi: 10.1158/1078-0432.CCR-06-2145. in press. [DOI] [PubMed] [Google Scholar]