Abstract
INTRODUCTION
The role of inflammatory markers in the diagnosis of acute appendicitis has not been clearly defined. The aims of this prospective audit were to define the role of the serum markers of inflammation total white cell count, neutrophil count and C-reactive protein in the diagnosis of acute appendicitis with particular reference to the discrimination between uncomplicated and complicated appendicitis, and the prediction of abscess.
PATIENTS AND METHODS
The author compiled a prospective database over a 13-month period of all appendicectomies performed. After five exclusions (three having no notes for review and two having confounding second morbidity in the presence of a normal appendix), the data relating to 75 patients were analysed.
RESULTS
In patients judged on clinical grounds to require laparotomy for suspected acute appendicitis, white cell count and neutrophil count distinguish acute appendicitis from normal appendices when used as categorical variables, though they do not reflect the presence of abscess. C-reactive protein neither distinguishes appendicitis from normal, nor predicts abscess when used as a categorical variable, though higher levels suggest abscess.
CONCLUSIONS
Laboratory tests of the white cell count, neutrophil count and C-reactive protein are more effective in supporting a clinical diagnosis of acute appendicitis in patients with typical clinical features than in excluding the diagnosis.
Keywords: Appendicitis, Inflammatory markers, Audit
Supplementary measures designed to improve diagnostic accuracy include scoring systems,1–5 computer-aided analysis,6 laparoscopy7,8 and radiological imaging.9 Though novel inflammatory markers including interleukin-6 have been assessed with little additional merit,10–12 the most commonly used are total white cell count (WCC), neutrophil count (NC) and C-reactive protein (CRP).
A recent meta-analysis has attempted to address the role of both clinical features and inflammatory markers in the diagnosis of acute appendicitis.13 The author concluded that: ‘elements of the disease history, clinical findings and results of laboratory tests are weak individual discriminators of appendicitis. However, in combination, they provide high discriminatory power.’ Although the data presented did indeed demonstrate poor isolated performance for WCC, NC and CRP in discriminating normal from acute appendices, there is little to support the main conclusion. Only one analysis (based a previous paper by the author14) addresses the combination of clinical and laboratory factors on diagnosis. It would, however, be correct to state that, in combination, inflammatory markers appear to have a higher discriminatory capacity, although the results are based on only four papers.
Patients and Methods
Between 5 October 2000 and 2 November 2003, the author performed 80 appendicectomies for a clinical diagnosis of appendicitis. A prospective database was held detailing demographic data, pre-operative inflammatory markers, operative findings, histological results, complications and outcomes relating to 80 consecutive patients operated upon for clinical appendicitis. No identifying patient data were recorded aside from hospital numbers. All information was stored in a password-protected database. Patients of all age groups were included.
Of the 80 patients operated upon, five were excluded. Three patients had no notes available for review subsequent to discharge. Two patients were excluded due to confounding second pathologies in the presence of a normal appendix (one female with a ruptured ovarian cyst and one male with sigmoid colonic diverticulitis).
The 75 patients (38 female, 37 male) were from all age groups. There was no significant difference (Mann-Whitney U-test, P = 0.518) between the age distributions of the male and female groups (median age female 23 years, range 7–65 years; male 22 years, range 9–70 years). The decision to operate was made based on a combination of clinical and laboratory factors by the admitting surgical team. Clinicians assessing the patients had access to their inflammatory markers.
Three markers were studied: total white cell count (Beckman-Coulter GENS), neutrophil count (Beckman-Coulter GENS) and C-reactive protein (Roche 917 clinical chemical analyser. Absolute values and values as per our laboratory reference ranges were used. Because the upper limit of normal for the total WCC differs with age and sex within our laboratory, for the purpose of analysis:
Thus: upper limit of normal = 0; raised value, positive test < 0; and reduced value, normal test > 0. The NC was common to all groups with an upper reference value of 7.5 × 10⁹ per l. CRP was assayed with an upper reference value of 12 mg/l.
Fourteen patients did not have a pre-operative CRP assay (8 male, 6 female; average age 16 years, range 9–36 years). Ten patients did not have a pre-operative full blood count (6 male, 4 female; average age 15 years, range 9–36 years).
Of 75 appendices, 58 were confirmed to represent three grades of acute appendicitis. Seventeen were normal. Histologically, the appendices were categorised as: (i) normal (n = 17), no evidence of inflammatory infiltrate; (ii) acute uncomplicated (n = 44), inflammatory infiltrate of the muscularis without peritonitis; (iii) acute complicated (n = 13), perforation or necrosis; and (iv) acute-on-chronic (n = 1). Two patients (female 39 years, male 36 years) demonstrated carcinoid tumours of the appendix.
Statistical analysis
Four methods of statistical analysis were used: (i) categorical data were analysed using Fisher's exact test; (ii) interval data were analysed for normality using Levene's test and for variance using the Shapiro-Wilks test; (iii) parametric data were analysed using Student's t-test and a one-way ANOVA with post-hoc LSD testing; and (iv) non-parametric data were analysed using the Mann-Whitney U and Kruskal-Wallis tests
A P-value of < 0.05 was taken to be statistically significant for all tests.
Relationship between histological grade, abscess and inflammatory markers
The following relationships were assessed:
Absolute inflammatory marker levels and the histological category of the appendix.
Markers and appendices in terms of ‘test high/normal’ versus ‘appendix normal or abnormal’ (in which abnormal appendices were pooled).
Between inflammatory markers and abscess for absolute levels and ‘test normal/abnormal’
‘Abscess’ was defined macroscopically at laparotomy as an enclosed collection of purulent fluid.
Results
Inflammatory markers and appendicitis
Absolute values for WCC and NC were analysed with a one-way ANOVA, using LSD post-hoc testing for subgroup comparisons. CRP did not conform to a normal distribution in all groups; therefore, a Kruskal-Wallis test was performed. The results are displayed graphically in Figures 1–3 and analysed in Table 1.
Figure 1.
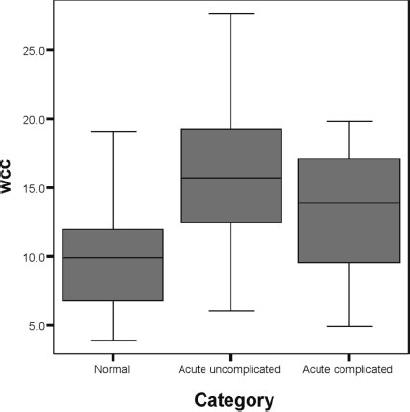
Absolute white cell count by category of appendix.
Figure 3.
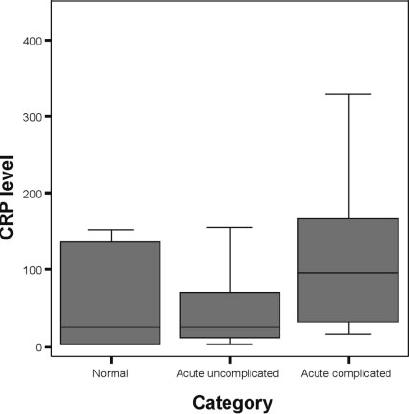
Absolute C-reactive protein level by category of appendix.
Table 1.
Markers versus appendicitis
| Absolute values (Figs 1–3) | Categorical | |||
|---|---|---|---|---|
| Marker | Overall P-value | Subgroup | P-value | Fisher's exact test P-value |
| WCC | ANOVA 0.001 | Normal – acute uncomplicated | < 0.001 | 0.003 |
| Normal – acute complicated | 0.048 | |||
| Acute uncomplicated – acute complicated | 0.168 | |||
| Neutrophil count | ANOVA 0.001 | Normal – acute uncomplicated | < 0.001 | 0.004 |
| Normal – acute complicated | 0.30 | |||
| Acute uncomplicated – acute complicated | 0.208 | |||
| C-reactive protein | Kruskal-Wallis 0.075 | 0.184 | ||
Figure 2.
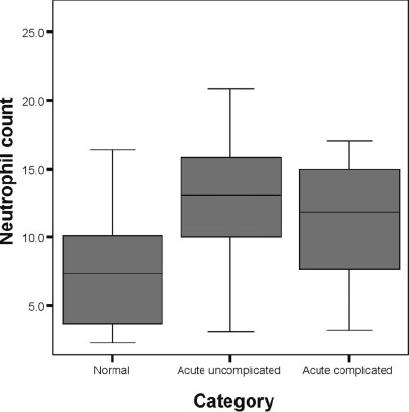
Absolute neutrophil count by category of appendix.
Inflammatory markers were assessed as ‘test positive/negative’ against laboratory reference ranges for distinction between normal and abnormal (pooled) appendices. Data were analysed using the Fisher exact test (Table 1).
Odds ratios were calculated for the three markers individually and in combination and are presented in Table 2. This simply expresses the ratio of the odds of having appendicitis when the test is positive and when it is not. For example, an OR of 7 for WCC in males suggests that a male (with clinical features of appendicitis requiring laparotomy and a WCC above the reference limit) is 7 times as likely to have appendicitis as a normal appendix.
Table 2.
Odds ratios and 95% confidence intervals for appendicitis based on categorical test results
| Marker | Generic | Male | Female | |||
|---|---|---|---|---|---|---|
| OR | 95% CI | OR | 95% CI | OR | 95% CI | |
| WCC | 7 | 2–25 | 17 | 1.4–210 | 4 | 0.8–18 |
| NC | 8.5 | 2.2–30 | 8 | 0.8–80 | 5.7 | 1.1–28 |
| CRP | 2.5 | 0.7–9 | 3 | 0.3–28 | 2.2 | 0.5–11 |
| WCC and NC | 9 | 2.25–35 | 15 | 1–>100 | 6 | 1.1–32 |
| WCC and CRP | 12 | 2–71 | 17 | 1–>100 | 12 | 0.9–>100 |
| NC and CRP | 16 | 2.4–>100 | 17 | 1–>100 | 15 | 1.1–>100 |
| All three | 18 | 2.6–>100 | 34 | 1.5–>100 | 12 | 0.9–>100 |
Inflammatory markers and abscess
Markers were examined against the presence or absence of an abscess using absolute levels (Figs 4–6) and ‘test normal or abnormal’ (Table 3). Masses without abscess (2 patients) were categorised as no abscess for analysis.
Figure 4.
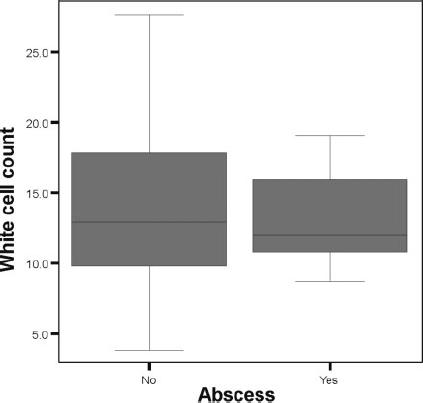
White cell count versus abscess.
Figure 6.
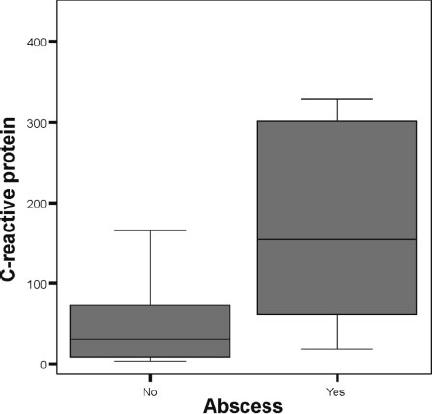
C-reactive protein level versus abscess.
Table 3.
Markers versus abscess
| Absolute values | Categorical | ||
|---|---|---|---|
| Marker | Test | P-value | Fisher's exact test |
| White cell count | Student's | 0.756 | 0.258 |
| Neutrophil count | Student's | 0.910 | 0.804 |
| C-reactive protein level | Mann-Whitney U | 0.003 | 0.159 |
Figure 5.
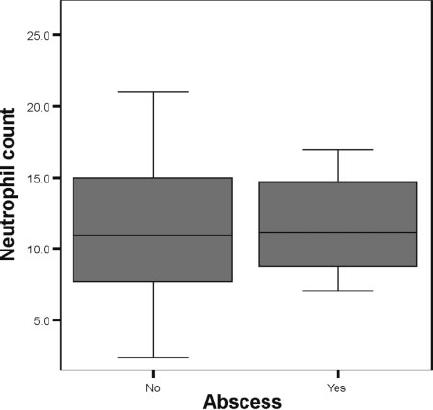
Neutrophil count versus abscess.
As has been reflected in the diversity of approaches taken to analysing the relationship between the diagnosis of acute appendicitis and inflammatory markers, a number of other methods may be used in order to quantify the diagnostic merit of a test or combination of tests. Interpretations of the data were made using sensitivity and specificity, predictive values, odds ratios and likelihood ratios based on Bayes' theorem. P-values were calculated to test null hypotheses for both categorical and interval data.
LIKELIHOOD RATIOS
The likelihood ratio is an evolution of simple sensitivity and specificity. It exists in two forms for the data described – the likelihood ratio of having appendicitis given a positive test result (LR+) and the likelihood ratio of having appendicitis given a negative test result (LR−). A value of greater than one implies greater likelihood, and a value of less than one a lesser likelihood.
PROBABILITIES USING BAYES' THEOREM
The prevalence of appendicitis within the sample and likelihood ratios for appendicitis given a categorical test result were calculated. These were combined to give the probability of appendicitis in a patient who clinically required laparotomy for appendicitis, taking into account the results of inflammatory markers. Because the number of patients varied between tests (i.e. not all patients had all tests), the prevalence varied between sub-groups.
First, the prevalence for each test was calculated:
This allows for the calculation of the odds of having appendicitis based on clinical suspicion, prior to the results of the inflammatory markers:
The positive post-test odds (PPTO) provides the odds of having appendicitis after the results of the inflammatory markers are taken into account:
Conversely, the negative post-test odds (NPTO) provide the odds of having appendicitis given a negative test result:
These odds may be converted to probabilities:
Within this study, the most important decision is whether or not to operate on a patient with clinical features of acute appendicitis. It is, therefore, essential that we know the probability of having a normal appendix given a negative test result, rather than the probability of having appendicitis given a negative test result. Consequently for negative probability, the value is subtracted from 1:
The results are summarised in Table 4.
Table 4.
Diagnostic attributes of tests in distinguishing normal from abnormal appendices
| Sensitivity | Specificity | PPV | NPV | LR+ | LR− | Negative post-test probability (%)* | ||
|---|---|---|---|---|---|---|---|---|
| Generic | WCC | 0.78 | 0.67 | 0.89 | 0.48 | 2.34 | 0.33 | 48 |
| NC | 0.86 | 0.57 | 0.88 | 0.53 | 2.01 | 0.24 | 53 | |
| CRP | 0.77 | 0.43 | 0.82 | 0.35 | 1.34 | 0.55 | 35 | |
| WCC and NC | 0.85 | 0.62 | 0.89 | 0.53 | 2.20 | 0.25 | 53 | |
| WCC and CRP | 0.91 | 0.56 | 0.88 | 0.63 | 2.04 | 0.17 | 63 | |
| NC and CRP | 0.94 | 0.50 | 0.86 | 0.71 | 1.88 | 0.12 | 71 | |
| All three | 0.94 | 0.56 | 0.88 | 0.71 | 2.10 | 0.12 | 71 | |
| Male | WCC | 0.85 | 0.75 | 0.96 | 0.43 | 3.41 | 0.20 | 43 |
| NC | 0.89 | 0.50 | 0.92 | 0.40 | 1.78 | 0.22 | 40 | |
| CRP | 0.76 | 0.50 | 0.90 | 0.25 | 1.52 | 0.48 | 25 | |
| WCC and NC | 0.88 | 0.67 | 0.96 | 0.40 | 2.65 | 0.17 | 40 | |
| WCC and CRP | 0.89 | 0.67 | 0.94 | 0.50 | 2.68 | 0.16 | 50 | |
| NC and CRP | 0.94 | 0.50 | 0.89 | 0.67 | 1.89 | 0.11 | 67 | |
| All three | 0.94 | 0.67 | 0.94 | 0.67 | 2.83 | 0.08 | 67 | |
| Female | WCC | 0.70 | 0.64 | 0.80 | 0.50 | 1.91 | 0.48 | 50 |
| NC | 0.83 | 0.55 | 0.79 | 0.60 | 1.82 | 0.32 | 60 | |
| CRP | 0.77 | 0.40 | 0.74 | 0.44 | 1.29 | 0.57 | 44 | |
| WCC and NC | 0.80 | 0.60 | 0.80 | 0.60 | 2.00 | 0.33 | 60 | |
| WCC and CRP | 0.92 | 0.50 | 0.80 | 0.75 | 1.85 | 0.15 | 75 | |
| NC and CRP | 0.94 | 0.50 | 0.83 | 0.75 | 1.88 | 0.13 | 75 | |
| All three | 0.92 | 0.50 | 0.80 | 0.75 | 1.85 | 0.15 | 75 |
Probability of having a normal appendix given a normal test result.
Discussion
The data in this study would support the conclusion that inflammatory markers are supportive of the diagnosis of appendicitis during the assessment of patients felt clinically to require laparotomy for acute appendicitis. When used individually, both the absolute and categorical WCC and NC distinguish normal appendices from acute appendicitis, though they do not distinguish uncomplicated from complicated appendices. Neither do they individually predict abscess when used as absolute or categorical variables.
CRP has no definite value for predicting acute appendicitis in either its absolute or categorical forms, though a significantly elevated level is strongly suggestive of abscess.
The greatest odds ratio for generic diagnosis was obtained using all three markers (WC, NC and CRP) in combination (OR = 18). The considerable variability in the confidence 95% CI limits (2.6–>100) is probably reflective of the small sample size.
In males, three markers gave an OR of 34 (1.5–>100). In females the greatest OR was 15 (1.1–>100), making inflammatory markers less effective in supporting the diagnosis of acute appendicitis in females.
In terms of excluding appendicitis in the patient felt clinically to require laparotomy, the inflammatory markers were less effective. Normal values for WCC, NC and CRP excluded appendicitis with a 71% probability in a generic context, 67% in males and 75% in females.
Conclusions
Laboratory tests of the white cell count, neutrophil count and C-reactive protein are more effective in supporting a clinical diagnosis of acute appendicitis in patients with typical clinical features than in excluding the diagnosis.
References
- 1.Gallego MG, Fadrique B, Nieto MA, Calleja S, Fernandez-Acenero MJ, Ais G, et al. Evaluation of ultrasonography and clinical diagnostic scoring in suspected acute appendicitis. Br J Surg. 1998;85:37–40. doi: 10.1046/j.1365-2168.1998.00543.x. [DOI] [PubMed] [Google Scholar]
- 2.Teicher I, Landa B, Cohen M, Kabnick L, Wise L. Scoring system to aid in diagnosis of appendicitis. Ann Surg. 1983;198:753–9. doi: 10.1097/00000658-198312000-00014. [DOI] [PMC free article] [PubMed] [Google Scholar]
- 3.Christian F, Christian GP. A simple scoring system to reduce the negative appendicectomy rate. Ann R Coll Surg Engl. 1992;74:281–5. [PMC free article] [PubMed] [Google Scholar]
- 4.Kalan M, Talbot D, Cunliffe WJ, Rich AJ. Evaluation of the modified Alvarado score in the diagnosis of acute appendicitis: a prospective study. Ann R Coll Surg Engl. 1994;76:418–9. [PMC free article] [PubMed] [Google Scholar]
- 5.Ramirez JM, Deus J. Practical score to aid decision making in doubtful cases of appendicitis. Br J Surg. 1994;81:680–3. doi: 10.1002/bjs.1800810516. [DOI] [PubMed] [Google Scholar]
- 6.Alvarado A. A practical score for the early diagnosis of acute appendicitis. Ann Emerg Med. 1986;15:557–65. doi: 10.1016/s0196-0644(86)80993-3. [DOI] [PubMed] [Google Scholar]
- 7.Van Way CW, Murphy JR, Dunn EL, Elerding SC. A feasibility study of computer aided diagnosis in appendicitis. Surg Gynecol Obstet. 1982;155:685–8. [PubMed] [Google Scholar]
- 8.Paterson-Brown S, Thompson JN, Eckersley JRT, Ponting GA, Dudley HAF. Which patients with suspected appendicitis should undergo laparoscopy? BMJ. 1988;296:1363–4. doi: 10.1136/bmj.296.6633.1363-a. [DOI] [PMC free article] [PubMed] [Google Scholar]
- 9.Leape LL, Ramenofsky ML. Laparoscopy for questionable appendicitis: can it reduce the negative appendectomy rate? Ann Surg. 1980;191:410–3. doi: 10.1097/00000658-198004000-00004. [DOI] [PMC free article] [PubMed] [Google Scholar]
- 10.Hoffmann J, Rasmussen OO. Aids in the diagnosis of acute appendicitis. Br J Surg. 1989;76:774–9. doi: 10.1002/bjs.1800760803. [DOI] [PubMed] [Google Scholar]
- 11.Eriksson S, Granstrom L, Olander B, Wretlind B. Sensitivity of interleukin-6 and C-reactive protein concentrations in the diagnosis of acute appendicitis. Eur J Surg. 1995;161:41–5. [PubMed] [Google Scholar]
- 12.Erkasap S, Ates E, Ustuner Z, Sahin A, Yilmaz S, Yasar B, et al. Diagnostic value of interleukin-6 and C-reactive protein in acute appendicitis. Swiss Surg. 2000;6:169–72. doi: 10.1024/1023-9332.6.4.169. [DOI] [PubMed] [Google Scholar]
- 13.Andersson REB. Meta-analysis of the clinical and laboratory diagnosis of appendicitis. Br J Surg. 2004;91:28–37. doi: 10.1002/bjs.4464. [DOI] [PubMed] [Google Scholar]
- 14.Andersson REB, Hugander AP, Ghazi SH, Ravn H, Offenbartl SK, Nystrom PO, et al. Diagnostic value of disease history, clinical presentation, and inflammatory parameters of appendicitis. World J Surg. 1999;23:133–40. doi: 10.1007/pl00013174. [DOI] [PubMed] [Google Scholar]


