Abstract
INTRODUCTION
By the time of diagnosis, sarcomas have frequently reached a large size and many patients have a long history of symptoms prior to diagnosis. The aim of this study was to assess whether size of tumour at presentation or duration of symptoms was a significant factor affecting outcome.
PATIENTS AND METHODS
A prospective database recording patient, tumour, treatment and outcome factors was reviewed. A total of 1460 patients with newly diagnosed sarcomas and with > 3 years of follow-up were included for analysis.
RESULTS
The mean size of sarcomas presenting to our unit was 10.7 cm at the time of diagnosis. Bone sarcomas averaged 11.3 cm with little variation by age or diagnosis, whilst subcutaneous soft tissue sarcomas averaged 10 cm. The incidence of metastases at diagnosis increased almost linearly with increasing size and the prognosis, even for patients without metastases at diagnosis became steadily worse with increasing size for all tumours, independent of other factors. Duration of symptoms did not correlate with size but patients with symptoms > 1 year had a slightly better prognosis than those with a shorter duration.
CONCLUSIONS
The author makes a plea for greater awareness of potential malignancy in lumps and bumps, particularly those over the size of a golf ball (4.27 cm), making the point that the smaller the tumour at diagnosis the better the prognosis.
Keywords: Sarcoma, Size, Symptoms, Prognosis
Recent papers by de Boer et al.1 and others2 about late presentation of testicular cancer caused me to reflect on the similarities with another rare type of cancer–sarcomas.
Sarcomas represent only 1% of the total burden of malignancy in the population and because of their rarity are not commonly encountered by members of the medical profession: indeed, most members of the public will not even be aware they exist. There are approximately 450 new bone sarcomas a year diagnosed in the UK and about 1500 soft tissue sarcomas. Whilst there are three principal bone sarcomas (osteosarcoma, Ewing's sarcoma and chondrosarcoma) there are a large number of described soft tissue sarcomas (liposarcoma, leiomyosarcoma, fibrosarcoma, MFH, synovial sarcoma, etc.).
It is a frequent observation that sarcomas present late and many will have reached a considerable size by the time of diagnosis. The purpose of this paper is to analyse the size and duration of symptoms for different sarcomas at presentation and to see if size matters in prognosis.
Patients and Methods
A prospective computerised database was established at the Royal Orthopaedic Hospital Oncology Service in 1986 since when all patients referred to the unit have had data collected on patient, tumour, treatment and outcome factors. Patients treated prior to that date had data recorded retrospectively. Details of size at presentation was available for 1460 patients with newly diagnosed sarcomas. The data for patients with bone and soft tissue sarcomas have been analysed using Statview to investigate size of tumours and duration of symptoms at presentation related to how they present, how they were treated and outcomes. Difference between groups have been assessed using the Mann Whitney U-test. Survival was estimated using Kaplan Meier survival curves with patients censored at the time of last follow-up. Hazard ratios were estimated using a Cox model with relevant values entered either as continuous variables (e.g. age and size) or as grouped variables (e.g. size categories).
Results
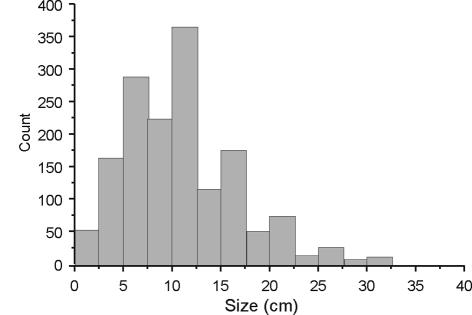
The mean size of all sarcomas at presentation was 10.7 cm and did not vary significantly between the main diagnostic categories (soft tissue sarcomas, 10 cm; osteosarcoma, 11.3 cm; chondrosarcoma, 11.7 cm; Ewing's sarcoma, 11.2 cm) whilst the range was from 0.2 cm to 45 cm. (Fig. 1). The median size for all tumours was 10 cm.
Figure 1.
Size of sarcomas at presentation (n = 1490).
The mean size at diagnosis has decreased slightly with the passage of time, more so for soft tissue sarcomas than bone sarcomas (Table 1).
Table 1.
How mean size has changed with the passage of time
| Era | All tumours (cm) | All bone tumours (cm) | All soft tissue sarcoma (cm) |
|---|---|---|---|
| Pre 1987 | 11.3 | 10.9 | 13.0 |
| 1988–1992 | 11.2 | 11.7 | 10.5 |
| 1993–1997 | 10.7 | 11.2 | 10.4 |
| 1998–2002 | 10.2 | 11.3 | 9.3 |
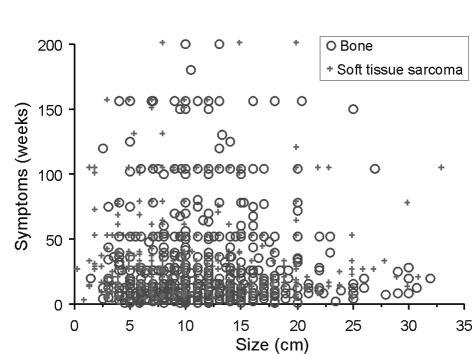
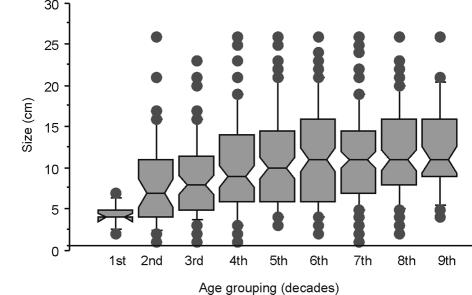
We found no relationship between duration of symptoms and size of tumours at presentation (Fig. 2). There was no association found between size and age category for bone tumours; however, there was a very significant trend for younger patients to present with smaller soft tissue sarcomas than older patients (Fig. 3). There was also a significant difference in size at presentation of subcutaneous and deep soft tissue sarcomas, with subcutaneous soft tissue sarcoma being 5.9 cm and those deep to the deep fascia being 10.9 cm (P > 0.0001).
Figure 2.
Scattergram showing size (cm) versus duration of symptoms (weeks), split by bone and soft tissue sarcomas. There was no correlation between duration of symptoms and size at presentation (R2 = 0.02).
Figure 3.
Box plot showing the median size of soft tissue sarcomas along with the 10th, 25th, 75th and 90th centiles represented by bars and outliers represented by dots. The results are split by age grouping in decades.
Size also affected surgical treatment. Patients with larger tumours were at greater risk of having an amputation as primary treatment rather than limb salvage surgery. The mean size of tumours undergoing limb salvage was 10.2 cm compared to 12.1 cm for those having an amputation (t-test, P < 0.002). Only 8% of those patients with small (< 5 cm) tumours required amputation compared to 39% of those with tumours > 25 cm.
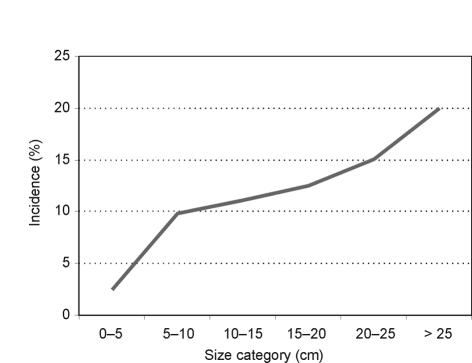
The incidence of metastases at diagnosis averaged 11.6% for all patients and was largely related to the grade of tumour at diagnosis, with high-grade tumours having the highest incidence. For soft tissue tumours, the proportion with metastases also varied according to the size of the tumour at presentation and rose from 3% in those with tumours < 5 cm to 18% in those with tumours > 25 cm (Fig. 4). This association was less marked for bone tumours.
Figure 4.
Incidence of metastases at presentation split by size categories (soft tissue sarcoma data).
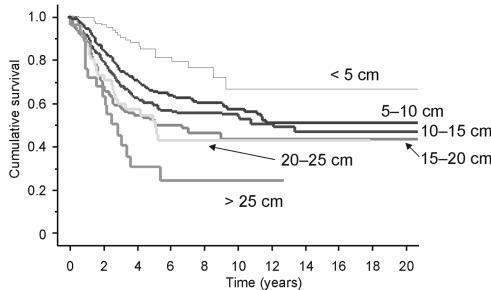
The effect of size on survival was then investigated for all patients with non-metastatic sarcomas at diagnosis. Splitting the sarcomas into 6 subsets of increasing size at 5 cm increments showed the size was a significant prognostic factor (Fig. 5). Univariate analysis taking size as the only prognostic factor showed the increasing risks of death as size increases (Table 2). A patient with a > 25 cm tumour has an 8.5 times greater risk of dying than a patient with a tumour < 5 cm at diagnosis.
Figure 5.
Kaplan Meier survival curve showing the overall survival split by size category at presentation (patients with metastases at diagnosis not included).
Table 2.
Significance of size as a prognostic factor on overall survival for potentially curable patients without metastases at diagnosis
| Size category | All tumours | Soft tissue sarcoma only | Bone tumours |
|---|---|---|---|
| Up to 5 cm | 1 | 1 | 1 |
| Up to 10 cm | 2.195 (P = 0.012) | 2.889 (P = 0.0002) | 1.772 (P = 0.22) |
| Up to 15 cm | 2.717 (P < 0.0001) | 3.516 (P < 0.0001) | 2.406 (P = 0.057) |
| Up to 20 cm | 3.682 (P < 0.0001) | 4.463 (P < 0.0001) | 3.329 (P = 0.0113) |
| Up to 25 cm | 3.662 (P < 0.0001) | 3.944 (P < 0.0001) | 3.390 (P = 0.0236) |
| Over 25 cm | 6.104 (P < 0.0001) | 8.531 (P < 0.0001) | 5.040 (P = 0.0038) |
Figures show the hazard ratio and significance value.
The overall significance of various presenting features as a prognostic factor was then calculated for all tumour types using a Cox proportional hazard method (Table 3). Metastases at diagnosis was the overall worst predictor of death (HR 3.5; P < 0.0001) and so all further calculations were done only on patients with potentially curable tumours, i.e. only including patients without metastases at diagnosis.
Table 3.
Significance of prognostic factors available at diagnosis using size and age as constant variables in a multivariate analysis
| Factor | All tumours | Soft tissue sarcoma only | Bone tumours only |
|---|---|---|---|
| Age | 1.018 | 1.016 | 1.142 |
| Size | 1.059 | 1.058 | 1.049 |
| Grade | 2.19 | 2.172 | 1.936 |
P-values all < 0.0001. Results expressed as hazard ratios (i.e. for every 1 cm increase in size, the risk of dying is increased by a factor of 1.059). Grade is split between high and low.
Duration of symptoms was also investigated as a potential prognostic factor. The median duration of symptoms from first patient-identifiable abnormality to diagnosis was 16 weeks for bone sarcomas and 26 weeks for soft tissue sarcomas. The exception to this was chondrosarcomas where patients had an average duration of symptoms of 44 weeks prior to diagnosis.
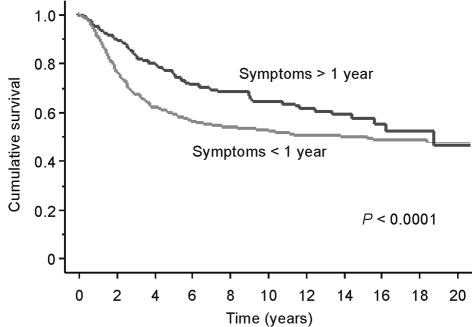
Patients with a long duration of symptoms had slightly smaller tumours (10 cm versus 11 cm; P = 0.0113) and a greater proportion were low grade (33% versus 20%). On univariate analysis, a long duration of symptoms had a slight positive impact on prognosis (HR 0.998; CI 0.996–0.999; P = 0.0016). Patients with a longer duration of symptoms did appear to have a better prognosis and this was apparent when a cut off was taken both at 6 months and 1 year (Fig. 6). On multivariate analysis taking into account size and grade, duration of symptoms lost its significance.
Figure 6.
Kaplan Meier survival curve showing survival for all sarcomas split by duration of symptoms being more or less than one year.
Discussion
Sarcomas are rare cancers, comprising in total only about 1% of all malignancy. Because of their rarity, many doctors will never (knowingly) see one in a life-time of practice. Bone tumours are comparatively well known and taught about, whilst soft tissue sarcomas feature rarely in both undergraduate and postgraduate textbooks of surgery. In those textbooks that do discuss these tumours, pathology and treatment predominate and there is usually little written about how to diagnose them.
Over the past 20 years since we started collecting data, the average size of a sarcoma at presentation has changed little. At 10.7 cm it is virtually the same size as a standard large tin of baked beans (Fig. 7) which is 10.6 cm. There has been a significant decrease in the size of soft tissue sarcomas presenting over the course of 20 years, but at 9.3 cm this is still a relatively large size, particularly when it is appreciated that the average size of breast cancer diagnosed is 2.1 cm.3
Figure 7.
A tin of baked beans is 10.2 cm long–slightly smaller than the average size of sarcomas at diagnosis.
In 2000, the UK Department of Health issued guidance about the early diagnosis of cancer.4 This guidance states that any lump that is larger than 5 cm, deep to the fascia, increasing in size or is painful has to be considered to be malignant until proved otherwise. It is still premature to assess whether this guidance is resulting in tumours being detected earlier but it is certainly helping to raise the suspicion of potential malignancy in lumps and bumps.
We have shown that the size of bone tumours averages 10 cm for all types of tumour and for all age groups. This is possibly not surprising as bone tumours virtually all originate within the bone and will grow to a certain size before they break through the bone and start elevating the periosteum. It is at this stage that the tumour will probably become symptomatic although the symptoms are often very non-specific and may initially be misleading.5 Bone pain, particularly if it is non-mechanical in nature (e.g. like toothache) is always a worrying feature, usually indicating some form of pathology such as infection or tumour and should always be investigated. By the time a tumour has grown out of the bone and becomes clearly palpable, it will probably be between 5–10 cm but, despite this, over half our patients had tumours > 10 cm by the time of diagnosis, indicating a considerable complacency both by patients and possibly doctors for lumps of this size.
For soft tissue sarcomas, it is clearly easier to detect one when it is subcutaneous and this is reflected by the size difference between deep and subcutaneous tumours. However, even deep soft tissue sarcoma averaged over 10 cm in size at diagnosis. Clearly, early diagnosis of these is difficult and, as many present as a painless lump, it is difficult to know how to raise both patient and doctor awareness of this.
We have shown no significant correlation of duration of symptoms with size. It would appear that some people are quite happy to live with asymptomatic lumps for up to 5 or more years and our experience shows that most of these patients will have been re-assured by one or more doctors during this time. A long duration of symptoms has been shown to correlate weakly with good prognosis.6 This study confirms the suggestion that this benefit is probably due to the fact that patients with a long duration of symptoms have a greater probability of having a low-grade tumour.7 Indeed, there may be an inverse relationship between symptoms and survival as some high-grade, rapidly growing tumours will present very quickly yet prove fatal whilst slow growing tumours with low metastatic potential may have a long duration of non-specific symptoms prior to the diagnosis being made.
Treatment becomes more difficult with increasing size and this was demonstrated by the increasing likelihood of amputation as size increased.
Whilst factors affecting survival following sarcoma treatment are clearly multifactorial in nature, size is certainly one of these. Treatment factors are also clearly highly relevant but will vary from tumour to tumour which is why we have simply investigated factors relevant at the time of diagnosis. Furthermore, it is one of the few factors which can be affected by the patient themselves. The smaller a tumour is at diagnosis the better the chance of cure.8–12 We have shown that for soft tissue sarcomas there is a clear relationship between survival and size but for bone tumours this is less obvious. This may well be because for most bone tumours (particularly osteosarcoma and Ewing's) treatment factors such as response to neoadjuvant chemotherapy are more significant in affecting survival than presenting features.
The fact that breast lumps average 2.1 cm at diagnosis indicates that the breast clearly has a greater awareness in people's minds than the rest of the body. Despite this, only 1 in 10 patients referred to a breast lump clinic will turn out to have malignancy, a similar figure to patients referred to lumps and bump clinics using the simple criteria of ‘any lump bigger than 5 cm needs investigating’.13,14 It is unlikely that an advertising campaign showing lumps would attract nearly as much interest as the breast awareness campaigns, yet it could be equally effective.
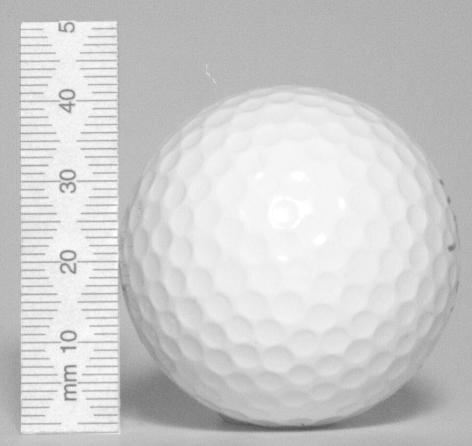
On this basis, it would seem sensible to identify a common, everyday object, slightly less than 5 cm to act as a focus for people's attention to raise awareness of possible malignancy. We have previously shown how unreliable fruit is as an indicator of size of lumps and have also shown how much better orthopaedic surgeons are at estimating the size of static objects.15 A golf ball measures 42.68 mm in diameter. It is a simple step from here to suggest that any new guideline for awareness of possible malignancy in a lump, is simply to state: ‘if a lump is bigger than a golf ball, consider it malignant until proved otherwise’ (Fig. 8).
Figure 8.
A golf ball measures 42 mm. A useful size to remember–any lump bigger than this should be considered malignant until proved otherwise.
Acknowledgments
This text is partly based upon a Hunterian Oration delivered at the Annual Meeting of the British Orthopaedic Association, September 2004.
References
- 1.de Boer HD, Haerkens MH, van der Stappen W, van Ingen G, Wobbes T. Testicular carcinoma: a postmortem diagnosis after a car crash. Lancet. 2002;359:1666. doi: 10.1016/s0140-6736(02)08591-4. [DOI] [PubMed] [Google Scholar]
- 2.Schrot RJ, Muizelaar JP. Testicular cancer: perils of very late presentation. Lancet. 2002;359:1632–4. doi: 10.1016/S0140-6736(02)08544-6. [DOI] [PubMed] [Google Scholar]
- 3.Sommer HL, Janni W, Rack E, Klanner E, Strobl B, Rammel G, et al. Average tumour size and overall survival of patients with primary diagnosis of breast cancer influenced by a more frequent use of mammography. Proc Am Soc Clin Oncol. 2003;22:867. [Google Scholar]
- 4. < http://www.dh.gov.uk/assetRoot/04/01/44/22/04014422.pdf> (accessed 20 March 2005)
- 5.Widhe B, Widhe T. Initial symptoms and clinical features in osteosarcoma and Ewing sarcoma. J Bone Joint Surg Am. 2000;82:667–74. doi: 10.2106/00004623-200005000-00007. [DOI] [PubMed] [Google Scholar]
- 6.Bacci G, Ferrari S, Longhi A, Mellano D, Giacomini S, Forni C. Delay in diagnosis of high-grade osteosarcoma of the extremities. Has it any effect on the stage of disease? Tumori. 2000;86:204–6. doi: 10.1177/030089160008600305. [DOI] [PubMed] [Google Scholar]
- 7.Clasby R, Tilling K, Smith MA, Fletcher CD. Variable management of soft tissue sarcoma: regional audit with implications for specialist care. Br J Surg. 1997;84:1692–6. [PubMed] [Google Scholar]
- 8.Bielack SS, Kempf-Bielack B, Delling G, Exner GU, Flege S, Helmke K, et al. Prognostic factors in high-grade osteosarcoma of the extremities or trunk: an analysis of 1,702 patients treated on neoadjuvant cooperative osteosarcoma study group protocols. J Clin Oncol. 2002;20:776–90. doi: 10.1200/JCO.2002.20.3.776. [DOI] [PubMed] [Google Scholar]
- 9.Bacci G, Ferrari S, Lari S, Mercuri M, Donati D, Longhi A, et al. Osteosarcoma of the limb. Amputation or limb salvage in patients treated by neoadjuvant chemotherapy. J Bone Joint Surg Br. 2002;84:88–92. doi: 10.1302/0301-620x.84b1.12211. [DOI] [PubMed] [Google Scholar]
- 10.Cotterill SJ, Ahrens S, Paulussen M, Jürgens PA, Voûte PA, Gadner H, et al. Prognostic factors in Ewing's tumor of bone: analysis of 975 patients from the European Intergroup Cooperative Ewing's Sarcoma Study Group. J Clin Oncol. 2000;18:3108–14. doi: 10.1200/JCO.2000.18.17.3108. [DOI] [PubMed] [Google Scholar]
- 11.Fiorenza F, Abudu A, Grimer RJ, Carter SR, Tillman RM, Ayoub K, et al. Risk factors for survival and local control in chondrosarcoma of bone. J Bone Joint Surg Br. 2002;84:93–9. doi: 10.1302/0301-620x.84b1.11942. [DOI] [PubMed] [Google Scholar]
- 12.Pisters PW, Leung DH, Woodruff J, Shi W, Brennan MF. Analysis of prognostic factors in 1,041 patients with localized soft tissue sarcomas of the extremities. J Clin Oncol. 1996;14:1679–89. doi: 10.1200/JCO.1996.14.5.1679. [DOI] [PubMed] [Google Scholar]
- 13.Persson BM, Rydholm A. Soft-tissue masses of the locomotor system. A guide to the clinical diagnosis of malignancy. Acta Orthop Scand. 1986;57:216–9. doi: 10.3109/17453678608994379. [DOI] [PubMed] [Google Scholar]
- 14.Bauer HCF, Trovik CS, Alvegård TA, Berlin Ö, Erlanson M, Gustafson P, et al. Monitoring referral and treatment in soft tissue sarcoma: study based on 1,851 patients from the Scandinavian Sarcoma Group Register. Acta Orthop Scand. 2001;72:150–9. doi: 10.1080/000164701317323408. [DOI] [PubMed] [Google Scholar]
- 15.Gray JM, Khan MT, Grimer RJ, Pynsent PB. Is fruit a useful indicator of the size of an object? Ann R Coll Surg Engl (Suppl) 2003;85:18–19. 33. [Google Scholar]


