Abstract
The effectiveness of IFN-α2b for human multiple myeloma has been variable. TRAIL has been proposed to mediate IFN-α2b apoptosis in myeloma. In this study we assessed the effects of IFN-α2b signaling on the apoptotic activity of TRAIL and human myeloma cell survival. While TRAIL was one of the most potently induced proapoptotic genes in myeloma cells following IFN-α2b treatment, less than 20% of myeloma cells underwent apoptosis. Thus, we hypothesized that an IFN-stimulated gene (ISG) with prosurvival activity might suppress TRAIL-mediated apoptosis. Consistent with this, IFN-α2b stabilized mitochondria and inhibited caspase-3 activation, which antagonized TRAIL-mediated apoptosis and cytotoxicity after 24 hours of cotreatment in cell lines and in fresh myeloma cells, an effect not evident after 72 hours. Induced expression of G1P3, an ISG with largely unknown function, was correlated with the antiapoptotic activity of IFN-α2b. Ectopically expressed G1P3 localized to mitochondria and antagonized TRAIL-mediated mitochondrial potential loss, cytochrome c release, and apoptosis, suggesting specificity of G1P3 for the intrinsic apoptosis pathway. Furthermore, RNAi-mediated downregulation of G1P3 restored IFN-α2b–induced apoptosis. Our data identify the direct role of a mitochondria-localized prosurvival ISG in antagonizing the effect of TRAIL. Curtailing G1P3-mediated antiapoptotic signals could improve therapies for myeloma or other malignancies.
Introduction
Interferons (IFNs) can result in apoptosis, antiangiogenic effects, and immunomodulation (1–3). Although IFNs have been used for myeloma treatment since 1979 (1–5), their benefit for myeloma patients is still debated. A review by the European Myeloma Research Network identified beneficial effects of IFNs in 3 randomized studies and no effect in 3 others (6). Depending on experimental conditions, IFNs can either stimulate or inhibit cell survival or induce apoptosis in myeloma cells (7–11). Induction of TRAIL (also known as Apo2L) has been proposed to mediate apoptosis induced by IFN-α in myeloma cells and in solid tumors (9, 12, 13). However, an antagonizing effect for IFNs on TRAIL-induced caspase-8 activation has been identified (10). In several studies, IFN-α protected myeloma cells from dexamethasone-induced apoptosis (7, 14), suggesting antiapoptotic activity for IFNs in myeloma. However, molecular mechanisms for antiapoptotic effects of IFNs in malignancies have remained unclear.
To probe molecular and cellular actions of IFNs on myeloma cells, we assessed its effects on induction of IFN-stimulated genes (ISGs) and on TRAIL-induced apoptotic pathways. Depending on duration of treatment, IFN-α2b had a dual role in modulating the balance between myeloma cell survival and death. IFN-α2b for 24 hours antagonized TRAIL-induced apoptosis, but after 72 hours, it augmented the apoptotic activity of TRAIL. Because prosurvival or antiapoptotic pathways play a central role in the survival of myeloma cells (15), we hypothesized that induction of an ISG with prosurvival activity might be antagonizing the apoptotic activity of TRAIL. Further analysis identified G1P3 (ISG 6–16) as a gene that antagonized the effects of TRAIL by inhibiting the intrinsic apoptotic pathway through mitochondrial stabilization.
Results
Marginal effects of IFN-α2b on myeloma cell viability.
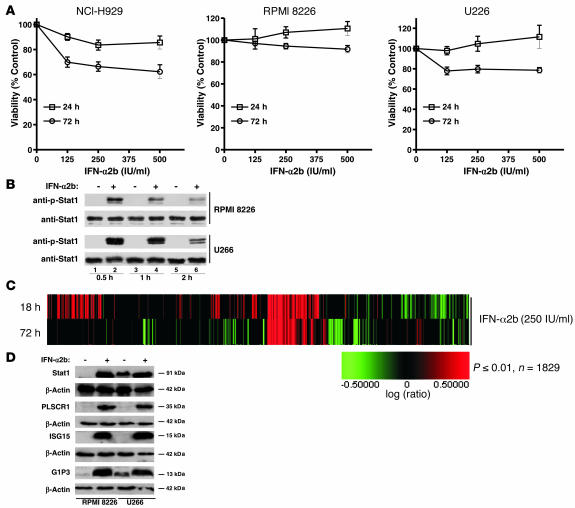
Effects of IFN-α2b on myeloma cell viability were determined by treating IL-6–independent NCI-H929, RPMI 8226, and U266 cells with increasing concentrations of IFN-α2b for 24 or 72 hours. Viability assays identified no inhibitory effects of IFN-α2b after 24 hours, with marginally reduced viability after 72 hours (Figure 1A). Compared with NCI-H929 and U226 cells, RPMI 8226 cells were more resistant to IFN-α2b. Other IFNs, IFN-β and IFN-α1b (Supplemental Figure 1, A and B; supplemental material available online with this article; doi:10.1172/JCI31122DS1), had a similar lack of effects; the ED50 for IFNs could not be defined under these conditions.
Figure 1. Effects of IFN-α2b on myeloma cell viability and cell signaling.
(A) Effect of IFN-α2b on myeloma cell viability. NCI-H929, RPMI 8226, and U266 cells were treated with increasing concentrations of IFN-α2b for 24 or 72 hours. Graphs represent viability assay results from 3 independent experiments done with 6 replicates. Each point in the graph represents mean ± SEM. Student’s t test analysis showed P < 0.0001 for each cell line at all IFN-α2b concentrations compared with control. (B) IFN-α2b–induced Stat1 tyrosine phosphorylation. RPMI 8226 and U266 cells were left untreated or were treated with IFN-α2b (250 IU/ml) for 0.5, 1, and 2 hours. Immunoblotting with an anti–phospho-Stat1 antibody identified increased Stat1 phosphorylation. Reprobing with an anti-Stat1 antibody confirmed equal amounts of Stat1. (C) Effects of IFN-α2b on global gene expression in RPMI 8226 cells. RNA isolated from RPMI 8226 cells left untreated or treated with IFN-α2b (250 IU/ml) for 18 or 72 hours was subjected to microarray analysis. (D) IFN-α2b induced ISGs in RPMI 8226 and U266 cells. Cells were left untreated or treated with 250 IU/ml of IFN-α2b for 24 hours, and 40 μg of total protein was analyzed by Western blotting with Stat1-, PLSCR1-, p15-, and G1P3-specific antibodies. β-Actin levels were assessed as controls.
To test whether the marginal effects of IFN-α2b on myeloma cell viability resulted from lack of efficient signaling, the kinetics of Stat1 phosphorylation, a critical downstream target of IFNs, was assessed in RPMI 8226 and U266 cell lines (Figure 1B). Immunoblotting with an anti–phospho-Stat1 antibody identified increased Stat1 phosphorylation within 0.5 hours of IFN-α2b, which was lost as treatment duration progressed (compare lanes 2, 4, and 6). Reprobing with an anti-Stat1 antibody detected an equal amount of Stat1 in each lane, confirming that the difference in phosphorylated Stat1 was not due to an increase in Stat1 (Figure 1B).
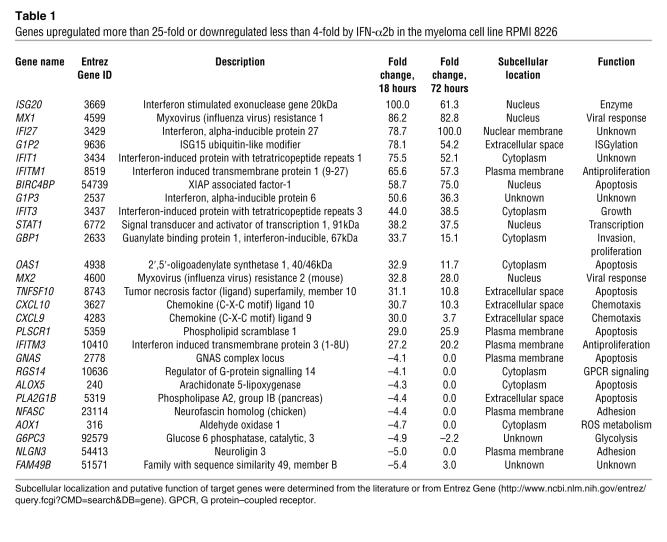
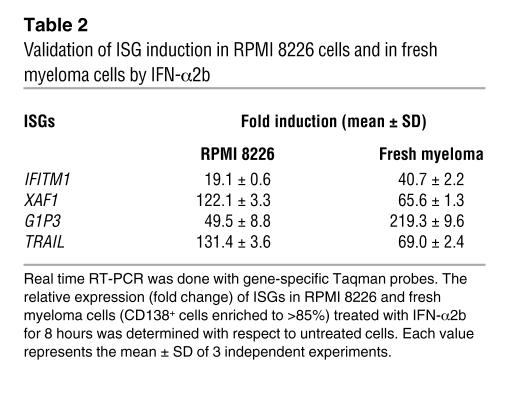
Since IFNs manifest their actions through ISGs, the effect of IFN-α2b on global gene expression in myeloma cells was investigated by Affymetrix oligonucleotide array. RPMI 8226 cells were treated with IFN-α2b (250 IU/ml for 18 or 72 hours) for profiling of early and late effects on gene expression; the number and magnitude of gene induction were higher after 18 hours (Figure 1C and Table 1). The subcellular localization and putative function of genes with substantial change in expression were assessed (Table 1). All 18 genes upregulated by greater than 25-fold were previously identified ISGs. In RPMI 8226 and U266 cells, IFN-α2b significantly induced expression of Stat1, phospholipase scramblase R1 (PLSCR1), ISG15, and G1P3 (Figure 1D). Additionally, after IFN-α2b treatment, mRNA levels of IFITM1, XAF1, G1P3, and TRAIL were significantly increased in RPMI 8226 cells and in fresh myeloma cells (Table 2). Similar results were obtained with U266 cells and with other isoforms of IFNs (IFN-α1b and IFN-β) (data not shown). These results suggested that IFN signaling was intact in myeloma cells and IFNs marginal inhibitory effects on viability were not due to a lack of signaling.
Table 1 .
Genes upregulated more than 25-fold or downregulated less than 4-fold by IFN-α2b in the myeloma cell line RPMI 8226
Table 2 .
Validation of ISG induction in RPMI 8226 cells and in fresh myeloma cells by IFN-α2b
IFN-α2b antagonized apoptosis induced by TRAIL in myeloma cell lines.
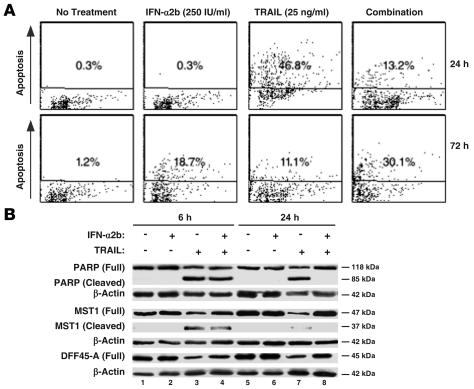
Real-time RT-PCR in RPMI 8226 cells identified substantial induction of XAF1 (122.2-fold) and TRAIL (131.4-fold), 2 known proapoptotic ISGs. However, lack of a corresponding decrease in cell viability suggested that RPMI 8226 cells were either not responding to the cytotoxic effects of TRAIL or that IFN-α2b was inhibiting TRAIL-induced cell death. Apoptosis of cells left untreated or treated with TRAIL (25 ng/ml) or IFN-α2b (250 IU/ml) alone or in combination was determined after 24 or 72 hours. IFN-α2b alone did not induce apoptosis after 24 hours but increased the percentage of cells undergoing apoptosis from 1.2% to 18.7% after 72 hours (Figure 2A). Under the same conditions, TRAIL markedly increased apoptosis from 0.3% to 46.8% after 24 hours and 1.2% to 11.1% after 72 hours (Figure 2A). Consistent with the hypothesis that an ISG might be inhibiting apoptosis, IFN-α2b cotreatment for 24 hours markedly reduced TRAIL apoptosis (from 46.8% to 13.2%). However, this early antagonistic effect was lost after 72 hours, and IFN-α2b additively increased apoptosis by TRAIL from 11.1% to 30.1% (Figure 2A). Consistent with this, IFN-α2b also antagonized the inhibitory effect of TRAIL on myeloma cell viability at 24 hours but not at 72 hours (Supplemental Figure 1C).
Figure 2. IFN-α2b exerts dual effects on TRAIL-induced myeloma cell apoptosis.
(A) IFN-α2b (250 IU/ml) cotreatment for 24 hours antagonized TRAIL-induced (25 ng/ml) apoptosis (top panel). However, 72-hour cotreatment additively increased the apoptotic index (bottom panel). Dot plot represents the data from 1 of 3 independent experiments, where 10,000 events were collected for each treatment using a FACS analyzer. Similar results were obtained in 2 other experiments. (B) IFN-α2b antagonized TRAIL-induced cleavage of caspase-3 substrates. WCEs from untreated or IFN-α2b–, TRAIL-, or IFN-α2b plus TRAIL–treated RPMI 8226 samples were subjected to immunoblot analyses to assess PARP, MST1, and DFF 45-A cleavage. The membrane was reprobed with a β-actin antibody to confirm equal loading of proteins.
Results of TUNEL assays were confirmed by assessing PARP, MST1, and DFF-45A cleavage. IFN-α2b alone did not induce cleavage of any of these molecular parameters of apoptosis (Figure 2B). However, TRAIL induced their cleavage by 6 hours, an effect that continued to 24 hours (Figure 2B). Cotreatment with IFN-α2b and TRAIL for 24 hours substantially inhibited PARP, MST1, and DFF-45A cleavage (Figure 2B).
Downregulation of TRAIL receptors (TRAIL R1/DR4 and TRAIL R2/DR5) or upregulation of its decoy receptors (DcR1 and DcR2) could explain the antagonizing effects of IFNs on TRAIL. However, expression of TRAIL receptor RNAs and proteins in IFN-α2b–treated, TRAIL-treated, or cotreated cells was unaltered (Supplemental Figure 2, A and B). In contrast, IFN-α2b alone induced TRAIL mRNA by 100-fold and the combination by 131-fold (Supplemental Figure 2A), suggesting that the effect of IFN-α2b was not due to downregulation of TRAIL.
IFN-α2b antagonized activation of caspase 3 induced by TRAIL.
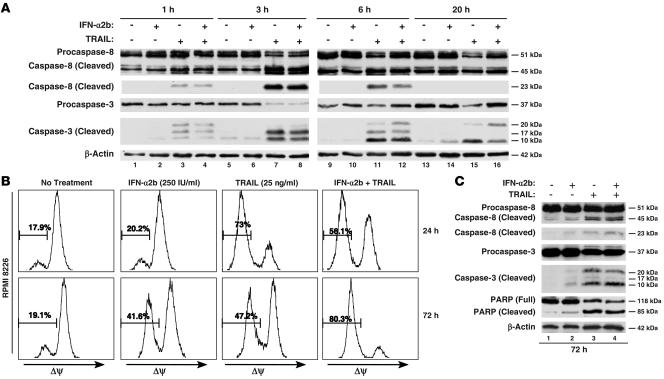
Since PARP, MST1, and DFF45-A are caspase-3 substrates (16, 17), effects of IFN-α2b on TRAIL-induced caspase activities were assessed in kinetic experiments. Although IFN-α2b did not induce either procaspase-8 or procaspase-3 cleavage before 20 hours, TRAIL initiated their cleavage after 1 hour (Figure 3A). Maximal cleavage of procaspase-3 occurred after 3 hours (compare lanes 3, 7, 11, and 15), with the levels of the smallest caspase-3 cleaved product (10 kDa) highest after 6 hours. The cleavage of procaspase-3 continued after 20 hours (compare lanes 3 and 16). Although IFN-α2b cotreatment slightly reduced the intensity of the 23-kDa cleaved caspase-8 product after 3 and 6 hours (compare lanes 11 and 12), its antagonizing effect on TRAIL-induced cleavage of procaspase-3 was more pronounced at 6 hours (compare lanes 12 and 11), with delayed formation of the more active species of caspase 3 (17 kDa and 10 kDa) (18).
Figure 3. Effects of IFN-α2b on TRAIL-induced activation of caspases and ΔΨ.
(A) IFN-α2b antagonized TRAIL-induced caspase-3 cleavage. RPMI 8226 cells were treated with IFN-α2b (250 IU/ml), TRAIL (25 ng/ml), or both in combination. Immunoblots of WCEs after 1-, 3-, 6-, and 20-hour treatments were analyzed for caspase-8 and caspase-3 cleavage. Reprobing with β- actin antibody showed equal loading. Two independent experiments showed similar results. (B) IFN-α2b antagonized TRAIL-induced loss of ΔΨ. ΔΨ of untreated or treated cells was measured with TMRM reagent after 24 or 72 hours. Histograms represent results from 1 of 3 independent experiments, where 10,000 events were collected for each treatment using a FACS analyzer. (C) IFN-α2b augmented TRAIL-induced extrinsic and intrinsic apoptosis signaling at 72 hours. WCEs (30 μg) from RPMI 8226 cells left untreated or treated with IFN-α2b (250 IU/ml), TRAIL (25 ng/ml), or both in combination for 72 hours were analyzed for caspase-8, caspase-3, and PARP cleavage. Equal sample loading was confirmed by reprobing with β-actin antibody.
Caspase-Glo 8 and Caspase-Glo 3/7 assays confirmed results of caspase cleavage assays. Maximal increase in caspase 8 activity, a 3.7-fold increase over control, was observed 3 hours after TRAIL treatment (Supplemental Figure 3). TRAIL increased caspase-3 activity by 4.1-fold after 3 hours and further increased it to 5.4-fold after 6 hours (Supplemental Figure 3). Although IFN-α2b did not alter TRAIL-induced caspase-8 activity (3.7-fold by TRAIL and 3.0-fold by TRAIL plus IFN-α2b), a marked reduction in caspase-3 activity occurred after 6 hours of cotreatment (5.4-fold by TRAIL alone and 3.4-fold by TRAIL plus IFN-α2b). These results demonstrated a greater inhibitory effect of IFN-α2b on caspase-3 activity than on caspase-8 activity.
Mitochondrial membrane potential (ΔΨ) has a critical role in caspase-3 activation by regulating release of cytochrome c into the cytoplasm (19). In the cytoplasm, caspase-9 activation by cytochrome c–Apaf1 complex results in activation of caspase-3 (20, 21). Incubation of untreated or 24-hour IFN-α2b–treated cells with tetramethyl rhodamine methyl ester (TMRM), a probe used for measuring ΔΨ, resulted in higher fluorescence intensity (right shift on x axis) (Figure 3B). In apoptotic cells, where ΔΨ was lost, TMRM should result in lower fluorescence; 24-hour treatment with TRAIL lowered the ΔΨ in 73% of cells. However, IFN-α2b cotreatment for 24 hours reduced the percentage of cells with low ΔΨ from 73% to 56.1% (Figure 3B), suggesting a mitochondrial stabilizing effect for IFN-α2b. As treatment duration progressed to 72 hours, IFN-α2b alone lowered the ΔΨ of 41.6% of cells (Figure 3B, bottom row), which was further increased to 80.3% in combination with TRAIL (Figure 3B).
The effects of prolonged treatment with IFN-α2b on intrinsic and extrinsic apoptosis signaling in RPMI 8226 cells were investigated by assessing cleavage of caspase-8, caspase-3, and PARP after 72 hours of treatment. IFN-α2b slightly increased the cleavage of caspase-8, caspase-3, and PARP (Figure 3C, lane 2). More importantly, as in early time points, it did not antagonize TRAIL-induced cleavage of either caspase-3 or PARP but enhanced cleavage of caspase-8, caspase-3, and PARP (Figure 3C).
IFN-α2b antagonized reduction of fresh myeloma cell viability and ΔΨ induced by TRAIL.
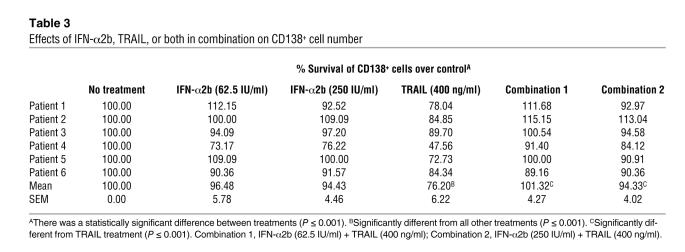
The effects of IFN-α2b and TRAIL on the viability of fresh myeloma cells were studied in mononuclear cells (MNCs) isolated from 6 myeloma patients. One-way repeated-measures ANOVA followed by pairwise multiple comparison using the Holm-Sidak method for different treatments showed that IFN-α2b had no marked effect on CD138+ cell viability either at 62.5 or 250 IU/ml after 24 hours (Table 3). However, TRAIL significantly reduced the CD138+ cell viability from 100% (control) to 76.20% (P < 0.001). As in cell lines, IFN-α2b antagonized the effect of TRAIL on fresh myeloma cells during this time. Compared with TRAIL alone, combination treatment with either 62.5 IU/ml or 250 IU/ml of IFN-α2b resulted in 101.32% (P < 0.001) or 94.33% (P < 0.001) viable CD138+ cells, respectively.
Table 3 .
Effects of IFN-α2b, TRAIL, or both in combination on CD138+ cell number
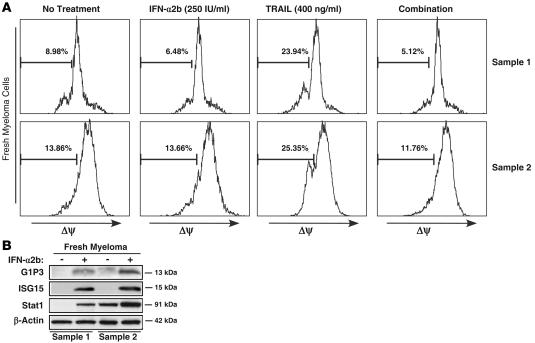
To test whether IFN-α2b mediates its antagonizing effects on TRAIL in fresh myeloma cells by preserving their mitochondrial stability, we assessed ΔΨ of CD138+ cells enriched to greater than 85% from 2 patients. Compared with untreated cells, TRAIL decreased the ΔΨ of CD138+ cells from 8.98% to 23.94% in sample 1 and 13.86% to 25.35% in sample 2 (Figure 4A). Although IFN-α2b alone did not affect ΔΨ, it antagonized TRAIL-induced loss of ΔΨ, resulting in 5.12% (sample 1) and 11.76% (sample 2) cells with low ΔΨ (Figure 4A).
Figure 4. Effects of IFN-α2b, TRAIL, and both in combination on the ΔΨ of fresh myeloma cells enriched from bone marrow aspirates.
(A) CD138+ cells (>85% enriched) from bone marrow aspirates of 2 patients were subjected to IFN-α2b (250 IU/ml), TRAIL (400 ng/ml), or both in combination for 24 hours, and ΔΨ was assessed using a TMRM reagent. (B) IFN-α2b induced ISGs in fresh myeloma cells. Fresh myeloma cells were left untreated or treated with 250 IU/ml of IFN-α2b for 24 hours, and 30 μg of total protein was analyzed by Western blotting with Stat1-, PLSCR1-, p15-, and G1P3-specific antibodies. β-Actin levels were assessed as controls.
As in cell lines, IFN-α2b markedly increased the expression of ISGs including G1P3 in fresh myeloma cells (Figure 4B). Since G1P3 was highly induced both in cell lines and in fresh myeloma cells and has a putative mitochondrial localization sequence in its N terminal, the role of G1P3 in mediating IFN-α2b’s antagonistic effect on apoptosis was investigated.
Constitutively expressed G1P3 localized into mitochondria in RPMI 8226 cells.
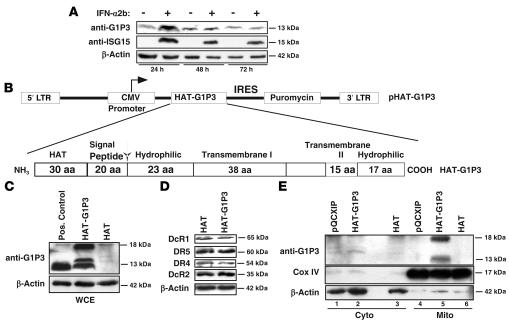
Time course experiments in RPMI 8226 cells revealed that IFN-α2b induced higher expression of G1P3 protein at 24 hours than at 48 and 72 hours (Figure 5A), a finding correlated temporally with lower apoptosis and preservation of ΔΨ. If IFN-α2b–induced G1P3 protected myeloma cells from apoptosis through stabilized mitochondria, then constitutive expression of G1P3 was postulated to induce resistance. Hence, overexpression studies were carried out. Sequences of 12 clones selected during cDNA cloning were aligned with the shortest isoform of the splice variant G1P3a (data not shown; GenBank accession number NM_002038.3), suggesting that G1P3a was the major G1P3 isoform induced by IFN-α2b in RPMI 8226 cells. G1P3a cDNA was subcloned 3′ to a His affinity tag (HAT) sequence in a pQCXIP vector (Figure 5B). RPMI 8226 cells were transduced with either empty vector (pQCXIP), Hat expression vector (HAT), or Hat-G1P3 fusion expression vector (HAT-G1P3), and single-cell clones were isolated. RT-PCR with HAT and G1P3 primers showed the expected 397-bp HAT-G1P3 amplicon in 7 of 8 clones (data not shown).
Figure 5. Ectopically expressed G1P3 localized into mitochondria.
(A) Relative induction of G1P3 protein in RPMI 8226 cells by IFN-α2b. WCEs from cells left untreated or treated with IFN-α2b (250 IU/ml) for 18, 48, and 72 hours were immunoblotted with an anti-G1P3 antibody. β-Actin was used as a loading control. (B) Schematics of G1P3 expression vector. HAT at N-terminal and putative structural elements derived from primary amino acid sequence analysis with protean software (Lasergene Inc.) are shown. The arrow indicates the cleavage site, which is located following a putative mitochondrial localization signal peptide of 20 amino acids. (C) Ectopic expression of HAT-G1P3 fusion protein in RPMI 8226 cells. Anti-G1P3 antibody specifically recognized a 13-kDa band in the positive control (treated with 250 IU/ml of IFN-α2b) and 13- and 17-kDa bands in HAT-G1P3 lysates. (D) Relative expression of TRAIL receptors in HAT or HAT-G1P3 clones. WCEs (30 μg) from untreated or IFN-α2b–treated (250 IU/ml) RPMI 8226 cells were immunoblotted with DR4, DR5, DcR1, and DcR2 antibodies. β-Actin was used as a loading control. (E) Mitochondrial localization of constitutively expressed G1P3. Immunoblotting of cytoplasmic (Cyto) and mitochondrial (Mito) fractions of pQCXIP, HAT, or HAT-G1P3 cells with anti-G1P3 antibody showed the localization of G1P3 in mitochondrial fractions (top panel). Reprobing with anti–Cox IV (middle panel) and β-actin antibodies (bottom panel) confirmed the purity of subcellular fractions.
Real-time RT-PCR identified the highest expression of G1P3 in clone 17 (1,283-fold), followed by clones 7 (912-fold) and 5 (219-fold) (Supplemental Figure 4A). Since a difference in expression of TRAIL receptors or TRAIL could influence sensitivity of G1P3 clones to TRAIL or IFNs, HAT and HAT-G1P3 clones with similar levels of TRAIL receptors and TRAIL were identified (Supplemental Figure 4B). HAT-G1P3 clone 5 was selected for functional studies because it had a G1P3 expression level similar to that of IFN-treated cells (Figure 5C and Supplemental Figure 4B) and had levels of TRAIL receptors similar to those of the vector-transduced cells (Figure 5D). Immunoblotting with a purified anti-G1P3 antibody recognized a 17-kDa and a 13-kDa band in whole-cell extracts (WCEs) of clone 5 (Figure 5C). The 13-kDa band comigrated with G1P3 in IFN-α2b–treated cells (positive control), and both bands were absent in the HAT clone.
Subcellular localization of G1P3 was examined by assessing G1P3 distribution in pQCXIP, HAT, and HAT-G1P3 cell fractions (Figure 5E). Anti-G1P3 antibody did not recognize any specific bands in cytoplasmic fractions. However, G1P3-specific 17-kDa and 13-kDa bands were detected only in the mitochondrial fractions of HAT-G1P3 cells (Figure 5E, lane 5). Reprobing of the blots with cytochrome c oxidase IV (Cox IV, a marker for mitochondria) and β-actin antibodies detected most of the Cox IV in the mitochondrial fraction and β-actin in the cytoplasmic fraction, indicating purity of subcellular fractions (Figure 5E).
Constitutively expressed G1P3 preserved ΔΨ and antagonized TRAIL-mediated caspase-3 activation.
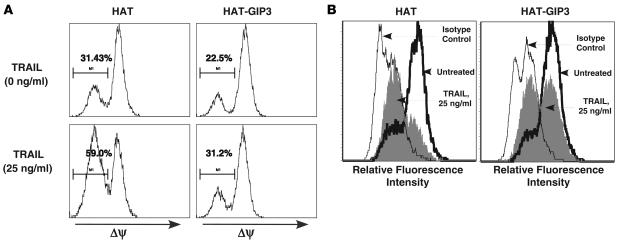
To determine whether ectopic expression of G1P3 could confer resistance to TRAIL-mediated change in ΔΨ, HAT-G1P3 and HAT clones were treated with TRAIL (25 ng/ml) for 16 hours. A marked increase in the percentage of vector-transduced cells with low ΔΨ (31.43% in untreated versus 59.0% in treated) compared with little effect on ΔΨ in HAT-G1P3 cells (22.5% in control versus 31.2% in treated) was observed (Figure 6A). In cytochrome c release assays, compared with an isotype matched FITC-conjugated IgG control antibody, a cytochrome c–specific antibody markedly increased fluorescence in untreated cells, suggesting mitochondrial confinement of cytochrome c in most cells (Figure 6B). TRAIL (25 ng/ml) treatment for 16 hours markedly reduced signal intensity in HAT expressing cells due to the release of cytochrome c into cytoplasm (Figure 6B, left panel). Under these conditions, approximately 50% of HAT-G1P3 cells retained cytochrome c in mitochondria, and this resulted in higher signal intensity (Figure 6B, right panel). Caspase-3 assay results identified a 4-fold increase in caspase-3 activity in HAT cells but not in HAT-G1P3 cells upon TRAIL treatment (data not shown).
Figure 6. Ectopic G1P3 antagonized TRAIL-induced mitochondrial perturbation.
(A) Ectopic G1P3 antagonized TRAIL-induced loss of ΔΨ. 1 × 10⁶ HAT (left panels) or HAT-G1P3 (right panels) cells were left untreated (top panels) or treated with TRAIL (25 ng/ml) (bottom panels) for 16 hours, and ΔΨ was measured with TMRM reagent. Three independent experiments showed similar results. (B) Constitutively expressed G1P3 antagonized mitochondrial release of cytochrome c. 1 × 10⁶ HAT (left panel) or HAT-G1P3 (right panel) cells were left untreated or treated with 25 ng/ml of TRAIL. Levels of cytochrome c in intact cells were measured with an FITC-conjugated cytochrome c antibody (histogram with thick line). Isotype-matched FITC-conjugated IgG antibody was used as a negative control (histogram with thin line). TRAIL markedly reduced the signal in HAT cells but not in HAT-G1P3 cells (filled histogram). Histograms represent results from 1 of 2 independent experiments.
Ectopic expression of G1P3 conferred resistance to cytotoxic and apoptotic activity of TRAIL in myeloma cells.
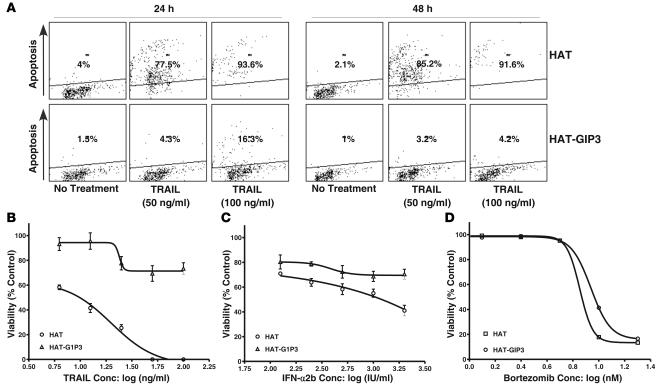
HAT and HAT-G1P3 cells were compared to determine the effect of G1P3 on TRAIL-induced apoptosis. TRAIL (50 ng/ml) treatment for 24 hours markedly increased apoptosis (from 4% to 77.5%) of HAT cells, and higher concentrations (100 ng/ml) resulted in a further increase to 93.6% (Figure 7A). HAT-G1P3 cells were resistant to TRAIL-induced apoptosis. Although 100 ng/ml of TRAIL did cause a slight increase in apoptosis of HAT-G1P3 cells at 24 hours (16.3%) and 48 hours (4.2%) (Figure 7A), it was markedly lower than that of HAT cells.
Figure 7. Effects of G1P3 overexpression on TRAIL-, IFN-α2b–, and proteasome inhibitor–induced cell death.
(A) G1P3-overexpressing cells were resistant to TRAIL-induced apoptosis. HAT or HAT-G1P3 cells were left untreated or treated with TRAIL (50 or 100 ng/ml), and the percentage of cells undergoing apoptosis was assessed after 24 or 48 hours. Similar results were obtained in 2 other experiments. G1P3-overexpressing cells were resistant to TRAIL (B) and IFN-α2b (C) but not to bortezomib (D). HAT or HAT-G1P3 cells were treated with increasing concentrations of TRAIL for 96 hours or bortezomib for 72 hours. ED50 was calculated using nonlinear regression analysis using Prism 4.0 software. Graph represents nonlinear regression analysis results from 1 of 2 independent experiments. Each point on the graph is mean ± SD of 6 replicates. conc, concentration.
To assess effects of G1P3 on mitochondria-independent cell death, the sensitivity of HAT and HAT-G1P3 cells to bortezomib, an agent that causes cell death primarily by inhibiting 26S proteasome, was quantified. As expected, G1P3-overexpressing cells were resistant to TRAIL (Figure 7B) and IFN-α2b (Figure 7C). In contrast, bortezomib had similar ED50 in both HAT and HAT-G1P3 cells (Figure 7D), suggesting that G1P3 overexpression was specific for cell death pathways wherein mitochondrial perturbation has a major role.
Downregulation of G1P3 sensitized myeloma cells to IFN-α2b–induced apoptosis.
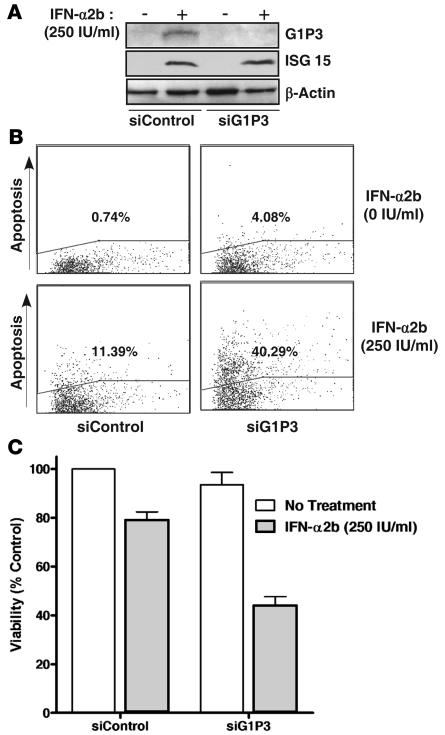
To test whether downregulation of G1P3 will sensitize myeloma cells to IFN-α2b, RNAi studies were conducted. Since very high transfection efficiency could be achieved in U266 cells (72% GFP-positive cells compared with 16% in RPMI 8226 cells; data not shown), this cell line was used for these experiments. Compared with control RNAi, G1P3-specific RNAi markedly downregulated IFN-α2b–induced expression of G1P3 protein (Figure 8A) and mRNA (data not shown), but not the induction of an unrelated ISG, ISG 15 (Figure 8A). Under these conditions, G1P3 downregulation increased the percentage of TUNEL-positive cells in untreated cells (0.74% to 4.08%) and in IFN-α2b–treated cells (11.39% to 40.29%) (Figure 8B). Consistent with this, siG1P3-transfected cells were more sensitive to IFN-α2b in viability assays (Figure 8C).
Figure 8. Downregulation of G1P3 sensitized myeloma cells to apoptosis and antiviability effects of IFN-α2b.
(A) Stealth RNAi against G1P3 downregulated IFN-α2b–induced G1P3 expression. U266 cells were transfected with either a scrambled stealth RNAi (siControl) or a G1P3 stealth RNAi (siG1P3). Sixteen hours after transfection, cells were treated with 250 IU/ml IFN-α2b for 24 hours, and 30 μg WCEs from untreated and treated cells were immunoblotted to assess G1P3 expression. (B) G1P3 downregulation sensitized myeloma cells to IFN-α2b–induced apoptosis. Forty-eight hours after IFN-α2b treatment, the percentage of cells undergoing apoptosis was measured by TUNEL assay as in Figure 2A. Similar results were obtained in 2 other experiments. (C) G1P3 downregulation augmented the antiviability activity of IFN-α2b. Viability of cells transfected with RNAi followed by IFN-α2b treatment for 48 hour was measured by Alamar blue assay. Each bar in the graph represents mean ± SEM of 3 independent experiments done in triplicate.
Discussion
While myeloma is considered a disease of deregulated proliferation, increased survival of malignant plasma cells may be more important for early expansion and accumulation of mutant plasma cells (22). Low labeling indices (<1%) of myeloma cells in early stages of disease support this hypothesis (23). During early stages of disease, incipient myeloma cells in germinal centers may accumulate genetic changes that suppress apoptosis, leading to gross chromosomal abnormalities and aneuploidy (24, 25). Because of this central role of prosurvival pathways in myelomagenesis, delineation of the molecular mechanisms that regulate these processes could result in design of therapies targeting them.
IFN-α2b had a dual effect on myeloma cell viability; early antiapoptotic and late proapoptotic effects (Figure 1A). Despite robust signaling and induction of proapoptotic genes such as TRAIL and XAF1 (26), less than 20% of myeloma cells underwent apoptosis (Figure 1B and Figure 2A and Tables 1 and 2). These observations led to the hypothesis that an ISG with prosurvival activity might be antagonizing apoptotic activity of TRAIL. Consistent with this, at early time points (24–36 hours), IFN-α2b opposed the inhibitory effects of TRAIL on the viability of cell lines or fresh myeloma cells from 6 patients (Table 3 and Supplemental Figure 1C).
TRAIL can initiate both intrinsic and extrinsic apoptotic pathways that converge on effector caspases (caspase-3 or -7) to induce cell death (27, 28). In many cell types, a mitochondria-dependent signal amplification loop (intrinsic apoptotic pathway) is necessary for efficient cell death (20). At early time points, IFN-α2b antagonized TRAIL-induced intrinsic apoptosis by preserving the mitochondrial integrity of myeloma cells (Figure 3, A and B, Figure 4A, and Supplemental Figure 3). However, these antiapoptotic effects were not evident after 72 hours of cotreatment.
Expression levels of G1P3, an ISG with a putative mitochondrial localization sequence, correlated with the antiapoptotic effects of IFN-α2b (Figure 4B and Figure 5A). Constitutive retroviral expression of G1P3 in RPMI 8226 cells suppressed TRAIL-induced intrinsic apoptosis. Consistent with these findings, RNAi-mediated downregulation of G1P3 sensitized myeloma cells to IFN-α2b–induced apoptosis (Figure 8B). Similarly, knockdown of G1P3 augmented apoptotic activity of IFNs in melanoma cells (data not shown). These results suggest that G1P3 might be crucial for mediating the antagonistic effect of IFNs on apoptosis. Constitutively expressing G1P3 made RPMI 8226 cells resistant not only to TRAIL but also to late (72–96 hours) viability inhibition effects of IFN-α2b (Figure 7, B and C). Equal sensitivity of control and G1P3-overexpressing cells to the proteasome inhibitor bortezomib together with the ability of G1P3 to preserve mitochondrial stability suggested its specificity in cell death pathways involving mitochondria rather than proteasomes.
G1P3 (ISG 6–16) was one of the first identified ISGs and belongs to the FAM14 family of proteins that include FAM 14A, -B, and -C and IFI 27 (29, 30). G1P3 was potently induced by IFN-α2b not only in myeloma cell lines but also in fresh myeloma cells and has an approximate molecular weight of 13–14 kDa (Figure 1D and Figure 4B). Addition of a 35-amino-acid HAT sequence increased the molecular weight of recombinant G1P3 to approximately 17 kDa in untreated cell lysates, validating its molecular weight (Figure 5B). Although constitutively expressed G1P3 localized in mitochondria (Figure 5D), whether the putative N-terminal mitochondrial localization sequence was indispensable for its mitochondrial targeting was not evaluated.
G1P3 was the first non–BH3-containing mitochondria-targeted ISG that could suppress apoptosis. Although several mitochondrial targeted proteins have been proposed to mediate the cellular apoptotic response to IFNs (31, 32), IFN-α2b (<500 IU/ml) had a minimal effect on their expression in myeloma cells (data not shown), which is consistent with a recent report (33).
Unlike in cancer cells, the antiapoptotic activity of G1P3 may have a beneficial effect on IFN-mediated antiviral and innate immune responses. During viral infection, delaying early apoptosis through survival factor induction would be a viable cellular strategy to protect surrounding healthy cells from viral infection, enhancing IFN secretion, and overcoming proapoptotic activity of cytokines released into the surrounding milieu (34–36). Similarly, antiapoptotic pathways operating in immune cells play a critical role in overcoming activation-induced cell death to maintain the balance of immune response (36). Mitochondria play a critical role in eliciting antiviral response by serving as a docking site for adaptor protein complexes that are essential for IFN induction (37), suggesting a need for a stable mitochondrion that might be achieved by G1P3 induction.
On gene expression arrays, G1P3 was identified as constitutively upregulated in breast cancer (38, 39). Compared with primary mammary epithelial cells, G1P3 mRNA and protein were markedly increased in breast cancer cell lines (data not shown). G1P3 has also been identified recently as a constitutive protein expressed at high levels in immortalized cells and in a gastrointestinal tumor cell line, TMK1, resistant to chemotherapy-induced apoptosis (40). Additionally, low passage number melanoma cell cultures with higher levels of induced G1P3 were less sensitive to the antiproliferative effects of IFN-β (data not shown).
Besides IFNs, TRAIL can induce G1P3 mRNA in tumor cells (41). Introduction of recombinant TRAIL and its receptor agonist antibodies into clinical trials emphasizes the need for further investigation of G1P3. Compared with cell lines, TRAIL was less effective in inhibiting the viability of fresh myeloma cells (Table 3; refs. 42, 43). Lack of detection of G1P3 protein at the basal level in fresh myeloma cells suggests that signals other than G1P3 may be critical in eliciting survival advantages in these cells (Figure 4B). Under these conditions, IFN-α2b induced the expression of G1P3 and antagonized the effects of TRAIL on fresh myeloma cell viability (Figure 4B and Table 3), suggesting that either the deregulated or the induced expression of G1P3 could lead to apoptosis resistance in tumor cells. Therefore, the current findings may provide an explanation for discrepant reports of effectiveness of IFN-α2b in myeloma (6). Better characterization of G1P3 could provide new insights into the role of G1P3 survival pathways in myeloma or other malignancies and induction of resistance to various therapeutic modalities.
Methods
Cell lines.
Human multiple myeloma cell lines (HMCLs) RPMI 8226, U266, and NCI-H929 were purchased from ATCC and propagated in recommended media.
Reagents and antibodies.
Recombinant IFN-α2b purified to homogeneity (Schering-Plough) had a specific activity of 2.6 × 10⁸ IU/mg of protein. TRAIL was obtained from PeproTech. Caspase-8, caspase-3, Cox IV, and MST1 antibodies were from Cell Signaling Technology. Other antibodies and their sources (in parentheses) are as follows; anti–phospholipase scramblase (a kind gift from B. Dong, The Cleveland Clinic), anti-G1P3 (a kind gift from H. Tahara, The Hiroshima University, Hiroshima, Japan), anti-Stat1 (BD Biosciences), anti–phospho-Stat1 (Tyr 701; Upstate), anti-DFF45A (BD Biosciences), anti-PARP (BIOMOL), anti–β-actin (Sigma-Aldrich), and monoclonal anti-ISG15 antibody (44).
Viability assays.
HMCLs were seeded in 96-well plates at a concentration of 4 × 10⁵ cells/ml and incubated for 24–96 hours with various concentrations of IFN-α2b or TRAIL (6 × 150 μl replicates at each concentration). At the end of incubation, viability was measured either by Alamar blue assay (Invitrogen) or by WST1 reagent (Roche Applied Science) according to the manufacturers’ protocol using a 96-well plate reader (Fisher Scientific). The IC50 was calculated by nonlinear regression analysis after converting the drug concentrations into log-X using Prism 4.0 software (GraphPad Software Inc.).
Fresh myeloma cell isolation and viability measurement.
Bone marrow aspirates were collected from multiple myeloma patients after appropriate consent was obtained as per The Cleveland Clinic institutional guidelines. The MNC fraction was isolated by density gradient centrifugation in lymphocyte separation media (Cellgro) as per the manufacturer’s instructions. MNCs (1 × 10⁵) were then left untreated or treated with IFN-α2b (62.5 IU/ml or 250 IU/ml), TRAIL (400 ng/ml), or both in combination for 24 hours. The percentage of dead or viable primary tumor cells in untreated control and treatment groups was determined by staining for 15 minutes at room temperature with 7AAD (BD Biosciences) and FITC-conjugated CD138 antibody (Diaclone Research), followed by flow cytometry. The relative percentage of CD138+ cells in treatment groups with respect to untreated cultures was calculated.
CD138+ cells were enriched from MNCs using microbeads conjugated with an anti-CD138 antibody and MACS column (Miltenyi Biotec) according to the manufacturer’s protocol. The purity of the cells was assessed by flow cytometry using a PE-conjugated CD138 antibody with a PE-conjugated IgG as isotype control.
Mitochondrial fractionation and potential measurement.
Cytosolic and mitochondrial fractions for Western blots were prepared from 1 × 10⁷ cells by differential centrifugation using a mitochondrial isolation kit for cultured cells according to manufacturer’s instructions (Pierce). For measuring ΔΨ, enriched CD138+ cells (>85% pure) or RPMI 8226 cells were harvested and resuspended in 1 nM TMRM dye for 10 minutes at room temperature in the dark. The shift in TMRM intensity was measured by flow cytometry with a Epics XL-MCL flow cytometer (Beckman Coulter Inc.), and FCS EXPRESS 2.0 software (De Novo Software) was used for data analysis.
Apoptosis and caspase activity assays and PARP cleavage.
TUNEL assay was performed as described previously (12). Caspase-3/7 or caspase-8 activity in cells treated with IFN-α2b, TRAIL, or both in combination was measured by caspase-Glo assay reagent (Promega) according to the manufacturer’s instructions. Luminescence of caspase-Glo reaction was measured using a 96-well luminometer (VICTOR 1420 multilabel counter; Wallac Instruments). Untreated or treated cells were lysed in the buffer (62.5 mM Tris-HCl, 10% glycerol, 6 M urea, and 5% β-mercaptoethanol) and immunoblotted with monoclonal anti-PARP antibody (BIOMOL).
Immunoblot analysis.
WCEs were made by lysing 1 × 10⁶ treated or untreated cells with RIPA buffer (Sigma-Aldrich) containing 1× protease inhibitor cocktail (Calbiochem). WCE (10–40) μg was subjected to immunoblot analysis as described previously (12).
RNA isolation, cDNA synthesis, and real-time RT-PCR.
RNA was isolated using SV Total RNA Isolation System (Promega), and cDNA was prepared with Mo-MLV reverse transcriptase (Promega) according to the manufacturer’s instructions. Taqman expression primers and ABI PRISM Sequence Detection Instrument 7500 (Applied Biosystems) were used for real-time RT-PCR. Fold change in target genes was calculated relative to human GAPDH.
cDNA cloning and ectopic expression of G1P3.
G1P3 cDNA was amplified from RNA of IFN-α2b–treated (250 IU/ml) RPMI 8226 cells by nested PCR with 5′-GTCGACGGATCCATGCGGCAGAAG-3′ (G1P3-BamH1.F) as forward, 5′-CTAGCGAGACCTACTCCTCATCCTCCTCACTA-3′(G1P3-Bsa1.R) and 5′-GTGAATTCGCGGCCGCAAGCTTAGTTAGATCTAGCGAGACCT-3′ (G1P3.EcoR1.R) as reverse primers. The amplicon was subcloned into BamH1 and EcoR1 in pHAT10 vector (BD Biosciences — Clontech) to generate the HAT-G1P3 fusion construct. The entire HAT-G1P3 open reading frame was sequence verified and then subcloned into Age1 and EcoR1 sites of pQCXIP retroviral expression vector (BD Biosciences — Clontech). HAT at N-terminal and putative structural elements was derived from primary amino acid sequence analysis with protean software (Lasergene Inc.; DNASTAR). The pantropic virion production and RPMI 8226 cell transduction were performed using Calphos Mammalian Transfection kit (BD Biosciences — Clontech) according to the manufacturer’s protocol. Single-cell clones were isolated with puromycin (1 μg/ml) selection. The HAT clones were screened by RT-PCR using 5′-GCTATGACCATGATTACGCCA-3′ (HAT.F) and 5′-AAGTCGACGGATCCATGCGGC-3′ (HAT.R) primers, and HAT-G1P3 clones were screened with HAT.F and G1P3-Bsa1.R primers. High-expressing HAT or HAT-G1P3 clones were identified by real-time RT-PCR with a G1P3-specific Taqman probe (Applied Biosystems).
Stealth RNAi.
For downregulation of G1P3 expression, U266 cells were transfected using Amaxa transfection system (Amaxa Biosystems) with 20 nM of G1P3 specific stealth RNAi (5′-GGCAGCAGCGUCGUCAUAGGUAAUA-3′) or a scrambled RNAi sequence (5′-GGCCAGCGUCGUCCAUAGGUAAGAUA-3′).
Microarray analysis.
Microarray analysis was performed using Affymetrix human genome U133A array as described previously (45). The microarray scanned image and intensity files (.cel files) were imported into Rosetta Resolver gene expression analysis software version 3.2 (Rosetta Inpharmatics). Error models were applied, and ratios were built for each treatment array versus its respective vehicle control.
Statistics.
Two-tailed Student’s t test and 1-way repeated-measures ANOVA followed by all pairwise multiple comparison procedures (Holmes-Sidak method) were performed using SigmaStat 3.5 software, and a P value of less than 0.05 was considered significant.
Supplementary Material
Acknowledgments
We would like to thank George R. Stark and Ram Ganapathi, The Cleveland Clinic, for critical reading; and Christine Healan-Greenberg, Abbott Research Laboratories, and Barbara S. Jacobs and Dustin S. Thomas, The Cleveland Clinic, for technical help. Polyclonal anti-G1P3 antiserum was a kind gift from Hidetoshi Tahara, The Hiroshima University, Japan. This work was funded in part by the American Cancer Society pilot grant to V. Cheriyath and NIH grant NC1 RO1 CA090914-04 to E.C. Borden.
Footnotes
Nonstandard abbreviations used: ΔΨ, mitochondrial membrane potential; Cox IV, cytochrome c oxidase IV; HAT, His affinity tag; ISG, IFN-stimulated gene; MNC, mononuclear cell; TMRM, tetramethyl rhodamine methyl ester; WCE, whole-cell extract.
Conflict of interest: The authors have declared that no conflict of interest exists.
Citation for this article: J. Clin. Invest. 117:3107–3117 (2007). doi:10.1172/JCI31122
References
- 1.Urabe A. Interferons for the treatment of hematological malignancies. Oncology. 1994;51:137–141. doi: 10.1159/000227328. [DOI] [PubMed] [Google Scholar]
- 2.Borden E., Lindner D., Dreicer R., Hussein M., Peereboom D. Second-generation interferons for cancer: clinical targets. Semin. Cancer Biol. 2000;10:125–144. doi: 10.1006/scbi.2000.0315. [DOI] [PubMed] [Google Scholar]
- 3.Schaar C., et al. Interferon-alpha as maintenance therapy in patients with multiple myeloma. Ann. Oncol. . 2005;16:634–639. doi: 10.1093/annonc/mdi125. [DOI] [PubMed] [Google Scholar]
- 4.Borden E. Innovative treatment strategies for non-Hodgkin’s lymphoma and multiple myeloma. Semin. Oncol. 1994;21(6 Suppl. 14):14–22. [PubMed] [Google Scholar]
- 5.Juturi J., et al. High, intermittent dose of all-trans retinoic acid in combination with alpha-interferon for advanced multiple myeloma. Haematologica. 2001;86:776–777. [PubMed] [Google Scholar]
- 6.Peest D., et al. Cytokine therapy in multiple myeloma. Br. J. Haematol. 1996;94:425–432. doi: 10.1046/j.1365-2141.1996.02298.x. [DOI] [PubMed] [Google Scholar]
- 7.Ferlin-Bezombes M., et al. IFN-alpha is a survival factor for human myeloma cells and reduces dexamethasone-induced apoptosis. J. Immunol. 1998;161:2692–2699. [PubMed] [Google Scholar]
- 8.Otsuki T., et al. Human myeloma cell apoptosis induced by interferon-alpha. Br. J. Haematol. 1998;103:518–529. doi: 10.1046/j.1365-2141.1998.01000.x. [DOI] [PubMed] [Google Scholar]
- 9.Chen Q., et al. Apo2L/TRAIL and Bcl-2-related proteins regulate type I interferon-induced apoptosis in multiple myeloma. Blood. 2001;98:2183–2192. doi: 10.1182/blood.v98.7.2183. [DOI] [PMC free article] [PubMed] [Google Scholar]
- 10.Dimberg L., et al. Ectopic and IFN-induced expression of Fas overcomes resistance to Fas-mediated apoptosis in multiple myeloma cells. Blood. 2005;106:1346–1354. doi: 10.1182/blood-2004-04-1322. [DOI] [PubMed] [Google Scholar]
- 11.Gomez-Benito M., et al. Apo2L/TRAIL is an indirect mediator of apoptosis induced by interferon-alpha in human myeloma cells. FEBS Lett. 2005;579:6217–6222. doi: 10.1016/j.febslet.2005.10.007. [DOI] [PubMed] [Google Scholar]
- 12.Chawla-Sarkar M., Leaman D., Jacobs B., Borden E. IFN-beta pretreatment sensitizes human melanoma cells to TRAIL/Apo2 ligand-induced apoptosis. J. Immunol. 2002;169:847–855. doi: 10.4049/jimmunol.169.2.847. [DOI] [PubMed] [Google Scholar]
- 13.Crowder C., Dahle O., Davis R., Gabrielsen O., Rudikoff S. PML mediates IFN-alpha-induced apoptosis in myeloma by regulating TRAIL induction. Blood. 2005;105:1280–1287. doi: 10.1182/blood-2004-04-1614. [DOI] [PubMed] [Google Scholar]
- 14.Liu P., Oken M., Van N.B. Interferon-alpha protects myeloma cell lines from dexamethasone-induced apoptosis. Leukemia. 1999;13:473–480. doi: 10.1038/sj.leu.2401334. [DOI] [PubMed] [Google Scholar]
- 15.Davies F., et al. Insights into the multistep transformation of MGUS to myeloma using microarray expression analysis. Blood. 2003;102:4504–4511. doi: 10.1182/blood-2003-01-0016. [DOI] [PubMed] [Google Scholar]
- 16.Graves J., et al. Caspase-mediated activation and induction of apoptosis by the mammalian Ste20-like kinase Mst1. EMBO J. 1998;17:2224–2234. doi: 10.1093/emboj/17.8.2224. [DOI] [PMC free article] [PubMed] [Google Scholar]
- 17.Liu X., et al. The 40-kDa subunit of DNA fragmentation factor induces DNA fragmentation and chromatin condensation during apoptosis. Proc. Natl. Acad. Sci. U. S. A. 1998;95:8461–8466. doi: 10.1073/pnas.95.15.8461. [DOI] [PMC free article] [PubMed] [Google Scholar]
- 18.Kumar S. The apoptotic cysteine protease CPP32. Int. J. Biochem. Cell Biol. 1997;29:393–396. doi: 10.1016/s1357-2725(96)00146-x. [DOI] [PubMed] [Google Scholar]
- 19.Green D., Reed J. Mitochondria and apoptosis. Science. 1998;281:1309–1312. doi: 10.1126/science.281.5381.1309. [DOI] [PubMed] [Google Scholar]
- 20.Zhang L., Fang B. Mechanisms of resistance to TRAIL-induced apoptosis in cancer. Cancer Gene Ther. 2005;12:228–237. doi: 10.1038/sj.cgt.7700792. [DOI] [PubMed] [Google Scholar]
- 21.Cereghetti G., Scorrano L. The many shapes of mitochondrial death. Oncogene. 2006;25:4717–4724. doi: 10.1038/sj.onc.1209605. [DOI] [PubMed] [Google Scholar]
- 22.Hallek M., Bergsagel P., Anderson K. Multiple myeloma: increasing evidence for a multistep transformation process. Blood. 1998;91:3–21. [PMC free article] [PubMed] [Google Scholar]
- 23.Bergsagel P.L., Kuehl W.M. Chromosome translocations in multiple myeloma. Oncogene. 2001;20:5611–5622. doi: 10.1038/sj.onc.1204641. [DOI] [PubMed] [Google Scholar]
- 24.Fonseca R., et al. Genomic abnormalities in monoclonal gammopathy of undetermined significance. Blood. 2002;100:1417–1424. [PubMed] [Google Scholar]
- 25.Kuehl W., Bergsagel P. Multiple myeloma: evolving genetic events and host interactions. Nat. Rev. Cancer. 2002;2:175–187. doi: 10.1038/nrc746. [DOI] [PubMed] [Google Scholar]
- 26.Chawla-Sarkar M., et al. Apoptosis and interferons: role of interferon-stimulated genes as mediators of apoptosis. Apoptosis. 2003;8:237–249. doi: 10.1023/a:1023668705040. [DOI] [PubMed] [Google Scholar]
- 27.Hengartner M.O. The biochemistry of apoptosis. Nature. 2000;407:770. doi: 10.1038/35037710. [DOI] [PubMed] [Google Scholar]
- 28.Kelley S., Ashkenazi A. Targeting death receptors in cancer with Apo2L/TRAIL. Curr. Opin. Pharmacol. 2004;4:333–339. doi: 10.1016/j.coph.2004.02.006. [DOI] [PubMed] [Google Scholar]
- 29.Kelly J., et al. Characterization of a human gene inducible by alpha- and beta-interferons and its expression in mouse cells. EMBO J. 1986;5:1601–1606. doi: 10.1002/j.1460-2075.1986.tb04402.x. [DOI] [PMC free article] [PubMed] [Google Scholar]
- 30.Itzhaki J., et al. Targeted breakage of a human chromosome mediated by cloned human telomeric DNA. Nat. Genet. 1992;2:283. doi: 10.1038/ng1292-283. [DOI] [PubMed] [Google Scholar]
- 31.Panaretakis T., Pokrovskaja K., Shoshan M., Grander D. Interferon-alpha-induced apoptosis in U266 cells is associated with activation of the proapoptotic Bcl-2 family members Bak and Bax. Oncogene. 2003;22:4543–4556. doi: 10.1038/sj.onc.1206503. [DOI] [PubMed] [Google Scholar]
- 32.Sun Y., Leaman D. Involvement of Noxa in cellular apoptotic responses to interferon, double-stranded RNA, and virus infection. J. Biol. Chem. 2005;280:15561–15568. doi: 10.1074/jbc.M412630200. [DOI] [PubMed] [Google Scholar]
- 33.Jourdan M., De V.J., Mechti N., Klein B. Regulation of Bcl-2-family proteins in myeloma cells by three myeloma survival factors: interleukin-6, interferon-alpha and insulin-like growth factor 1. Cell Death Differ. 2000;7:1244–1252. doi: 10.1038/sj.cdd.4400758. [DOI] [PMC free article] [PubMed] [Google Scholar]
- 34.Teodoro J., Branton P. Regulation of apoptosis by viral gene products. J. Virol. 1997;71:1739–1746. doi: 10.1128/jvi.71.3.1739-1746.1997. [DOI] [PMC free article] [PubMed] [Google Scholar]
- 35.Hardwick J. Viral interference with apoptosis. Semin. Cell Dev. Biol. 1998;9:339–349. doi: 10.1006/scdb.1998.0243. [DOI] [PubMed] [Google Scholar]
- 36.Zhang X.R., et al. Reciprocal expression of APO2L/TRAIL and CD95L in Th1 and Th2 cells: role of apoptosis in T helper subset differentiation. Cell Death Differ. 2003;10:203–210. doi: 10.1038/sj.cdd.4401138. [DOI] [PubMed] [Google Scholar]
- 37.Seth R., Sun L., Ea C., Chen Z. Identification and characterization of MAVS, a mitochondrial antiviral signaling protein that activates NF-kappaB and IRF 3. Cell. 2005;122:669–682. doi: 10.1016/j.cell.2005.08.012. [DOI] [PubMed] [Google Scholar]
- 38.Sorbello V., et al. Quantitative real-time RT-PCR analysis of eight novel estrogen-regulated genes in breast cancer. Int. J. Biol. Markers. 2003;18:123–129. doi: 10.1177/172460080301800205. [DOI] [PubMed] [Google Scholar]
- 39.Shen D., He J., Chang H.R. In silico identification of breast cancer genes by combined multiple high throughput analyses. Int. J. Mol. Med. 2005;15:205–212. [PubMed] [Google Scholar]
- 40.Tahara E.J., et al. G1P3, an interferon inducible gene 6–16, is expressed in gastric cancers and inhibits mitochondrial-mediated apoptosis in gastric cancer cell line TMK-1 cell. Cancer Immunol. Immunother. 2005;54:729–740. doi: 10.1007/s00262-004-0645-2. [DOI] [PMC free article] [PubMed] [Google Scholar]
- 41.Kumar-Sinha C., Varambally S., Sreekumar A., Chinnaiyan A. Molecular cross-talk between the APO2L/TRAIL and interferon signaling pathways. J. Biol. Chem. 2002;277:575–585. doi: 10.1074/jbc.M107795200. [DOI] [PubMed] [Google Scholar]
- 42.Lincz L.F., Yeh T.X., Spencer A. TRAIL-induced eradication of primary tumour cells from multiple myeloma patient bone marrows is not related to TRAIL receptor expression or prior chemotherapy. Leukemia. 2001;15:1650–1657. doi: 10.1038/sj.leu.2402251. [DOI] [PubMed] [Google Scholar]
- 43.Mitsiades C.S., et al. TRAIL/Apo2L ligand selectively induces apoptosis and overcomes drug resistance in multiple myeloma: therapeutic applications. Blood. 2001;98:795–804. doi: 10.1182/blood.v98.3.795. [DOI] [PubMed] [Google Scholar]
- 44.D’Cunha J., et al. In vitro and in vivo secretion of human ISG15, an IFN-induced immunomodulatory cytokine. J. Immunol. 1996;157:4100–4108. [PubMed] [Google Scholar]
- 45.Glaser K.B., et al. Gene expression profiling of multiple histone deacetylase (HDAC) inhibitors: defining a common gene set produced by HDAC inhibition in T24 and MDA carcinoma cell lines. Mol. Cancer Ther. 2003;2:151–163. [PubMed] [Google Scholar]
Associated Data
This section collects any data citations, data availability statements, or supplementary materials included in this article.


