Abstract
The method of tritium planigraphy, which provides comprehensive information on the accessible surface of macromolecules, allows an attempt at reconstructing the three-dimensional structure of a protein from the experimental data on residue accessibility for labeling. The semiempirical algorithm proposed for globular proteins involves (i) predicting theoretically the secondary structure elements (SSEs), (ii) experimentally determining the residue-accessibility profile by bombarding the whole protein with a beam of hot tritium atoms, (iii) generating the residue-accessibility profiles for isolated SSEs by computer simulation, (iv) locating the contacts between SSEs by collating the experimental and simulated accessibility profiles, and (v) assembling the SSEs into a compact model via these contact regions in accordance with certain rules. For sperm whale myoglobin, carp and pike parvalbumins, the λ cro repressor, and hen egg lysozyme, this algorithm yields the most realistic models when SSEs are assembled sequentially from the amino to the carboxyl end of the protein chain.
Keywords: three-dimensional modeling, globular proteins, computer simulation, secondary structure elements, contact regions
Studies on the protein spatial structure use a panoply of physical, chemical, and biological methods, the foremost of which are certainly x-ray analysis and high-resolution NMR. Notwithstanding their merit, these methods are quite laborious and have a number of inherent limitations as applied to macromolecules. This makes topical a search for alternative means of obtaining structural information, including theoretical approaches (1–4).
There are ways to predict the tertiary structure of globular proteins by determining the hypothetically possible sites of contact between secondary structure elements (SSEs) and then arranging the latter into a three-dimensional (3D) complex that should reflect the spatial fold of the macromolecule (5–8). Their weak point is the multiplicity of the admissible models they produce. Thus even for a fairly simple protein, sperm whale myoglobin, there may be several hundred structures. Even if certain restrictions are imposed (6) (their number can be cut to 20), the choice of a single version therefrom remains largely arbitrary. Building a realistic 3D model would be greatly facilitated if data were available on the actually existing contacts. Such information can be obtained experimentally by tritium planigraphy. Our early work with pike parvalbumin III (a globular Ca2+ binding protein), which demonstrated that planigraphic data can be used for spatial modeling (9), was a stepping stone to developing a basically novel concept of protein 3D reconstruction that would combine the conventional SSE prediction algorithms with analysis of the accessibility of amino acid residues for external tritiation. In that pilot study, labeling of each residue in the whole molecule was considered relative to its labeling in a fully exposed state [tripeptide, Gly-Xaa-Gly (10)]; thus, we initially did not distinguish the changes in accessibility (shielding) due to contacts between SSEs. However, this is a point of principal importance for modeling, and computer simulations for isolated elements to determine the shielding (vide infra) were an indispensable part of further work.
The Essentials of Tritium Planigraphy
The method is based on labeling organic compounds, including peptides and proteins, by bombarding the target (usually prepared by spray freezing the protein solution on the reactor wall chilled with liquid nitrogen) in a vacuum chamber with a beam of “hot” tritium atoms (generated through catalytic dissociation of molecular tritium at the surface of a tungsten filament heated to 2,000 K) (11). The resulting preparations are labeled to high specific activity and retain their structure and bioactivity (12, 13). Labeling takes place by single collisions of tritium atoms with the target, and the intramolecular label distribution among amino acid residues is governed by their steric accessibility in the macromolecule (14). This crucial point has been verified with a quite broad range of objects (15) including complex supramolecular structures such as viruses (16, 17) and ribosomes (18).
Experimental Assessment of Residue Accessibility in the Macromolecule
After labeling the protein, it is split into relatively short fragments so that each fragment has the least number of amino acid repeats; the cleavage pattern and means are chosen individually in accordance with the protein primary structure. After resolving the mixture of peptides, each is subjected to acid hydrolysis and amino acid analysis with simultaneous determination of radioactivity. As a result, we obtain the distribution of specific radioactivity along the protein sequence, i.e., the accessibility profile.
Residue Accessibility in Isolated Secondary Structure Elements and the Contact Regions
In the general case, the probability of residue labeling depends on the geometry and chemical properties of its side group, as well as on its shielding by other units close to it in the protein globule. Evaluation of the shielding is especially important for modeling the spatial structure, because this permits one to locate the regions of contact between separate parts of the polypeptide chain. The contribution of shielding can be estimated by comparing the residue accessibility in the protein globule and in isolated elements of secondary structure. The former can be determined directly in the experiment (see above), whereas the latter has to be deduced by computer simulation of tritium bombardment.
Our simulation algorithm, which makes use of the Monte Carlo procedure, has been described in detail (19). Isolated SSEs were built with standard parameters: angles φ, ψ, χ, and bond lengths. Residue accessibility was calculated as Pi = ni/Ni, where ni is the number of tritium atoms that reached an atom of the ith residue, and Ni is the total of tritium atoms with trajectories passing through the residue volume. In the experiment, Pi corresponds to the ratio of tritium atoms that labeled residue i to their total flux incident on the target. The sites of potential contact were located by the decrease in residue accessibility in the whole molecule versus the isolated SSEs, taking 80% shielding as the threshold for assigning residues to the contact region.
3D Modeling of Globular Proteins
The approach outlined above has been used to model the 3D structure of four α-helical proteins [sperm whale myoglobin (19), the λ cro repressor, carp and pike parvalbumins (9, 20)] and one α/β-protein [hen egg lysozyme (21)]. For all these proteins except pike parvalbumin III, x-ray data are available, which makes them convenient objects for testing and refining the technique. In the search for contacting SSEs, we took into account the length of the connector loop and its stereochemistry, following for the latter the general rules set by Efimov (22).
On the basis of the experience thus accumulated and with the wish to add practicality to the planigraphic approach, herein we focus on the most general patterns and the specific features that we encountered in modeling and formulate the ensuing rules that should be followed to build a realistic model.
Initial Data.
The initial data for designing a 3D model are the accessibility profiles obtained experimentally for the whole protein and by computer simulation for isolated SSEs. The protein secondary structures were predicted from their amino acid sequences, by using the Finkelstein’s algorithm, analogous methods, or combinations thereof (23–25). The α-helices were modeled as cylinders 5 Å in diameter with Cα atoms on their surface, and β-structures as 2.5-Å-thick flexuous slabs twisted clockwise (in the amino to carboxyl direction) by some 5° per residue. The spatial model was constructed by combining the SSEs with an account of the contact regions located as above.
Fig. 1 exemplifies the accessibility profiles for the entire molecule and isolated α-helices of the λ cro repressor, and the “spreadsheets” of the helices indicating the contact zones (at least 80% shielding). The choice of contacts between α-helices is governed by the length of loops connecting them, as distinguished below.
Figure 1.
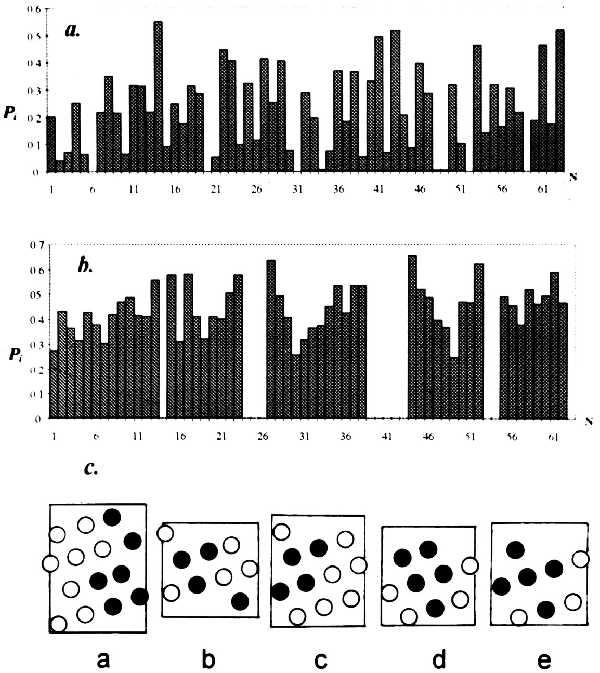
Residue accessibility profiles for λ cro repressor (experiment) (a) and its isolated α-helices (computer simulation) (b) and the resulting spreadsheets of helix surfaces (c) with residues shielded upon integration of the helix into the macromolecule indicated (•; together they form the potential zone of interhelix contact).
Short Interhelix Loops.
Helices separated by one to three residues obviously cannot come in contact with each other, and the contact zones located on their surface must originate from association with other helices farther along the chain. Thus there is no contact between the first (amino proximal) three α-helices A, B, and C in myoglobin, which form a complex schematically shown in Fig. 2a. The same is observed in the λ cro repressor: helices A, B, and C with connectors of one and two residues (Fig. 2b). In myoglobin there is also no contact between helices D and E that have a two-residue connector. The first contact in this protein becomes possible between helices B and D, and the shape of the contact zone dictates their nearly perpendicular positioning (Fig. 3a). In the λ cro repressor, the first contacts are formed by helix D with the middle of helix B and the amino-proximal part of helix C (Fig. 3b).
Figure 2.
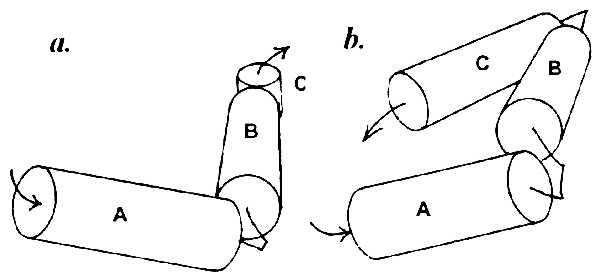
Spatial model of the complex of nonintersecting α-helices connected with short loops (one to three residues). (a) Sperm whale myoglobin. (b) λ cro repressor.
Figure 3.
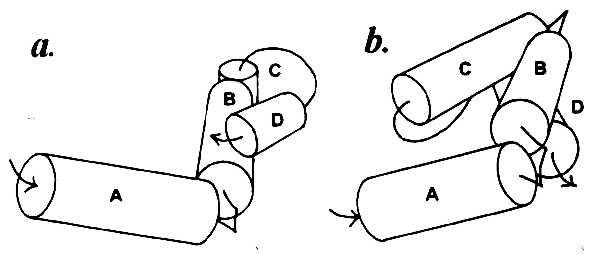
Complexes of α-helices in sperm whale myoglobin (a) and λ cro repressor (b) with the first interhelix contacts: helices B–D in a and helices C–D and B–D in b.
Long Interhelix Loops.
Longer connectors (four residues and more) allow a broader range of contacts between SSEs, as in parvalbumins and lysozyme. It turned out that the order of helix packing is basically important for obtaining a correct model, because changes in the order give rise to different final structures. All possible packing versions have been considered for carp parvalbumin, which contains six α-helices named A–F. Fig. 4 shows the structures obtained by packing the elements from the amino to the carboxyl end of the polypeptide chain (Fig. 4a), in reverse order (Fig. 4b), and around the “nucleus” formed by the most shielded pair of helices C and D (Fig. 4 c and d). Of all the 720 versions tested, a model consistent with the x-ray data was produced only by amino to carboxyl packing, i.e., A + B + C + D + E + F. Analogous results were obtained for all other objects, so that this packing sequence appears to be a general rule for spatial modeling using contact zones. Note that this order corresponds to the direction of polypeptide chain synthesis on the ribosome.
Figure 4.
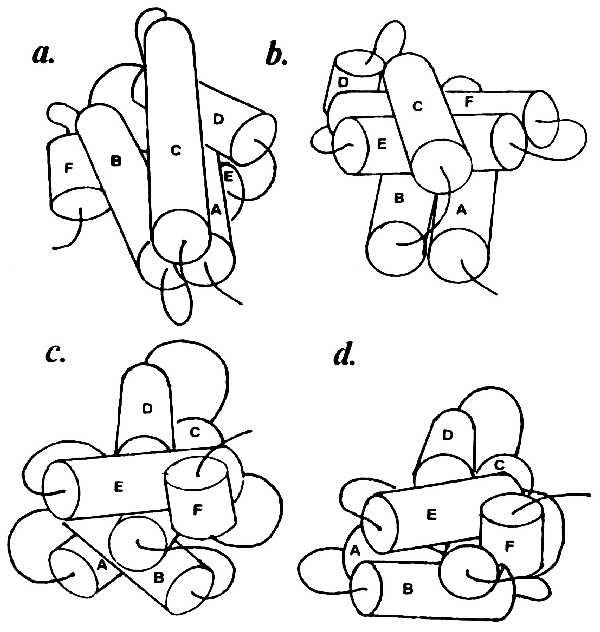
Hexahelical complexes obtained with different modes of helix packing for carp parvalbumin. (a) Sequential amino to carboxyl packing (A + B + C + D + E + F). (b) Sequential carboxyl to amino packing (F + E + D + C + B + A). (c) Around the core pair of helices C and D most shielded in the macromolecule [(C + D) + E + F + B + A]. (d) Same as c but adding the AB complex as a unity [(C + D) + E + F + AB]. Only model a is consistent with the x-ray data.
Prosthetic Groups.
Many proteins carry various “nonprotein” functional groups covalently attached to the polypeptide chain. This, as a rule, substantially influences the spatial structure of the macromolecule. For this, one should distinguish two cases: when such a group is attached in the course of protein synthesis and when such a group is attached after completion of the polypeptide chain. We encountered the former case with sperm whale myoglobin. The loop between helices E and F has eight residues and is long enough for packing F antiparallel to E and parallel to helix A, and their surfaces have appropriate vacant contact zones. On the other hand, it is known that helix F with helix B and partly with helix C form the “pocket” for the heme. If we assume an amino to carboxyl packing, the final complex of α-helices ABCDEFGH with the above F/E/A arrangement would then have to undergo profound changes to accommodate the heme. A correct configuration of the complex can be obtained only if helix F is taken integral with the heme. Indeed, heme incorporation into hemoglobin has been shown to take place cotranslationally (26). As the chemical bond with the heme is formed concurrently with helix F, it is not just admissible but necessary to consider their complex as a unity in modeling.
β-Domains.
Compared with α-helices, β-strands are more labile fluctuating structural elements. In this respect, modeling of β-proteins as well as those containing both α-helices and β-domains is a special task. Let us consider this case with an α/β-protein, lysozyme (21) as an example. After the bihelical complex AB, the SSE next in sequence is a β-structure composed of three antiparallel β-strands: residues 42–46 (β1), residues 50–54 (β2), and residues 57–60 (β3). In principle, there are three ways of further modeling: (i) consecutive packing of only α-helices, whereby the entire region of residues 36–79 is deemed unordered, giving rise to a β-structure only upon completion of the helical complex; (ii) one-by-one attachment of β1, β2, and β3 to AB; or (iii) assembly of the three strands into a β-structure, which is then attached as a unity to the bihelical complex. These ways lead to dissimilar spatial models.
According to the x-ray data, in lysozyme there are no contacts of helices A and B with helix C, which clearly rules out pathway i. Further, helix A has no contact with the β-strands at all, whereas helix B has closest contacts with β3 and β2 but only marginal contact with β1, which is just opposite to what would be produced via pathway ii; the latter also yields a set of interstrand contacts contradicting the actually existing one. Hence modeling must include a separate step of building the β-domain (Fig. 5a). When added to the AB complex, helix C, the next helix, comes in contact with the β-domain but not with helix A or B. The resulting model of the β-domain and the entire AB–β-CD “sandwich” shown in Fig. 5 agree nicely with the known x-ray structure of lysozyme. Such a situation, in which β-domains, which can be regarded as suprasecondary structures, should be given “equal rights” with α-helices, may prove fairly common for multidomain proteins.
Figure 5.
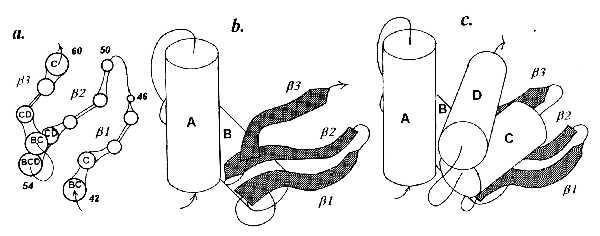
Hen egg lysozyme. (a) Model of β-structure composed of strands of residues 42–46 (β1), 50–54 (β2), and 57–60 (β3). Letters within circles denote helices contacting particular residues. (b) Model of complex of AB helices with the β-domain (shaded). (c) Spatial model of the whole protein.
Disulfide Bridges.
A prominent role in sustaining the native spatial structure is played by disulfide bridges between cysteines, which are often far away from each other in the protein sequence. A typical example is again lysozyme, whose four disulfide bridges (between residues 6–127, 30–115, 64–80, and 76–94) not only have the key part in forming the tertiary structure but also ensure the high conformational stability of the protein globule. Four of the eight cysteines are in α-helices and, by the extent of shielding, could have been classed with contact zones. It is noteworthy that pronounced shielding is found for the sulfur atoms of all lysozyme cysteines, and in all probability, this is what makes the protein quite tolerant of reducing agents.
If the tertiary structure is formed in the amino to carboxyl direction, one could have expected that disulfide bridges were formed between cysteines in neighboring SSEs, i.e., residues 30–60, 64–76, 80–94, and 115–127. However, as maximal matching of contact zones is sought, these residues prove to be located on the opposite sides of the complexes, and disulfide bridges are formed between residues remote in the sequence but close in the finally folded spatial model. Much the same perhaps takes place in reality.
Conclusions and Implications
Thus, our experience in modeling the protein spatial structure using the data of tritium planigraphy, albeit limited, allows some generalizations. The algorithm proposed herein yields correct results if the following rules are observed: (i) secondary structure elements are packed sequentially from the amino to the carboxyl end of the polypeptide chain; (ii) cofactors and other groups covalently attached to the protein cotranslationally are regarded as being integral with the corresponding SSE; (iii) in α/β-proteins, the β-domains and the α-helices are taken as integral units for assembly; (iv) disulfide bridges are formed at the final stage, within the established spatial structure composed of α-helices and β-structures, and “fasten” the cysteines remote in the sequence but close in the protein globule.
The fact that this modeling algorithm reflects the direction of polypeptide chain synthesis on the ribosome corroborates the idea that the protein spatial structure arises cotranslationally. From the physical standpoint, this appears quite plausible. Indeed, ribosomal synthesis of a protein of 150–300 residues takes 30–60 sec. This time is much shorter than that needed for protein renaturation (dozens of minutes or even hours) but exceeds by several orders of magnitude the characteristic times of secondary structure formation and intramolecular motions, including segmental movements. With the assertion that the spatial structure begins to be formed only after completion of synthesis, one has to further assume special factors that for a fairly long time prevent the folding of the polypeptide chain and protect it from various proteolytic agents. A number of recent works provide direct experimental evidence that the growing polypeptide on the ribosome acquires a certain spatial structure resembling that of the mature macromolecule (26–30); moreover, for firefly luciferase, the nascent protein exhibits enzymic activity even before its release from the ribosome (31). This brief discourse is only to underline the consistency of our modeling with the natural process and does not at all exclude the participation of other factors, such as molecular chaperones, in protein folding. Regardless of the particular sequence of events giving rise to the spatial structure of macromolecules, we now have grounds for saying that tritium planigraphy offers an independent experimental means for reconstructing the macromolecular organization—working from the surface to the interior—that may prove to be a valuable addition to the established approaches in this field of research.
Acknowledgments
We thank A. S. Spirin for his interest in this line of research and fruitful discussions. This study was partly supported by grants from the International Science Foundation (MML000) and the Russian Foundation for Basic Research (96–04-50692 and 96–03-34185).
ABBREVIATIONS
- SSE
secondary structure element
- 3D
three-dimensional
References
- 1.Altman R S, Jardetzky O. J Biochem. 1986;100:1403–1423. doi: 10.1093/oxfordjournals.jbchem.a121847. [DOI] [PubMed] [Google Scholar]
- 2.Hurle M R, Matthews C R, Cohen F E, Kuntz I D, Toumadje A, Johnson W C. Proteins. 1987;2:210–224. doi: 10.1002/prot.340020306. [DOI] [PubMed] [Google Scholar]
- 3.Curtis B M, Presnell S R, Srinivasan S, Sassenfild H, Klinke R, Jeffery E, Cosman D, March C J, Cohen F E. Proteins. 1991;11:111–119. doi: 10.1002/prot.340110204. [DOI] [PubMed] [Google Scholar]
- 4.Huang Z, Prusiner S B, Cohen F E. Folding and Design. 1995;1:13–19. [PubMed] [Google Scholar]
- 5.Richmond T J, Richards F M. J Mol Biol. 1978;119:537–555. doi: 10.1016/0022-2836(78)90201-2. [DOI] [PubMed] [Google Scholar]
- 6.Cohen F E, Richmond T J, Richards F M. J Mol Biol. 1979;132:275–288. doi: 10.1016/0022-2836(79)90260-2. [DOI] [PubMed] [Google Scholar]
- 7.Cohen F E, Sternberg M J E, Taylor W R. J Mol Biol. 1982;156:821–862. doi: 10.1016/0022-2836(82)90144-9. [DOI] [PubMed] [Google Scholar]
- 8.Harris N L, Presnell S R, Cohen F E. J Mol Biol. 1994;236:1356–1368. doi: 10.1016/0022-2836(94)90063-9. [DOI] [PubMed] [Google Scholar]
- 9.Gedrovich A V, Shishkov A V, Gol’danskii V I, Baratova L A, Grebenshchikov N I, Efimov A V. Eur Biophys J. 1991;19:283–286. doi: 10.1007/BF00183316. [DOI] [PubMed] [Google Scholar]
- 10.Shrake A, Rupley J A. J Mol Biol. 1973;79:351–371. doi: 10.1016/0022-2836(73)90011-9. [DOI] [PubMed] [Google Scholar]
- 11.Shishkov A V, Filatov E S, Simonov E F, Gol’danskii V I, Nesmejanov A N. Dokl Akad Nauk SSSR. 1976;228:1237–1239. [PubMed] [Google Scholar]
- 12.Ulmasov Ch A, Nesterova M V, Poletaev A I, Severin E S. Biochemistry (Moskow) 1981;46:1609–1612. [Google Scholar]
- 13.Yusupov M M, Spirin A S. Methods Enzymol. 1988;164:426–439. doi: 10.1016/s0076-6879(88)64059-6. [DOI] [PubMed] [Google Scholar]
- 14.Gol’danskii V I, Rumyantsev Yu M, Shishkov A V, Baratova L A, Belyanova L P. Mol Biol. 1982;16:528–534. [PubMed] [Google Scholar]
- 15.Shishkov A V, Baratova L A. Russian Chem Rev. 1994;9:781–796. [Google Scholar]
- 16.Gol’danskii V I, Kashirin I A, Shishkov A V, Baratova L A, Grebenshchikov N I. J Mol Biol. 1988;201:567–574. doi: 10.1016/0022-2836(88)90638-9. [DOI] [PubMed] [Google Scholar]
- 17.Baratova L A, Grebenshchikov N I, Dobrov E N, Gedrovich A V, Kashirin I A, Shishkov A V, Efimov A V, Jarvekulg L, Radavsky Yu L, Saarma M. Virology. 1992;188:175–180. doi: 10.1016/0042-6822(92)90747-d. [DOI] [PubMed] [Google Scholar]
- 18.Agafonov D E, Kolb V A, Spirin A S. Proc Natl Acad Sci USA. 1997;94:12892–12897. doi: 10.1073/pnas.94.24.12892. [DOI] [PMC free article] [PubMed] [Google Scholar]
- 19.Bogacheva E N, Moroz A P, Shishkov A V, Baratova L A. Mol Biol. 1996;30:379–384. [PubMed] [Google Scholar]
- 20.Bogacheva E N, Moroz A P, Shishkov A V, Baratova L A. Mol Biol. 1996;30:522–526. [PubMed] [Google Scholar]
- 21.Bogacheva E N, Moroz A P, Shishkov A V, Baratova L A. Mol Biol. 1997;31:420–424. [PubMed] [Google Scholar]
- 22.Efimov A V. Prog Biophys Mol Biol. 1993;60:201–203. doi: 10.1016/0079-6107(93)90015-c. [DOI] [PubMed] [Google Scholar]
- 23.Lim V I. J Mol Biol. 1974;88:273–294. doi: 10.1016/0022-2836(74)90404-5. , 872–884. [DOI] [PubMed] [Google Scholar]
- 24.Chou P V, Fasman G D. Biophys J. 1979;26:367–384. doi: 10.1016/S0006-3495(79)85259-5. [DOI] [PMC free article] [PubMed] [Google Scholar]
- 25.Finkelstein A V, Ptitsyn O B. Prog Biophys Mol Biol. 1987;50:177–180. doi: 10.1016/0079-6107(87)90013-7. [DOI] [PubMed] [Google Scholar]
- 26.Komar A A, Kommer A, Krasheninnikov I A, Spirin A S. J Biol Chem. 1997;272:10646–100651. doi: 10.1074/jbc.272.16.10646. [DOI] [PubMed] [Google Scholar]
- 27.Kolb V A, Makeev E V, Spirin A S. EMBO J. 1994;13:3631–3637. doi: 10.1002/j.1460-2075.1994.tb06670.x. [DOI] [PMC free article] [PubMed] [Google Scholar]
- 28.Fedorov A N, Baldwin T O. Proc Nat Acad Sci USA. 1995;92:1227–1231. doi: 10.1073/pnas.92.4.1227. [DOI] [PMC free article] [PubMed] [Google Scholar]
- 29.Gilmore R, Coffey M C, Leone G, McLure K, Lee P W K. EMBO J. 1996;15:2651–2658. [PMC free article] [PubMed] [Google Scholar]
- 30.Chen W, Helenius J, Braakman I, Helenius A. Proc Natl Acad Sci USA. 1995;92:6229–6233. doi: 10.1073/pnas.92.14.6229. [DOI] [PMC free article] [PubMed] [Google Scholar]
- 31.Makeev E V, Kolb V A, Spirin A S. FEBS Lett. 1996;378:166–170. doi: 10.1016/0014-5793(95)01438-1. [DOI] [PubMed] [Google Scholar]


