Abstract
Intermolecular electronic coupling dictates the optical properties of molecular aggregate systems. Of particular interest are photosynthetic pigment–protein complexes that absorb sunlight then efficiently direct energy toward the photosynthetic reaction center. Two-dimensional (2D) ultrafast spectroscopy has been used widely in the infrared (IR) and increasingly in the visible to probe excitonic couplings and observe dynamics, but the off-diagonal spectral signatures of coupling are often obscured by broad diagonal peaks, especially in the visible regime. Rotating the polarizations of the laser pulses exciting the sample can highlight certain spectral features, and the use of polarized pulse sequences to elucidate cross-peaks in 2D spectra has been demonstrated in the IR for vibrational transitions. Here we develop 2D electronic spectroscopy using cross-peak-specific pulse polarization conditions in an investigation of the Fenna–Matthews–Olson light harvesting complex from green photosynthetic bacteria. Our measurements successfully highlight off-diagonal features of the 2D spectra and, in combination with an analysis based on the signs of features arising from particular energy level pathways and theoretical simulation, we characterize the dominant response pathways responsible for the spectral features. Cross-peak-specific 2D electronic spectroscopy provides insight into the interchromophore couplings, as well as into the energetic pathways giving rise to the signal. With femtosecond resolution, we also observe dynamical processes that depend on these couplings and interactions with the protein environment.
Keywords: 2D spectroscopy, Fenna–Matthews–Olson, ultrafast spectroscopy
Two-dimensional (2D) ultrafast Fourier transform electronic spectroscopy (1–3) provides an incisive tool to study energy transfer among excitons and electronic couplings between chromophores (4–6). Photosynthetic light-harvesting complexes depend on precisely these couplings to govern their function; by modulating couplings among chlorophyll and bacteriochlorophyll (BChl) molecules, nature has created from a simple motif an entire array of photosynthetic light-harvesting complexes, photoprotection mechanisms, antennae, and energy transfer apparatuses. However, because of the couplings on the order of kBT and the energetic disorder, the fast dephasing times of electronic spectra, and the large number of chromophores involved, many of these spectroscopic coupling signatures, which appear as off-diagonal peaks in 2D electronic spectra, are obscured by broad diagonal features. In this work, we develop a cross-peak-specific 2D electronic spectroscopy to eliminate the main diagonal features and highlight underlying cross-peaks. The theory behind our approach using polarization has been developed in the 2D infrared (IR) community (7, 8) but never applied to the electronic spectral region because of the stringent phase stability requirements for short wavelengths.
We employ a linear polarization rotation sequence [π/3 (pulse 1), −π/3 (pulse 2), 0 (pulse 3), 0 (local oscillator)] to eliminate the strongest features on the main diagonal of the 2D spectrum (7, 8). Applying this technique to the Fenna–Matthews–Olson complex (FMO) isolated from Pelodictyon phaeum, we observe the complex spectral structure in the off-diagonal peaks otherwise obscured by the main diagonal features. In vivo, the FMO complex forms a trimer and acts as an “excitonic wire” conducting energy from the light-harvesting chlorosome to the reaction center, and the spectral structure we observe arises from seven embedded BChls, which are coupled and mix to form excitonic states (4, 5). The spectral separation between excitons of P. phaeum FMO is less than those of the previously studied Chlorobium tepidum FMO making resolution of individual excitons and associated cross-peaks more difficult. The cross-peak-specific technique not only allows clear observation of the cross-peaks, but also causes some response pathways to appear in the spectrum with opposite sign (7). From these data, we can assign and characterize cross-peaks to specific nonlinear response pathways based on sign changes and comparison with theoretical models. Different response pathways involve a variety of physical mechanisms including dephasing of excited-state coherences, population relaxation, and interactions with the two exciton manifold. Understanding which response pathways provide the dominant contribution to a cross-peak provides detailed information about the physical mechanism responsible for the coupling and associated energy relaxation.
Experimental Results
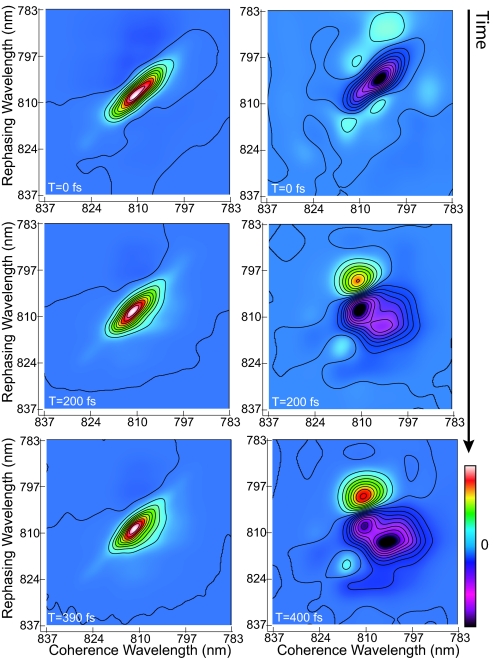
2D electronic spectra of FMO from P. phaeum measured with conventional 2D electronic spectroscopy (all-parallel polarizations) and cross-peak-specific 2D electronic spectroscopy (π/3, −π/3, 0, 0 polarizations) are shown in Fig. 1, respectively. The spectra, corresponding to the real part of the signal electric field, were obtained at 77 K for population times T = 0, 200, and 400 fs. The all-parallel spectra show some similarity to the 2D spectra of FMO from C. tepidum, published previously (4, 5), with the dominant feature being a wide positive peak along the diagonal composed of several exciton states with linewidths larger than the spacing between them. Some population relaxation occurs within 400 fs, evidenced by a spreading of the main peak outward below the diagonal. In the all-parallel T = 0 correlation spectrum, the lowest exciton state is weakly visible on the diagonal at 824 nm. Distinct cross-peaks are not discernible, but excited-state absorption appearing in the all-parallel spectrum as negative (dark) features is asymmetric, being more pronounced above the diagonal. In a previous experimental and theoretical 2D investigation of bacterial Light-Harvesting Complex 3, this type of asymmetry was found to be a signature of weak electronic coupling in an excitonic aggregate, even in the absence of cross-peaks (6).
Fig. 1.
The evolution of the 2D electronic spectrum of P. phaeum FMO is shown. In the conventional 2D spectra (Left), the emergence of cross-peaks below the main diagonal is evidenced by the contour lines bowing away from the diagonal by 200 fs. In the cross-peak-specific spectra (Right), the emergence of the negative features below the main diagonal corresponds to the cross-peaks largely obscured in the conventional 2D spectra.
The cross-peak-specific spectra in Fig. 1 feature several discrete peaks and appear completely distinct from the conventional 2D electronic spectra. In particular, the large-amplitude peaks along the diagonal resulting from initially populated exciton states are absent, as predicted from the polarization-dependent orientational factors for the corresponding response functions. As a result, the signal for the T = 0 cross-peak-specific spectrum is weaker than at later times or for the all-parallel case (in Fig. 1 each spectrum is normalized to its absolute maximum), but it is apparent that the pronounced negative peak is substantially inhomogeneously broadened (elongated on the diagonal) at T = 0 compared with the later times. Between 200 and 400 fs, relaxation appears in Fig. 1 as increased amplitude and spreading of the negative peak below the diagonal, corresponding to the dynamics visible in the all-parallel spectrum. The pathways that give rise to this spreading negative peak in the cross-peak-specific spectroscopy appear as positive features in conventional 2D spectroscopy, and the lower right edge of these negative features shows the same dynamics as the lower right edge of the off-diagonal features in the conventional 2D electronic spectrum. The slope of the nodal line between the strong, adjacent positive and negative peaks in the cross-peak-specific spectra decreases as a result of a loss of memory of initial transition frequencies because of solvent-induced fluctuations (9). An additional small, positive cross-peak near (coherence wavelength 815 nm, rephasing wavelength 820 nm) is visible in the polarized spectrum but not in the all-parallel spectrum. The emergence of these hidden features in the cross-peak-specific spectra demonstrates its utility in revealing spectral structure and extracting dynamical timescales in electronically coupled systems.
Discussion
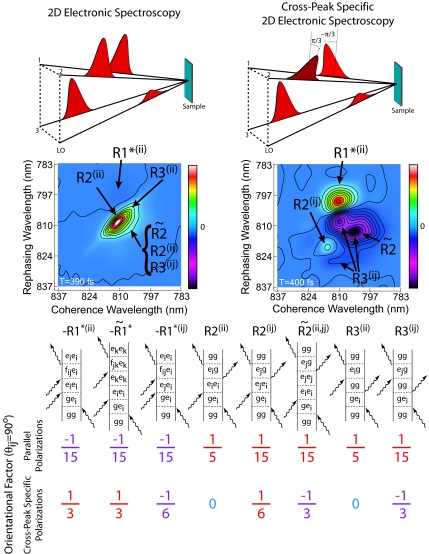
2D spectroscopy probes the third-order optical polarization, which can be represented as a convolution of the third-order material response function, R(3), with the electric fields of the three laser excitation pulses. The response function formalism for interpretation of nonlinear spectroscopic signals has been developed by Mukamel (10) and has been presented for interpretation of 2D electronic spectra (5, 11–13). This framework for understanding the physical mechanisms giving rise to 2D signals forms the basis for our theoretical simulations of 2D spectra presented below. More rigorously, within the impulsive limit (infinitely short excitation pulses) for the third-order signal measured in the phase-matched direction, only three rephasing terms of the total resonant third-order response function survive. Using the standard labeling scheme (10), these response functions are R2, R3, and R*1. These three terms can be further divided into eight contributions corresponding to eight types of Liouville pathways that are most important for interpretation of the signal, represented pictorially by Feynman diagrams in Fig. 2. The total response function, to which the measured signal is proportional, is given as RS = R2 + R3 − R*1, so the pattern in the 2D spectrum results from interference of multiple energy level pathways. Of the three terms, only R*1 involves excitation to a two-exciton state, and therefore it is this term that gives rise to excited-state absorption. Both R2 and R3 describe the fields interacting only with states in the one-exciton manifold, but R3 describes response of the system when in the ground state during the population time and therefore is not affected by any population relaxation.
Fig. 2.
Conventional 2D electronic spectroscopy is contrasted with the cross-peak-specific 2D spectroscopy. (Top) The pulse trains for each technique are shown schematically indicating the time ordering and polarizations of the pulses. (Middle) Annotated 2D spectra show the dominant response pathways responsible for each spectral feature. (Bottom) All observable response pathways are shown with their corresponding orientational factors in a weak coupling limit; these factors are colored to indicate which responses contribute negative and positive features to both the conventional and cross-peak-specific 2D spectra.
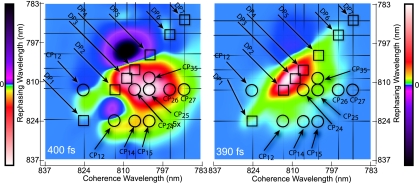
The vast amount of information contained in 2D spectra can be overwhelming, even after comparison with detailed simulations. In an oversimplified, but still useful, interpretation of the 2D spectra presented here, the coherence wavelength can be thought of as an “absorption wavelength,” whereas the rephasing wavelength can be considered an “emission wavelength.” In this framework, energy transfer or coupling would appear as an off-diagonal peak, and it is these peaks that make 2D spectroscopy so powerful. In Fig. 3, we interpret a spectrum in this manner and demonstrate the amount of additional information offered by the cross-peak-specific method in dissecting the off-diagonal features of the 2D spectrum. In this figure, we invert the coloration of the cross-peak-specific spectrum; this inversion enables direct visual comparison of the major pathways. The notation used to label the eight pathways is adapted from Cho and Fleming (14). The upper indices denote interaction of the field nominally with a single one-exciton state (for example, R2(ii) or R*1(ii) where the asterisk implies a complex conjugate), two different one-exciton states [R3(ij)], or population transfer (denoted by a tilde) between one-exciton states [R̃**2(ii,jj)]. The diagrams shown are representative of the types of interactions in FMO, where the 7 BChl sites of the monomer give rise to 7 one-exciton states and 21 two-exciton states. Rephasing pathways involving coherence transfer may also contribute to the signal, and recent work on FMO from C. tepidum suggests that it could play an important role in these types of complexes (15); however, in this work, the secular approximation to the Redfield superoperator is adopted, and only the eight types of pathways in Fig. 2 were considered in simulations.
Fig. 3.
The cross-peak-specific 2D (Left) and conventional 2D (Right) electronic spectra are shown. Both spectra are colored by using a nonlinear ArcSinh coloration to emphasize smaller features, and the cross-peak-specific coloration is inverted to facilitate direct visual comparison of the cross-peaks to those in the conventional 2D spectrum. Diagonal peaks (DPi) are shown with squares, and cross-peaks (CPij) are denoted with circles. The shape of the edge of the cross-peak regions agree between the spectra, but significant additional structure is visible in the cross-peak-specific spectrum. (Left) Polarization = π/3, −π/3, 0, 0. (Right) Polarization = 0, 0, 0, 0.
The dependence of response functions on the linear polarizations of the laser pulses and relative orientations of transition dipoles is described by an orientational factor, as discussed for isotropic systems by Hochstrasser (8). Polarization conditions for 2D IR spectra were further explored by Dreyer et al. (7) using the following equation for the orientational factors:
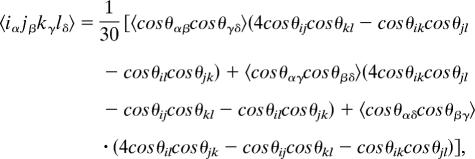 |
where i, j, k, and l are polarizations in the laboratory frame, and α, β, γ, and δ are dipole moments in the molecular frame. The orientational factors are given for the all-parallel and cross-peak-specific sequences in Fig. 2 Bottom; these factors correspond to each of the eight Liouville pathways, assuming the projection angle between one-exciton state transition dipoles is 90°. This figure includes information for excited-state absorption and relaxation pathways not shown by Dreyer et al. (7), and we have corrected two errors in their table. These factors provide a key for inferring structural information from 2D spectra in the form of projection angles between transition dipole moments, as demonstrated by several groups in the IR (16–18). Additionally, the signs corresponding to the orientational factors for a given pathway allow us to assign spectral features, because in general pathways carry a certain sign regardless of the angle between coupled transitions (although R*1(ij) and coherence transfer pathways, which are not considered here, can be either positive or negative). According to the orientational factors, the only types of pathways giving rise to positive features under the (π/3, −π/3, 0, 0) polarization sequence are the R*1 pathways and R2(ij). Negative features result from R3(ij) and R̃2(ii,jj) (and possibly R*1(ij), depending on the excitonic mixing angle between the states), and signals from the R2(ii) and R3(ii) pathways, which are responsible for the strong diagonal peaks in conventional 2D spectroscopy, are eliminated with this cross-peak-specific polarization technique.
The features apparent in the cross-peak-specific spectra of Fig. 1 can be analyzed in more detail. Because the weak signal at T = 0 approaches the noise floor, we focus on the T = 200 and 400 fs spectra. The strong positive feature above the diagonal corresponds to a negative region in the all-parallel spectrum, although it is much more difficult to discern there because of the large adjacent features, and because it is oppositely signed, it must result mainly from R*1(ii) pathways. The R*1(ii) pathway involves a coherence with a two-exciton state during the rephasing time and gives rise to an off-diagonal excited-state absorption feature. The two negative features in the cross-peak-specific spectra are more difficult to assign, although R3(ij) and R̃2(ii,jj) should each contribute more amplitude than R*1(ij) based on their orientational factors. R3(ij) results from sequential coherent excitation of exciton states and appears symmetrically on either side of the diagonal. This pathway is responsible for the cross-peaks because of coupling in 2D spectra, whereas R̃2(ii,jj), because of population relaxation, appears mainly in the downhill direction below the diagonal (although the exciton spacings here are on the order of kBT) and appears stronger at later times. The predominant negative features in the cross-peak-specific spectra seem to possess both characteristics: the two peaks appear on either side of the diagonal, but there is a downward motion between 200 and 400 fs, suggesting that coherent couplings play a role in this region of the spectrum, but that at later times energy transfer dominates. The small positive feature just below the diagonal labeled R2(ij) in Fig. 2 is significant, because it appears in a region where no excited-state absorption was observed in the all-parallel spectrum. The location in the spectrum suggests that it arises from the cross-peak between excitons 1 and 2. In particular, both above and below the main diagonal, the expected location of the cross-peak between excitons 1 and 2 falls on a node between positive and negative features in Fig. 3. Both of these features arise from the coupling between the excitons, and the node is due to interfering pathways with opposite sign: R2(ij) and R3(ij).
The R2(ij) pathway is unusual because it involves a coherence between one exciton states that evolves (and dephases) during the population time. That this signal persists until at least 400 fs implies a long lived coherence. In an investigation of the FMO complex from C. tepidum, a pronounced quantum beating signal was observed in exciton 1, and its relative distance from the other exciton states in the spectrum facilitated discernment of the beating signal (15). The population time points taken here for the cross-peak-specific and all-parallel spectra of P. phaeum were not frequent enough to resolve beating, but as in C. tepidum, the combination of strong coupling between exciton 1 and other excitons and its relative separation in frequency gives rise to clear evidence of coupling, namely the visible positive R2(12) cross-peak in the cross-peak-specific spectrum. Moreover, the quantum beating investigation of C. tepidum revealed long lived coherences (>600 fs) between exciton 1 and the other excitons, suggesting that assignment to the R2(12) pathway is not unreasonable for the relatively long lived positive cross-peak.
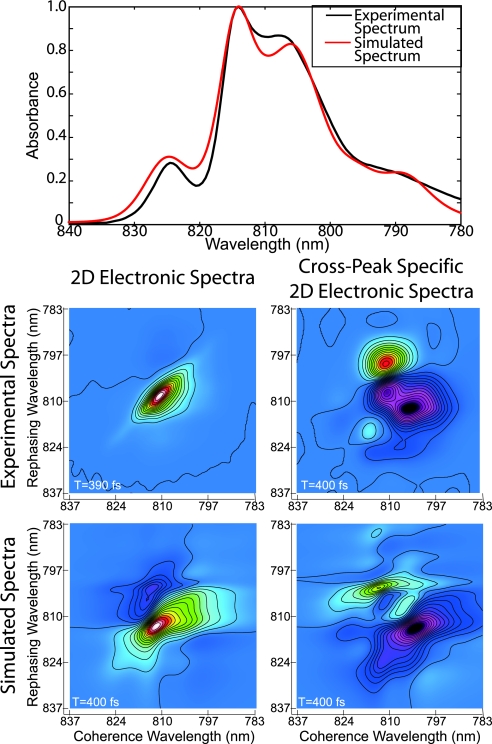
Theoretical simulations of the 2D spectra were performed as described in Zigmantas et al. (6). Briefly, a Frenkel exciton model Hamiltonian of FMO including one- and two-exciton states is built from site energies (corresponding to the BChl Qy transitions) of each of the seven chromophores and coupling energies between each site. The structure of FMO from P. phaeum has not yet been solved, so the 1.9-Å; crystal structure from P. aestuarii (19) [which has a linear absorption spectrum more similar to our measured spectrum (Fig. 4) than that of C. tepidum], was used to assign relative orientations between the Qy transition dipole moments. The starting-point Hamiltonian was taken from Adolphs and Renger (20). Interaction of the BChls with the protein environment was described by an inhomogeneous distribution of site energies and an energy gap correlation function assigned to each site to describe fluctuating transition energies. Explicit averaging over a static distribution of site energies was carried out, and analytic averaging over the orientations of the complexes in the sample with respect to the laser pulse polarizations was performed as in Dreyer et al. (7). Relaxation rates between states were calculated by using modified-Redfield theory (21, 22). As described by the response functions above, calculations were performed in the impulsive limit, and only rephasing Liouville pathways were considered. The finite bandwidth of the laser pulses was taken into account by weighting the 2D spectrum with a Gaussian pulse spectrum.
Fig. 4.
Comparison of experimental and theoretical spectra from P. phaeum at 77 K. (Top) Measured (black) and simulated (red) linear absorption spectra. Corresponding measured (Middle) and simulated (Bottom) 2D electronic spectra (Left) and cross-peak-specific (Right) 2D electronic spectra at 77 K and T = 200 fs. The theoretical simulations show qualitative agreement with the major features of the linear and 2D spectra.
The measured and calculated linear absorption spectra of FMO from P. phaeum are presented in Fig. 4. The measured and theoretical parallel and (π/3, −π/3, 0, 0) cross-peak-specific 2D real spectra at T = 400 fs are also shown. Site and coupling energies of the input Hamiltonian were varied initially to fit the linear absorption spectrum and then adjusted considering the 2D spectra. After adjustment of Hamiltonian parameters, the linear spectrum and the theoretical parallel 2D spectrum match the corresponding experimental spectra quite well, suggesting that the model reproduces well the energy level spacings and dipole strengths of the system. However, the cross-peak-specific spectrum does not agree well with the theoretical prediction, despite some similarity of the major features. In particular, discrepancies in the lineshapes and relative peak amplitudes indicate a failure of the current dynamical model, which neglects coherence transfer processes, pulse overlap effects, relaxation between vibronic levels, and correlated motion at two or more sites in the protein bath. The modeling results suggest that the cross-peak-specific 2D spectrum exhibits significant and new information not readily accessible from the linear and conventional 2D spectra and that, because of its inherent sensitivity to dynamical processes as evidenced by evolution of off-diagonal features, the technique may aid in the testing of more sophisticated quantum dynamical theories.
Conclusions
The dominance of main diagonal features arising from initially populated exciton states in a 2D spectrum often hinders extraction of useful information, especially in the visible regime where broad linewidths congest spectra. Using cross-peak-specific 2D spectroscopy, we observe off-diagonal cross-peaks in P. phaeum FMO that would otherwise be obscured by wings of main diagonal spectral features. The evolution of the cross-peaks in the cross-peak-specific spectroscopy matches the observable evolution in a standard 2D spectrum, indicating that our technique is properly eliminating the main diagonal features while preserving the coupling peaks. From our analysis of the 2D spectra of FMO from P. phaeum, we find that elimination of the diagonal features reveals the intermolecular interactions that govern energy transfer dynamics central to FMO's role in light-harvesting. In addition, dynamical timescales are more readily apparent in the polarized spectra, because signals arising from relaxation processes are enhanced and because less-congested spectra allow for improved resolution of peak-shapes. Furthermore, signs of orientational factors based on different Liouville pathways and their dependence on polarization conditions prove to be another tool for analysis of 2D spectra. Because different response pathways responsible for cross-peaks, specifically R2(ij) and R3(ij), appear with opposite sign within the cross-peak-specific spectra, we are able to characterize observed spectral features by pathway for direct comparison to numerical models. The use of additional polarization conditions for 2D electronic spectroscopy also could be explored. In particular, the (0, π/2, −π/4, π/4) sequence as described by Dreyer et al. (7) could be especially useful, because it eliminates all response terms except for those arising from pathways where the system is in a coherence state during the “population” time. Evidence for coherence transfer has been observed in other FMO complexes (15), and in experiments presented here, we see more confirming evidence for long lived coherence. Cross-peak-specific 2D spectroscopy offers vastly improved resolution of the cross-peak regions near the main diagonal features and will arbitrate between otherwise indistinguishable models for 2D and linear spectra.
Experimental Methods
The FMO protein P. phaeum was isolated essentially as described by Li et al. (23) for C. tepidum, with the modification that ion exchange was replaced by sucrose gradient centrifugation and gel filtration chromatography. The sample was dissolved in a buffer of 100 mM Tris·HCl (pH 8.0) by using 0.25% Anzergent 3-12 to improve solubility, then mixed 30:70 (vol/vol) with glycerol as a cryoprotectant, sealed in a 200-μm quartz cell (Starna), and placed in a cryostat at 77 K. The OD of the sample at 805 nm was measured to be 0.10.
Ultrafast (43 fs) laser pulses centered at 807 nm (30 nm FWHM) were generated in a home-built titanium sapphire oscillator and regenerative amplifier (24). The pulses were characterized by using Frequency Resolved Optical Gating, and the stability of the power was measured to be <0.50% for the duration of the experiment. This 3.4-kHz pulse train was coupled into our 2D electronic spectroscopy system. During the experiment, the energy on the sample from the three pump beams was 16 nJ, and the beams were focused to a 70-μm beam waist within the sample.
The 2D ultrafast electronic spectroscopy apparatus has been described (1, 13). In brief, the photon echo signal is generated by a series of three ultrafast laser pulses incident on the sample and heterodyne-detected by using spectral interferometry after mixing with a fourth local oscillator pulse. The signal detected in the phased-matched direction depends on the time between the first two pulses τ (the coherence time) during which a coherence evolves and on the time between the second two pulses T (the population time) during which a population state evolves. After some time t (the rephasing time), the photon echo is emitted and detected. Phase stability must be maintained throughout this measurement.
Implementing the cross-peak-specific 2D spectroscopy required that we rotate the polarization of some of the four pulses involved in the experiment, and the phase stability requirement dictated that we must accomplish this with minimal disruption to the inherent phase stability of the system (13). We insert true zero-order half-waveplates into each of the first two pulses' paths after the spherical mirror. By selecting only two pulses to modify, we maintained the highest degree of phase stability possible. We chose these specific pulses because the geometry of the apparatus leaves these beam paths most accessible and closest to the optical table. We rotated the polarization of the first pulse by π/3 rad, whereas the second pulse's polarization was rotated by −π/3 rad. The accuracy of the polarization rotation was verified to within 2°.
Timing in the experiment was verified by using a BBO doubling crystal. Because the first two interactions have different polarizations, phasing of the detected signal field is not possible by direct comparison to pump probe spectra. Instead, the phasing of the signal must be accomplished in a more complicated fashion. In particular, the phase of the observed signal depends on the phase of the third pulse relative to the local oscillator which can be directly and accurately measured with spectral interferometry, and the phase of the first two pulses relative to one another. This phase difference cannot be accurately measured with spectral interferometry because of the small delay between the pulses. Instead, we controlled the phase by precisely controlling the timing between the pulses. These pulses were phase-locked at the diffractive optic, and the physical pathlength to the sample was identical for both pulses reflecting only off the spherical mirror and flat mirrors. The fused silica wedges used for delay stages allowed precise compensation for differences in the thickness between the fused silica substrates backing the zero-order waveplates, and the waveplates themselves were by definition tightly controlled to permit precisely a half wave of retardation. Comparison with standard pump–probe phasing techniques indicates that phasing accuracy can be controlled to ≈5°.
Acknowledgments
We thank Heather Matthies for purification of the FMO protein sample. This work was jointly supported by the Department of Energy (DOE) and National Science Foundation at Lawrence Berkeley National Laboratory and University of California at Berkeley and by the DOE at Washington University. G.S.E. was supported by the Miller Institute for Basic Research in Science. T.K.A. was supported by the Korea Research Foundation Grant funded by the Korean Government (MOEHRD).
Abbreviations
- BChl
bacteriochlorophyll
- FMO
Fenna–Matthews–Olson complex.
Footnotes
The authors declare no conflict of interest.
This article is a PNAS Direct Submission.
References
- 1.Brixner T, Stiopkin IV, Fleming GR. Opt Lett. 2004;29:884–886. doi: 10.1364/ol.29.000884. [DOI] [PubMed] [Google Scholar]
- 2.Jonas DM. Annu Rev Phys Chem. 2003;54:425–463. doi: 10.1146/annurev.physchem.54.011002.103907. [DOI] [PubMed] [Google Scholar]
- 3.Cowan ML, Ogilvie JP, Miller RJD. Chem Phys Lett. 2004;386:184–189. [Google Scholar]
- 4.Brixner T, Stenger J, Vaswani HM, Cho M, Blankenship RE, Fleming GR. Nature. 2005;434:625–628. doi: 10.1038/nature03429. [DOI] [PubMed] [Google Scholar]
- 5.Cho MH, Vaswani HM, Brixner T, Stenger J, Fleming GR. J Phys Chem B. 2005;109:10542–10556. doi: 10.1021/jp050788d. [DOI] [PubMed] [Google Scholar]
- 6.Zigmantas D, Read EL, Mancal T, Brixner T, Gardiner AT, Cogdell RJ, Fleming GR. Proc Natl Acad Sci USA. 2006;103:12672–12677. doi: 10.1073/pnas.0602961103. [DOI] [PMC free article] [PubMed] [Google Scholar]
- 7.Dreyer J, Moran AM, Mukamel S. Bull Korean Chem Soc. 2003;24:1091–1096. [Google Scholar]
- 8.Hochstrasser RM. Chem Phys. 2001;266:273–284. [Google Scholar]
- 9.Demirdoven N, Khalil M, Tokmakoff A. Phys Rev Lett. 2002;89:237401. doi: 10.1103/PhysRevLett.89.237401. [DOI] [PubMed] [Google Scholar]
- 10.Mukamel S. Principles of Nonlinear Optical Spectroscopy. New York: Oxford Univ Press; 1995. [Google Scholar]
- 11.Mancal T, Pisliakov AV, Fleming GR. J Chem Phys. 2006;124:234504. doi: 10.1063/1.2200704. [DOI] [PubMed] [Google Scholar]
- 12.Pisliakov AV, Mančal T, Fleming GR. J Chem Phys. 2006;124:234505. doi: 10.1063/1.2200705. [DOI] [PubMed] [Google Scholar]
- 13.Brixner T, Mančal T, Stiopkin IV, Fleming GR. J Chem Phys. 2004;121:4221–4236. doi: 10.1063/1.1776112. [DOI] [PubMed] [Google Scholar]
- 14.Cho MH, Fleming GR. J Chem Phys. 2005;123:114506. doi: 10.1063/1.1955444. [DOI] [PubMed] [Google Scholar]
- 15.Engel GS, Calhoun TR, Read EL, Ahn TK, Mancal T, Chung Y-C, Blankenship RE, Fleming GR. Nature. 2006;446:782–786. doi: 10.1038/nature05678. [DOI] [PubMed] [Google Scholar]
- 16.Zanni MT, Ge NH, Kim YS, Hochstrasser RM. Proc Natl Acad Sci USA. 2001;98:11265–11270. doi: 10.1073/pnas.201412998. [DOI] [PMC free article] [PubMed] [Google Scholar]
- 17.Demirdoven N, Cheatum CM, Chung HS, Khalil M, Knoester J, Tokmakoff A. J Am Chem Soc. 2004;126:7981–7990. doi: 10.1021/ja049811j. [DOI] [PubMed] [Google Scholar]
- 18.Woutersen S, Hamm P. J Phys Chem B. 2000;104:11316–11320. [Google Scholar]
- 19.Tronrud DE, Schmid MF, Matthews BW. J Mol Biol. 1986;188:443–454. doi: 10.1016/0022-2836(86)90167-1. [DOI] [PubMed] [Google Scholar]
- 20.Adolphs J, Renger T. Biophys J. 2006;91:2778–2797. doi: 10.1529/biophysj.105.079483. [DOI] [PMC free article] [PubMed] [Google Scholar]
- 21.Zhang WM, Meier T, Chernyak V, Mukamel S. J Chem Phys. 1998;108:7763–7774. [Google Scholar]
- 22.Yang MN, Fleming GR. J Chem Phys. 2003;119:5614–5622. [Google Scholar]
- 23.Li YF, Zhou WL, Blankenship RE, Allen JP. J Mol Biol. 1997;271:456–471. doi: 10.1006/jmbi.1997.1189. [DOI] [PubMed] [Google Scholar]
- 24.Joo T, Jia YW, Fleming GR. Opt Lett. 1995;20:389–391. doi: 10.1364/ol.20.000389. [DOI] [PubMed] [Google Scholar]


