Abstract
Using inelastic electron tunneling spectroscopy (IETS) to measure the vibronic structure of nonequilibrium molecular transport, aided by a quantitative interpretation scheme based on Green's function-density functional theory methods, we are able to characterize the actual pathways that the electrons traverse when moving through a molecule in a molecular transport junction. We show that the IETS observations directly index electron tunneling pathways along the given normal coordinates of the molecule. One can then interpret the maxima in the IETS spectrum in terms of the specific paths that the electrons follow as they traverse the molecular junction. Therefore, IETS measurements not only prove (by the appearance of molecular vibrational frequencies in the spectrum) that the tunneling charges, in fact, pass through the molecule, but also can be used to determine the transport pathways and how they change with the geometry and placement of molecules in junctions.
Keywords: molecular electronics, molecular junctions, molecular transport
The electron-transfer process is crucial in chemistry, materials science, condensed matter physics, and electrical engineering. Although it is always modeled either explicitly or implicitly by pathways (how electrons actually move within the molecule), there is as yet no direct measurement or observation of such pathways. The pathways idea has been present in physical organic chemistry for years in connection with reaction mechanisms and has been widely used in the interpretation of electron tunneling pathways in proteins (1), but no distinct observations have been made. The absence of direct measurement of pathways is because the measurements are usually made starting with an equilibrium structure, exciting quickly (optical spectroscopy), and then observing the new perturbed structure. Although it is instructive to observe these initial and final states, they are static snapshots and cannot capture the dynamics of the electron-transport process. In molecular transport junctions, where current is moving continuously through the molecule, the nonequilibrium inelastic electron tunneling spectroscopy (IETS) probe permits direct observation of how different modes modulate the transport and, therefore, can be used to deduce actual pathways.
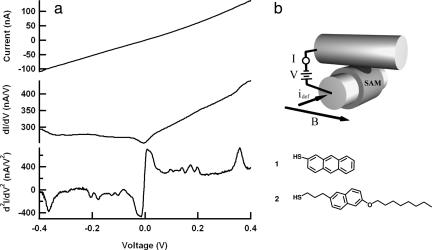
It is well established that tunneling electrons can lose energy through excitation of a molecular vibrational level contained within the tunnel junction (2–5). The threshold for such excitation is eV = ħω where V is the bias voltage and ħω is the energy of the molecular vibration. Peaks in d2I/dV2 versus V, or more commonly the normalized quantity (d2I/dV2)/(dI/dV) versus V, correspond to molecular vibrations. IETS has become quite popular in the field of molecular electronics over the last 3 years (6–9) and has distinguished itself as a unique spectroscopic probe of molecular junctions. Because an IET spectrum is acquired directly from the measured transport characteristics (Fig. 1), the only added experimental requirement is the ability to cool the junction. From comparison between experiments and computations (10–17), IETS is useful for characterizing numerous aspects of molecular junctions such as the actual presence of the molecule, information on the nature of the interfaces (18), the orientation of the molecule (19), and some symmetry aspects of the junction (20, 21).
Fig. 1.
Charge-transport characteristics of a (2-octaoxynaphth-6-yl)propanethiol junction. (a) Standard Ac modulation techniques along with two lock-in amplifiers are used to record the first and second harmonic signals (proportional to dI/dV and d2I/dV2, respectively) simultaneously with the current–voltage (I–V) characteristics. Although the I–V trace is featureless, steps in dI/dV and peaks in d2I/dV2 corresponding to molecular vibrations of 2 are clearly visible. (b) (Upper) Schematic illustration of a crossed-wired tunnel junction is shown. Transport measurements were performed with a custom-built cryogenic crossed-wire tunnel junction apparatus as reported in refs. 6 and 33. Two 10-μm-diameter Au wires, one coated with a monolayer of the molecule of interest (shown schematically), are mounted inside a stainless steel vacuum can that is evacuated and purged with He gas before being lowered into a liquid He storage Dewar flask. The Lorentz force generated from idef and the applied magnetic field B is used to bring the two wires gently together. All transport measurements were made at liquid He temperature. A modulation amplitude of 8-mV rms was used for acquisition of all spectra. (Lower) The structure of 1 and 2 is shown.
In the current contribution, we investigate how the inelastic signatures provide information about the actual pathways followed by the tunneling electron. Only vibrations that involve atoms lying along favorable tunneling pathways are active in IETS (because only these motions modulate the electron transport). If we can obtain good assignment of the IET spectrum, it should be possible (at least for medium-sized molecules) to reconstruct the path followed by the tunneling electrons, always remembering that the tunneling path actually comprises the atomic orbitals that describe the electronic motion rather than the position of the atomic nuclei themselves.
Computational Approach
The IETS is due to electron/vibration interaction in the transport junction. The general problem is a complicated one, and when the charge injection gap ΔEG is small (of order Γ, the decay rate of an electron from the molecule to the electrode, also often called the spectral density), strong vibronic coupling in the injection region can lead to switching, hysteresis, activation, heating, reaction, and dephasing behavior (22–27). But for most simple organics with Au electrodes, the injection gap ΔEG is large (more than ≈1 eV) for small applied voltage (V ≤ 0.4 V) so that the Landauer–Buttiker contact time is smaller than a vibrational period and, thus, vibronic coupling is a weak effect (28). This is the Landauer–Imry regime, in which transport occurs by a coherent tunneling process. The simplest interpretation of an IET spectrum is then based on the perturbation theory because in this regime (coherent tunneling limit and very far in energy from electronic resonances), one can expand the low-voltage transmission of a molecular junction in terms of a normal coordinate analysis. The formal analysis and development of the perturbation theory approach to IETS is presented elsewhere (29), along with comparisons with experiment for several molecules (10) demonstrating its remarkable accuracy for predicting the peak positions and intensities in the IET spectrum (the actual line shapes are a more difficult problem) (30). This approach is complementary to, and generally simpler than, other theoretical treatments of molecular IETS; it is well justified only in the Landauer–Imry tunneling regime discussed above.
In this energy range, the low-voltage conductance is given by the Caroli-type expression for the conductance g:
In this equation, EF is the Fermi energy, ΓL(R) is the spectral density coupling the molecular ends with the left (or right) electrode, G is the retarded Green's function for the molecule in the junction, and go is the conductance quantum equal to 1/12.8 kΩ. To examine IETS within this coherent regime, it is convenient to expand the Green's functions in the molecular coordinates (in a fashion reminiscent of the Herzberg–Teller treatment of potential energy surfaces in discussing optical spectra). Under these conditions, one can predict the intensity peak due a molecular vibration Qα in an IET spectrum as (10):
Here, Gα is the derivative of the retarded Green's function with respect to the normal coordinate Qα: effectively, it is a measure of how strongly the molecular vibration Qα modulates the electronic coupling between the two electrodes.
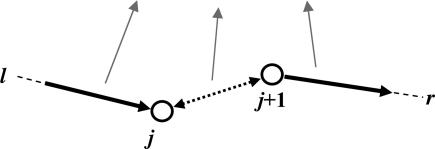
All tunneling paths between two atomic orbitals, l and r (in contact with the left and right electrodes), contribute additively to the Green's function matrix element Glrα. Expanding Glrα, we obtain
 
|
As illustrated by the chart above, the GlP(j)P represents propagation from the left electrode to orbital j along path P, GP (j+1) rP represents the propagation from orbital j+1 to the right electrode, and ∂VP(j),P(j+1)/∂Qα represents the variation of the j, j+1 orbital coupling because of the vibration Qα. The pathway interpretation shows that in the Landauer–Imry regime, the IETS contribution of a vibration Qα will be large only if (i) the change of the transport arising from the variation of a given local distortion is large along a given path, (ii) the local distortion is significantly represented in Qα, and (iii) the path is strongly coupled to the electrodes. The actual computational scheme uses the B3LYP and a 6-31G* basis, and directly calculates the terms in Eq. 2. The details of the implementation are described in ref. 31. The isolated molecules are geometrically optimized by using this same density functional theory scheme. The normal coordinates of the molecules are labeled sequentially with the lowest frequency normal mode assigned no. 1, the second-lowest assigned no. 2, and so forth. Possible frequency shifts because of the presence of the electrode have been neglected (they should affect the very low frequency signals, which are not discussed in detail here).
Mode Analysis
To date, the observed IET spectra for molecular transport junctions have largely fallen into two groups. For alkyl thiolates and dithiolates, the tunneling between electrodes occurs only through σ orbitals of the carbon chain, whereas for conjugated dithiolates such as phenylene–vinylene and phenylene–ethynylene, tunneling is modulated through the π orbitals (6). The dominance of σ or π channels in these systems is to a large extent intuitive, determined by the nature of the molecules themselves, and can be confirmed by comparison of experimental and simulated IET spectra. The computed spectra agree rather well with the experimental, even if only the σ channel is considered in the alkyls and only the π channel is considered in the conjugated species (10). For alkyl structures, tunneling along the carbon–carbon backbone is modulated by the C C stretch vibration centered at 1,350 cm−1, by the C
 H wagging modes near 950 cm−1, and by the C
 S stretching peak near 650 cm−1. The C
 H stretching vibration at ≈2,900 cm−1 observed for alkyl junctions is likely because of tunneling between the electrode and carbon backbone as will be discussed below (5, 8). For conjugated molecules, the primary inelastic signature is from C
 C and C
 C stretching modes as well as phenyl ring deformations associated with the π channel (5, 9). Propensity rules based on symmetry further limit the number of modes that might contribute to the signal (13).
The junctions we discuss here contain more complex molecular structures (1 and 2 in Fig. 1b), for which tunneling may be expected to occur through a combination of σ and π channels, and where the tunneling electron excites vibrations that are localized to specific portions of the molecule. Both σ and π channels are important to the two molecules for differing reasons. In 1, it is a consequence of weak coupling at the nonbonded electrode, and in 2, it is a direct result of the chemical structure.
Pathways for Electron Tunneling
Anthracene Thiol.
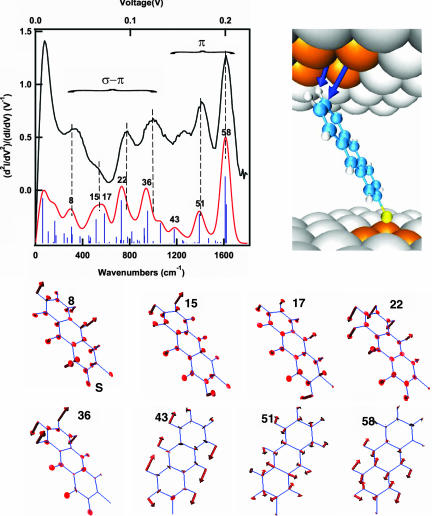
For molecular junctions formed from Au electrodes and a monolayer of 1, the direct chemical linkage to one metal electrode, through the thiolate interaction, gives a large spectral density and strong coupling in contrast with the other metal–molecule interface, where only a physical contact between the terminal hydrogen and electrode occurs (32). There is no strong chemical interaction at this nonbonding contact and, therefore, there are only weak spectral density and minimal mixing of electronic states. At the nonbonding interface, one expects the strongest electrode–molecule coupling to occur between the hydrogen s orbital, oriented toward the electrode, and the electrode itself. However, because one expects the most favorable tunneling pathway through the molecule to involve π orbitals in the anthracene fragment, which are electronically decoupled from the hydrogen s orbitals, the tunneling electrons might prefer to bypass the hydrogen atom and tunnel directly between the molecular π system and the electrode. This suggestion is directly supported by the IET spectrum shown in Fig. 2. The excellent correspondence between the computed and experimental spectrum for this junction enables us to analyze the individual vibrations that make up the IET spectrum, and from this derive information on the path of the tunneling charge carrier. In the high-energy range (1,100–1,600 cm−1), the symmetric combination of C C stretches (modes 51 and 58) dominates the spectrum. These vibrational modes are expected for π tunneling paths because they derive from electrons that tunnel from the electrode directly into the π system without passing through the σ orbitals of the terminal hydrogen atoms.
Fig. 2.
IET spectra of an anthracene thiol junction. Experimental (black) and computed spectra (red) of the anthracene (1) junction. Labels refer to the normal modes of the molecule computed in the absence of metal and numbered from the lowest energy vibration. Further computational details are given in ref. 13 and supporting information (SI) Tables 1 and 2. The observed normal modes belong to two groups: out-of-plane modes that favor the intercommunication between the σ and π tunneling channels and in-plane C C stretches that modulate the main π-type tunneling channel. The molecules couple to the electrode through the s orbital of the hydrogen and the pz orbital of the carbon. However, in the first case, only if the C
 H bond bends out of plane can the electron follow the most favorable tunneling path across the molecule.
In the energy range below 1,100 cm−1, the active normal modes (i.e., 15, 17, 22, and 36) have the common characteristic that they all contain an out-of-plane displacement of hydrogen atoms that are closer to the nonbonding molecule–electrode contact. These interfacial out-of-plane motions facilitate molecule–electrode coupling because they enable σ–π mixing: the electron initially tunnels into the hydrogen σ orbital and then is vibronically coupled to the molecular π system.
Alkyl Naphthyl Ether Thiol.
A more complicated situation arises in the naphthalene ether structure (2). Such molecular structures have been suggested as potential molecular diodes because they consist of a pseudoquantum dot (the aromatic naphthalene core) spaced asymmetrically between the electrodes by alkyl tails (33). Although our (low-voltage) study of this and related molecular structures has not found any diode-like properties, the complex electronic structure of 2 provides an interesting system for probing σ–π mixing. In 2, the electron is forced to tunnel into the orbitals of the C C-saturated alkyl chain on either end of the molecule, although the favorable tunneling across the central naphthyl fragment must involve localized π orbitals.
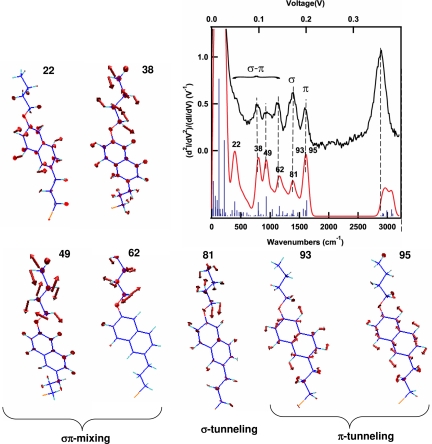
Our fully assigned IET spectrum (Fig. 3) again demonstrates very good agreement between theory and experiment, permitting us to attribute with confidence the observed signals to the depicted normal modes and to deconstruct the tunneling pathway. Three classes of vibrational modes are identified in the 300–1,700 cm−1 range. First, vibrations of the σ tunneling channel (mode 81, wagging) correlate well with the signal obtained for simple alkanes near 1,350 cm−1. Second, vibrations that modulate tunneling through the π orbitals of the naphthalene core; these are almost totally symmetric modes responsible for the peak at 1,600 cm−1(modes 93 and 95) and can be related to the hypothetical IETS on naphthalene itself. Third, vibrations near 800 and 1,200 cm−1 are modes 49 and 62, which allow the interchange between σ and π channels, corresponding to out-of-plane twisting motions of the CH2 on the alkyls or out-of-plane vibrations of the naphthalene fragment. Vibrations in the first two categories are derived from the two independent portions of the molecule, whereas the third category describes the interaction between the two otherwise orthogonal tunneling channels. In particular, mode 62 is a twisting of the alkyl group that would be absent in the alkane thiolate. It is made important in 2 because of the required symmetry mixing of σ and π orbitals along the pathway. Together, the three types of vibrations provide a fingerprint of the actual σ–π–σ tunneling pathway that occurs in the molecular junction. The signal at ≈2,900 cm−1, commonly found in alkane thiolates IETS, is less molecule-specific, and it is because of the C H stretching vibration encountered by the electron tunneling between the gold and the alkylic portion of the molecule.
Fig. 3.
IET spectra of a naphthyl ether junction. Experimental and computed spectra of 2; a set of IETS-active normal modes are shown. The low frequency modes are antisymmetric with respect to the symmetry plane of the molecule and they connect the σ and π tunneling channels (where the naphthalene and the alkyl fragments come into contact). Mode at 1,350 cm−1 is associated with σ tunneling through the alkyl fragment, whereas the modes at 1,600 cm−1 are in-plane C C stretching modes modulating the π-type tunneling through the naphthalene (the C
 H stretching modes ≈2,900 cm−1 are similar to those observed in simple alkane monothiolates).
In addition to providing information on the tunneling pathways in these two molecules of interest, the observations hint at the additivity/transferability of IETS. That is, IETS can probe the molecular type (conjugated or saturated) but is also sensitive to internal interfaces that can force a change in the tunneling mechanism. In 1, most of the distinctive peaks come from vibrations localized at the interface between the molecule and the electrode, where π orbitals are coupled by out-of-plane vibrations to the σ orbitals of the molecule that are, in turn, effectively coupled to the gold electrode. For 2, the interface is within the molecule itself: vibrations that favor the σ–π mixing in the vicinity of the contact between the naphthalene and the alkyl tail are the most characteristic signals in this molecule.
We believe that this IETS analysis is a remarkable demonstration of the ability of transport measurements to clarify the actual transport pathways that electrons take in passing through molecular junctions under nonequilibrium conditions. Although the perturbative model used here is expected to fail near electronic resonances, it works well for ordinary small organics where the coherent, electronically elastic Landauer–Imry regime characterizes the fundamental transport mechanism. Using standard molecular density-functional-theory calculation (the B3LYP correlation functional method and 6–31G* basis) schemes, we can fit the IETS quantitatively. This assignment, in turn, allows vibrational–normal coordinate-coupling analysis and, hence, an interpretative mapping of the actual transport pathway. As such, this combination of theory and experiment can be used to further our understanding of the geometries, chemistries, and transport mechanisms in the molecular junctions that are of interest in much of molecular electronics.
Supplementary Material
Acknowledgments
M.A.R. thanks the Materials Research Science and Engineering Center program, International Division, and the National Nanotechnology Initiative program (all of the National Science Foundation); A.T. thanks the Royal Society (U.K.); and J.M.B., L.B.P., R.D.v.Z., M.A.R., J.G.K., and D.R.S. thank the Defense Advanced Research Projects Agency for their support.
Abbreviations
- IET
inelastic electron tunneling
- IETS
IET spectroscopy.
Footnotes
The authors declare no conflict of interest.
This article contains supporting information online at www.pnas.org/cgi/content/full/0704208104/DC1.
References
- 1.Beratan DN, Betts JN, Onuchic JN. Science. 1991;252:1285–1288. doi: 10.1126/science.1656523. [DOI] [PubMed] [Google Scholar]
- 2.Jaklevic RC, Lambe J. Phys Rev Lett. 1966;17:1139–1140. [Google Scholar]
- 3.Stipe BC, Rezaei MA, Ho W. Science. 1998;280:1732–1735. doi: 10.1126/science.280.5370.1732. [DOI] [PubMed] [Google Scholar]
- 4.Smit RHM, Noat Y, Untiedt C, Lang ND, van Hemert MC, van Ruitenbeek JM. Nature. 2002;419:906–909. doi: 10.1038/nature01103. [DOI] [PubMed] [Google Scholar]
- 5.Hipps KW, Mazur U. J Phys Chem. 1993;97:7803–7814. [Google Scholar]
- 6.Kushmerick JG, Lazorcik J, Patterson CH, Shashidhar R, Seferos DS, Bazan GC. Nano Lett. 2004;4:639–642. [Google Scholar]
- 7.Wang WY, Lee T, Kretzschmar I, Reed MA. Nano Lett. 2004;4:643–646. [Google Scholar]
- 8.Cai LT, Cabassi MA, Yoon H, Cabarcos OM, McGuiness CL, Flatt AK, Allara DL, Tour JM, Mayer AS. Nano Lett. 2005;5:2365–2372. doi: 10.1021/nl051219k. [DOI] [PubMed] [Google Scholar]
- 9.Yu LH, Zangmeister CD, Kushmerick JG. Nano Lett. 2006;6:2515–2519. doi: 10.1021/nl061867j. [DOI] [PubMed] [Google Scholar]
- 10.Troisi A, Ratner MA. Phys Rev B. 2005;72 033408. [Google Scholar]
- 11.Sergueev N, Roubtsov D, Guo H. Phys Rev Lett. 2005;95:146803. doi: 10.1103/PhysRevLett.95.146803. [DOI] [PubMed] [Google Scholar]
- 12.Solomon GC, Gagliardi A, Pecchia A, Frauenheim T, Di Carlo A, Reimers JR, Hush NS. J Chem Phys. 2006;124:94704. doi: 10.1063/1.2166362. [DOI] [PubMed] [Google Scholar]
- 13.Kula M, Jiang J, Luo Y. Nano Lett. 2006;6:1693–1698. doi: 10.1021/nl060951w. [DOI] [PubMed] [Google Scholar]
- 14.Walczak K. Physica E. 2006;33:110–115. [Google Scholar]
- 15.Jiang J, Kula M, Lu W, Luo Y. Nano Lett. 2005;5:1551–1555. doi: 10.1021/nl050789h. [DOI] [PubMed] [Google Scholar]
- 16.Paulsson M, Frederiksen T, Brandbyge M. Nano Lett. 2006;6:258–262. doi: 10.1021/nl052224r. [DOI] [PubMed] [Google Scholar]
- 17.Asai Y. Phys Rev Lett. 2004;93:246102. doi: 10.1103/PhysRevLett.93.246102. [DOI] [PubMed] [Google Scholar]
- 18.Long DP, Lazorcik JL, Mantooth BA, Moore MH, Ratner MA, Troisi A, Yao YX, Ciszek JW, Tour JM, Shashidhar R. Nat Mater. 2006;5:901–908. doi: 10.1038/nmat1754. [DOI] [PubMed] [Google Scholar]
- 19.Troisi A, Ratner MA. Phys Chem Chem Phys. 2007;9:2421–2427. doi: 10.1039/b702377d. [DOI] [PubMed] [Google Scholar]
- 20.Troisi A, Ratner MA. Nano Lett. 2006;6:1784–1788. doi: 10.1021/nl0609394. [DOI] [PubMed] [Google Scholar]
- 21.Galperin M, Nitzan A, Ratner MA, Stewart DR. J Phys Chem B. 2005;109:8519–8522. doi: 10.1021/jp0457500. [DOI] [PubMed] [Google Scholar]
- 22.Blum AS, Kushmerick JG, Long DP, Patterson CH, Yang JC, Henderson JC, Yao YX, Tour JM, Shashidhar R, Ratna BR. Nat Mater. 2005;4:167–172. doi: 10.1038/nmat1309. [DOI] [PubMed] [Google Scholar]
- 23.Alavi S, Rousseau R, Patitsas SN, Lopinski GP, Wolkow RA, Seideman T. Phys Rev Lett. 2000;85:5372–5375. doi: 10.1103/PhysRevLett.85.5372. [DOI] [PubMed] [Google Scholar]
- 24.Segal D, Nitzan A, Davis WB, Wasielewski MR, Ratner MA. J Phys Chem B. 2000;104:3817–3829. [Google Scholar]
- 25.Galperin M, Ratner MA, Nitzan A. Nano Lett. 2005;5:125–130. doi: 10.1021/nl048216c. [DOI] [PubMed] [Google Scholar]
- 26.Komeda T, Kim Y, Fujita Y, Sainoo Y, Kawai M. J Chem Phys. 2004;120:5347–5352. doi: 10.1063/1.1647044. [DOI] [PubMed] [Google Scholar]
- 27.Ness H, Fisher AJ. Proc Natl Acad Sci USA. 2005;102:8826–8831. doi: 10.1073/pnas.0500389102. [DOI] [PMC free article] [PubMed] [Google Scholar]
- 28.Nitzan A, Jortner J, Wilkie J, Burin AL, Ratner MA. J Phys Chem B. 2000;104:5661–5665. [Google Scholar]
- 29.Troisi A, Ratner MA, Nitzan A. J Chem Phys. 2003;118:6072–6082. [Google Scholar]
- 30.Nitzan A. Nano Lett. 2004;4:1605–1611. [Google Scholar]
- 31.Troisi A, Ratner MA. J Chem Phys. 2006;125:214709. doi: 10.1063/1.2390698. [DOI] [PubMed] [Google Scholar]
- 32.Kushmerick JG, Holt DB, Yang JC, Naciri J, Moore MH, Shashidhar R. Phys Rev Lett. 2002;89 doi: 10.1103/PhysRevLett.89.086802. 086802. [DOI] [PubMed] [Google Scholar]
- 33.Larade B, Bratkovsky AM. Phys Rev B. 2003;68:235305. [Google Scholar]
Associated Data
This section collects any data citations, data availability statements, or supplementary materials included in this article.


