Abstract
Single human red cells were suspended in media with viscosities ranging from 12.9 to 109 mPa s and subjected to shear flow ranging from 1/s to 290/s in a rheoscope. This is a transparent cone-plate chamber adapted to a microscope. The motion of the membrane around red cells oriented in a steady-state fashion in the shear field (tank-tread motion) was videotaped. The projected length and width of the cells as well as the frequency of tank-tread motion were measured. One-thousand eight-hundred seventy-three cells of three blood donors were evaluated. The frequency increased with the mean shear rate in an almost linear fashion. The slope of this dependence increased weakly with the viscosity of the suspending medium. No correlation was found between the frequency and four morphological red cell parameters: the projected length and width of the cells as well as the ratio and the square root of the product of these quantities. The energy dissipation within the red cell membrane was estimated based on the measured parameters and compared to the energy dissipation in the undisturbed shear flow. At constant mean shear rate the rise of the energy dissipation with viscosity is slower whereas at constant viscosity the rise with the shear rate is steeper than in the undisturbed shear flow. A fit of the data collected in this work to a theoretical red cell model might allow one to determine intrinsic mechanical constants in the low deformation regime.
INTRODUCTION
The human erythrocyte is an incomplete cell in that it does not contain any organelles or cytoskeleton. Its cytoplasm is filled with a concentrated solution of hemoglobin that carries oxygen from the lung to the tissues and returns a portion of the carbon dioxide. Because the cytoplasm is liquid it offers only viscous resistance against shear flow. The elastic response of the red cell is exclusively due to the membrane. Basically three moduli determine its elasticity: the shear stiffness provided by the membrane skeleton, the resistance against a change in surface area, and the bending stiffness both provided by the lipid bilayer (1). Besides this elastic response the membrane displays viscous resistance, mainly against a two-dimensional (2D) shear deformation.
These four mechanical parameters have been measured with various techniques mainly employing micropipettes (1). An advantage of these techniques is that they impose mechanical boundary conditions simple enough to be treated mathematically. A disadvantage are the methods of deformation that are far from what the red cell is subjected to in the circulation. This sheds some doubt on the applicability of the collected parameters when flow situations similar to those occurring in the circulation are modeled (2–7).
At low shear rates as in the venous system the red cells assume basically their resting shape (8), i.e., a biconcave disk, and aggregate into so-called rouleaux. With increasing shear rates the rouleaux become dispersed and the red cells become deformed. Close to the wall of rapidly perfused arterioles the shear rates are high enough to elongate the red cells parallel to the flow direction (9). Concomitant with this elongation the cytoplasm is driven in a kind of eddy flow. Transmission of the external shear flow to this cytoplasmic eddy flow occurs via a motion of the membrane around the elongated red cell. This motion has been called tank-tread motion (10). Upon entrance into a blood capillary with diameters smaller than their own diameter red cells become folded (8). At large flow velocities these shapes turn into the so-called slipper shape (8,11,12).
To mimic red cell elongation and tank-tread motion as observed in whole blood but to avoid their irregular appearance red cells can be suspended at low hematocrit in salt solutions, the viscosity of which is increased by addition of dextran (9). This way the traction exerted by neighboring red cells in whole blood is replaced by the shear stress of the viscous suspending fluid. Below a threshold in shear rate the red cells are close to their biconcave resting shape and rotate like solid bodies. The threshold value depends on the viscosity of the suspending medium (η0). It decreases with increasing η0. Above this threshold the red cells become elongated and oriented in a steady-state fashion in the shear field. The tank-tread motion can be observed via marker particles attached to the membrane (13).
Two groups have investigated the dependence of the frequency of the tank-tread motion (f) on shear rate ( ) and η0 (13,14). Both found a linear dependence of f on
  i.e., a constant value for
  However, a discrepancy existed with respect to the dependence on η0. Fischer et al. (13) found no dependence whereas Tran-Son-Tay (14) found an increase of
  by a factor of 1.8 when η0 was increased by a factor of 10.
The motivation for this study was twofold. First, the above-mentioned discrepancy was to be resolved by evaluating more cells than in the previous studies. Second, reliable experimental data are required for comparison to mathematical models of tank-treading red cells (4,15). In the end the evolution of computer models and their fit to experiments might allow one to extract mechanical parameters that are more appropriate to model in vivo flow situations.
Besides increasing the size of the samples, two other improvements were made. First, the method of determining the gap thickness of the flow chamber was improved by performing a large series of independent measurements. Second, a newly developed method to prepare dextran solutions in which the red cells have their normal volume was applied. This is important because it has been shown that shrinking in hypertonic suspending media changes the mechanical behavior of red cells (16).
MATERIALS AND METHODS
Chemicals
NaCl and KCl were from Merck (Darmstadt, Germany), and Hepes was from Sigma (St. Louis, MO). The sources of the dextrans are shown in Table 1. Polystyrene latex spheres were from Dow Chemical (Midland, Michigan).
TABLE 1.
Dextrans used in this study
| Name | MW/kD | Company | Lot No. | η0/mPa s |
|---|---|---|---|---|
| Dextran FP 60 | 61.8 | Serva (Heidelberg, Germany) | 03327 | 12.9 |
| Dextran T 110 | 105.0 | Pharmacia (Uppsala, Sweden) | 7427 | 28.9 |
| Dextran 500 | 497.0 | Serva | G9 | 53.9 |
| Dextran T 2000 | 2000 | Pharmacia | 8122 | 109.3 |
The MW is an average value determined by light scattering as given by the manufacturer. Dextran T 2000 was dialyzed and freeze dried before use. Viscosities were measured at 23°C.
Preparation of red cells
Blood was obtained on a voluntary basis from routinely appearing donors in the local blood bank. Blood (3 ml) was aspirated in vacutainers containing 2 units heparin per ml of blood. After withdrawal the blood was washed three times with Hepes buffered salt solution (KNH). KNH contained (mM) 93 KCl, 47 NaCl, and 10 Hepes. The osmolality was measured by freezing point depression (Osmomat, Knauer, Berlin, Germany) and adjusted to 290–300 mOsm. The pH was adjusted to 7.4. After the last centrifugation the red cells were suspended at a volume concentration (hct) of ∼50%. This suspension was stored in the refrigerator until the red cells were used. The experiments were completed within 1.5 h after blood withdrawal.
Preparation of dextran solutions
Hepes stock solution (Hstock) is a solution of Hepes in water. The concentration of Hepes and the pH of Hstock were adjusted in such a way that 2.5 g water plus 0.6722 g Hstock had an osmolality of 300 ± 3 mOsm and pH 7.3. Hepes solution (H) was prepared by adding 0.1 g Hstock to 10 g water. If Hstock is prepared correctly the concentration of Hepes in H is 10 mM. Potassium-sodium stock solution (KNstock) is a solution of KCl and NaCl (molar ratio 2:1) in water. The concentrations were adjusted in such a way that 10 g of H plus 0.9 g KNstock had an osmolality of 300 ± 3 mOsm. Dextran solution (D) was prepared by layering dextran powder on water. When solvation was complete, water was added until the solution had the desired refractive index as measured with an Abbe refractometer (Zeiss, Oberkochen, Germany). The refractive index was chosen to reproduce dextran concentrations because dextran is hygroscopic. This indirect method was calibrated with dextran from a freshly opened can (molecular weight, 60,000, from Serva, Heidelberg, Germany); 15 g% (w/w) corresponded to a refractive index of 1.355. Hepes-buffered dextran solution (HD) was prepared by adding 0.1 g Hstock to 10 g D. Hepes-buffered dextran-salt solution (KNHD) was prepared by adding 0.673 g KNstock to 10 g HD. The reduction in salt concentration compensated for the osmotic effect of dextran. The reduction was found to be independent of the MW of dextran (17). KNHD was then titrated to a pH in which suspended red cells would have the same cytoplasmic pH as red cells suspended in KNH as calculated theoretically (18). Finally 0.8 mg albumin were added per ml KNHD.
Viscometry was performed in a custom-made chamber (Mooney configuration) adapted to a commercial measuring unit (Rheomat 15, Rheometric Scientific, Bensheim, Germany). The outer surface of the chamber is stationary; the inner one is rotated at preselected rates. The chamber is water jacketed for temperature control. The viscosities of the different KNHDs are given in Table 1.
Rheoscopy
The heart of the rheoscope is a transparent cone-plate chamber. Its walls consist of a coverslip as plate at the bottom and a cone machined of plexiglass on top. The chamber is adapted to an inverted microscope equipped with interference contrast optics (Leitz, Wetzlar, Germany, 40×/0.65). About 30 μl of a cell suspension are pipetted on the cone, which is then put in place to form the final cone-plate geometry. The motor driving the chamber is feedback controlled by a homemade power supply unit. Because cone and plate are counterrotating, a fluid layer exists within the chamber that does not rotate during shear flow. Cells suspended in this layer are observed along the gradient of the undisturbed shear flow and videotaped on MiniDV (GV-D900E, Sony, Tokyo, Japan). The camera signal (black/white camera M50, JAI) was fed into a videotimer (VTG-33, ForA, London, UK) that superimposed the time with 0.015 precision onto the microscopic picture. Rheoscopy was done at room temperature (23°C).
Latex spheres (diameter 0.7 μm) were suspended in KNH at a volume concentration of ∼1%. 50 μl cell suspension (hct ≈ 50%) were added to 200 μl of the latex suspension. After thorough mixing 4 μl of this mixture were added to 200 μl of KNHD to form the final suspension, which is then put into the rheoscope. Following this procedure ∼50% of all red cells bore one or more latex spheres attached to the membrane.
Determination of the shear rate
The undisturbed shear rate in the rheoscope is also the mean shear rate in the gap between cone and plate when red cells are present. For simplicity it is referred to as shear rate in the following and denoted by  It was determined by the following formula.
 |
(1) |
The distance of observation from the center of rotation (r) was measured with a dial indicator with a precision of 5 μm. Typical values of r were 1900 μm. The frequency of rotation (ω) of either cone or plate was calibrated using a stop watch by counting revolutions. A vertical light beam deflected 90° by a mirror attached to the cone helped to determine beginning and end of the slow revolutions by a sort of lighthouse effect. All frequencies were determined with a precision better than 0.2%.
The biggest error is introduced by the measurement of the gap thickness between cone and plate. The gap cannot be reproduced exactly after a new suspension is filled into the chamber because the cone has to be removed and put back into place. To overcome this disadvantage the following procedure was followed. After a successful experiment and before removing the cone, the focus of the microscope was moved from the surface of the cone to the surface of the plate and the mechanical stroke (TS, table stroke) was measured with a caliper with a precision of 1 μm. To average out variations due to rotation of the chamber this measurement was repeated three times around the periphery. The averaged values of TS for all fillings of the chamber ranged from 27.25 to 32.0 μm.
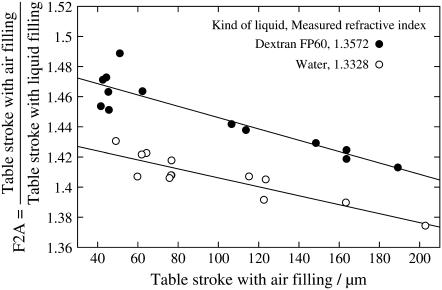
Because the optical path between the microscope lens and the surface of the cone is partly in air and partly in dextran solution TS is smaller than the gap thickness because of refraction. To determine a conversion factor, a special chamber was designed. Basically it was a transparent flow chamber having as bottom the same coverslip that formed the plate of the rheoscope. First TS was measured with air filling of the chamber. In this case TS equals the actual gap thickness since the refractive index on both sides of the coverslip is identical. Then the chamber was filled with water or KNHD and TS was measured again. The ratio of both values was the conversion factor F2A (fluid/air). By using different tops of the flow chamber these measurements were repeated at different values of gap thickness. Fig. 1 shows that F2A increases with refractive index of the liquid as expected. It also shows a small dependence on gap thickness. For the calculation of experimental shear rates F2A = 1.47 was used. Using this factor the gap thickness in the experiments ranged from 40 to 47 μm. This means that in the experiments the distance of the observed red cells to the walls of the cone-plate chamber was at least 20 μm.
FIGURE 1.
The factor that converts the stroke of the microscope table while focusing through the gap versus the actual gap thickness.
During the determination of F2A it turned out important to make the glass coverslip at the bottom of the flow chamber as small as possible because otherwise an inevitable hydrostatic pressure of a few millimeters of water would bend the coverslip and thus increase the gap thickness with respect to the filling with air. A glass window of 6 mm in diameter turned out to be sufficiently small to leave the gap thickness measurably independent of hydrostatic pressures up to 20 mm of water.
Evaluation of red cell data
The evaluation of the video tapes was done using a software that was developed in our institute. First, a video sequence was replayed from videotape, digitized, and stored in the memory of a computer (Indy, SGI, Sunnyvale, CA). A scroll bar allowed very fast display of any frame or field of the stored sequence. In a separate window the pixel coordinates of the actual mouse position was displayed.
Tank-treading appears as a back and forth motion of membrane attached latex spheres parallel to the flow direction. Only full revolutions were evaluated. Begin and end of revolutions was taken when a particular latex sphere was midway between the leading and trailing end of the cell. The time at the begin and end as well as the number of revolutions were typed into a file for later calculation of f.
Despite the low hct used in the experiments it happens that two red cells have a close encounter. Such events were excluded. In addition to the data required for determination of f two cell dimensions were evaluated by positioning the mouse cursor. These cell dimensions were the projected length L′ parallel to the direction of the undisturbed flow and the width B at right angles to it (parallel to the vorticity of the undisturbed shear flow).
To avoid selection within the population all cells in a video sequence that could be evaluated were included in the data. To avoid disproportionate total numbers for different conditions (specified by donor,  and η0) not all sequences (usually three) stored for each condition on tape were evaluated.
RESULTS
Primary red cell data
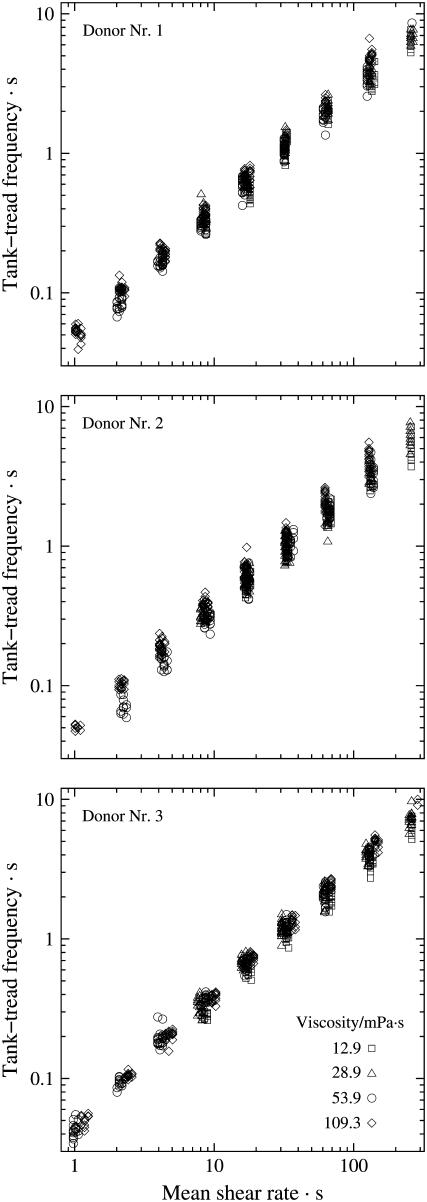
Altogether 1873 cells of three blood donors were evaluated in this study. A logarithmic spacing of shear rates was used in the experiments. In particular, consecutive shear rates were increased approximately by a factor of two. The dependence of f on  is plotted in Fig. 2 for each donor separately. The logarithmic plots show: a), f depends on η0 very little if at all; b), f increases practically linearly with
  in these logarithmic plots. The slope is less than unity indicating a convex curvature in corresponding linear plots. c), The smallest values for f were observed only for the high viscosities. This is due to the increasing threshold shear rate for tank-treading with decreasing η0. d), The unavoidable variation in gap thickness between different fillings of the rheoscope leads to corresponding variations in
  To analyze points a and b more precisely it is necessary to interpolate the data.
FIGURE 2.
Logarithmic plot of the tank-tread frequency of red cells of three blood samples suspended in four dextran-salt solutions of different viscosity versus the mean shear rate in the rheoscope.
Curve fitting
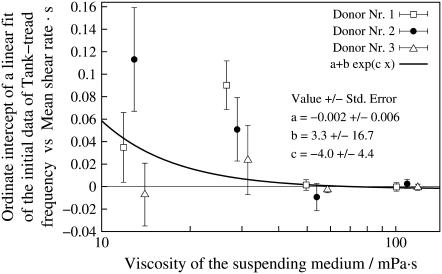
The linear characteristic in Fig. 2 suggests an exponential fit function. It was not obvious whether the experimental data are in keeping with a fit through the origin. To check this point a linear regression of f vs.  was calculated in a first step. Because of the convexity of the curves only the two lowest
  values for each η0 were used in this first step. In Fig. 3 the dependence of the ordinate intercepts of these linear fits on η0 is shown in a semilogarithmic plot. At low viscosities the ordinate intercepts are positive. This is interpreted as being due to the larger threshold shear rates for tank-treading and the convexity of the whole curves. At high viscosities the ordinate intercepts are practically zero. An exponential curve was fitted to the points in Fig. 3. The infinity value (a) of this fit is not significantly different from zero. Consequently a fit function through the origin was used in step two in which the data at all values of
  were used.
FIGURE 3.
Ordinate intercepts of linear regressions of the data in Fig. 2 versus η0. For the regressions only the two lowest shear rates were used at each curve characterized by donor and η0. The data of donor Nr. 1 and 3 (open symbols) are shifted horizontally for clarity. The data were fitted by an exponential function in this semilogarithmic plot.
Instead of fitting an exponential function to the linear data these data were logarithmized and fitted linearly. This corresponds to fitting a straight line to the points in Fig. 2. By this procedure it was avoided that the parameters of the fit function are dominated by the data at high shear rates.
Curvature of the fitted curves
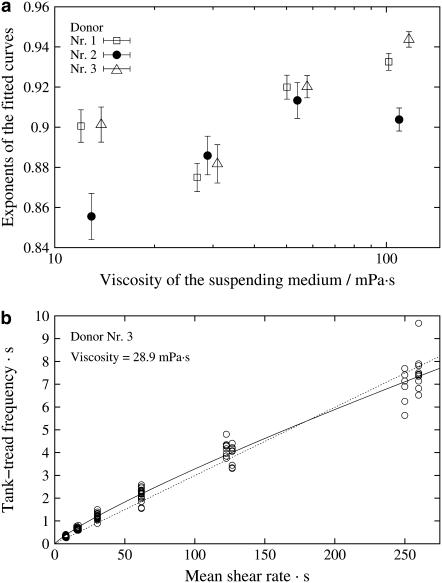
The exponent in an exponential function is a measure of its curvature. An exponent of unity indicates a linear dependence. Fig. 4 shows the exponents of all fits of f vs.  The exponents range between 0.85 and 0.95 indicating convex curvatures. This is in contradiction to earlier findings (13,14,16,19) where frequency data were fitted linearly. To appreciate the curvature in a linear plot an example of original data and the respective fit are shown in Fig. 4 b.
FIGURE 4.
Curvature of the functional behavior of f vs.  (a) Semilogarithmic plot of the exponents of the fit function versus η0. Exponents below unity indicate a convex curvature. The data of donor Nr. 1 and 3 (open symbols) are shifted horizontally for clarity. (b) Example of a curve in a linear plot. (Circles) Experimental data; (solid line) exponential fit function; (dashed line) pragmatic choice of a linear approximation; for details see text.
As to the cause of this conflicting finding, it is speculated that with increasing  the influence of the walls of the cone-plate chamber on the local flow field increases thus rectifying the curves f vs.
  in the earlier works where the gap thickness was ∼20 μm (13,14). In this work the gap was twice as large and the effect is therefore smaller or even not noticeable (see below).
Slope of the fitted curves
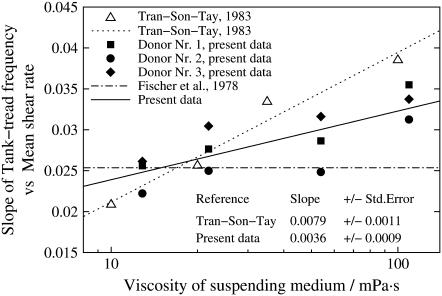
As stated in the Introduction one of the motivations for this study was the conflicting results as to whether  depends on η0 (14) or not (13). Because the fitted curves of this data are curved (Fig. 4) the definition of a slope requires an approximation. As a pragmatic choice the value of
  of the fitted curves at
  180/s was used (dashed line in Fig. 4 b). In Fig. 5 the results of this data are shown together with the previous conflicting data. In this semilogarithmic plot of
  vs. η0 linear regressions of the previous data and these data are shown. It can be seen that the slope of these data is intermediate between the previous conflicting data.
FIGURE 5.
Semilogarithmic plot of  of earlier and present data versus η0 (symbols). Linear regressions through the data (lines).
Morphological parameters of red cells
Tank-treading red cells assume a shape close to a triaxial ellipsoid. The long axis (L) includes an angle of inclination with the undisturbed flow direction (20,21). The intermediate axis (B) is parallel to the vorticity of the undisturbed shear flow. The observation in the rheoscope allows two morphological parameters to be measured: L′ the projection of L onto the flow direction and the width B.
The surface area as well as the volume of red cells show large intra- and interindividual variations (22,23). To obtain, for later use, an individual measure of the surface area from L′ and B, simplifications have been made. In microscopic pictures both the leading and the trailing end of elongated red cells are almost in focus indicating that the angle of inclination is small. Accordingly L is approximated by L′. The thickness of the red cells in the direction of the optical axis cannot be measured from the microscopic pictures. Because it has been estimated to be small compared to L′ and B (20,24) L′B was taken as a proportional measure of the red cell surface area.
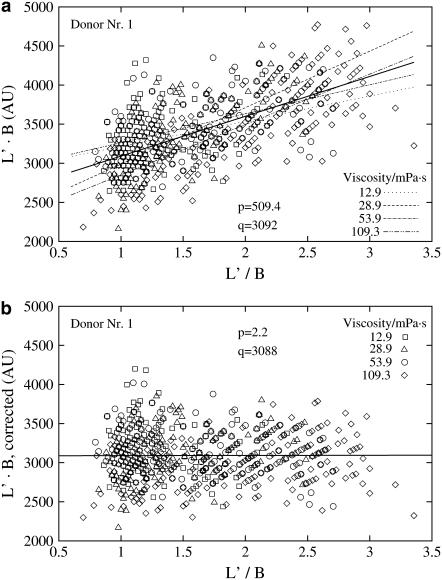
Fig. 6 a shows that L′B shows a wide variation at constant L′/B plus an increase with L′/B. This increase is interpreted as a consequence of the change in cross-sectional shape of the red cells with increasing L′/B; i.e., with increasing elongation. To comply with the fact that the surface area of the red cell is practically constant (1,24) a correction was applied that compensated for the increase but conserved the variation of L′B at constant L′/B (Fig. 6 b). The corrected values of L′B will be used below.
FIGURE 6.
L′B vs. L′/B for donor Nr.1. Broken lines indicate linear regressions for each viscosity. The solid line indicates the regression for all viscosities. The slope (p) of the solid line and its value (q) at L′/B = 1 are indicated. (a) Primary data; (b) after a correction, that compensated for the increase of L′B with L′/B.
An estimate of the individual red cell volume would have been even more approximate than that of surface area because the unknown cross-sectional shape of the deformed red cells enters more strongly. An estimate of red cell volume was therefore not performed.
DISCUSSION
Number of latex spheres per cell
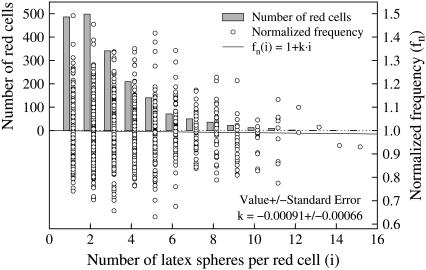
To observe the tank-tread motion of the red cell membrane, marker particles have been attached to it. Fig. 7 shows the frequency distribution of latex spheres per red cell (bars) plotted versus the number of latex spheres on the cell membrane. The majority of the evaluated cells bore one or two latex spheres. With increasing numbers the frequency distribution is rapidly decreasing.
FIGURE 7.
Frequency distribution of the number of latex spheres per red cell (left ordinate, bars); f normalized by the mean value at each condition (donor,  and η0) (right ordinate, circles). Regression of the normalized value of f versus the number of latex spheres (solid line).
A concern was whether the latex spheres would bias the measurement of f. To detect a putative trend the mean value of f at each condition specified by donor,  and η0 was determined. Then each f was normalized by its respective mean value. These normalized values (fn) are shown in Fig. 7 as circles. A regression line starting at unity for zero latex spheres was fitted to these data (solid line). This line has a negative slope indicating a trend toward smaller tank-tread frequencies with increasing numbers of latex spheres.
Despite this trend all data were included in the study. Two arguments are presented for this decision. First, the slope is not significantly different from zero (significance level 95%). Second, fn of the cells with many latex spheres is well within the standard deviation of fn of cells bearing only a few.
Determination of the gap thickness
In all previous rheoscope work the conversion factor F2A was determined according to the formula:
 |
(2) |
where n1 is the refractive index of the cell suspension and n2 the refractive index of the immersion of the microscope lens. In case of a dry objective n2 = nair = 1. For this work F2A = 1.355 would result from Eq. 2. In contrast in separate experiments F2A = 1.47 was found. This is an improvement by almost 10%. It is, however, not clear whether the value determined here can be applied to other microscope optics. Nevertheless it shows that Eq. 2 cannot be used without caution.
Correlation of f and red cell morphological parameters
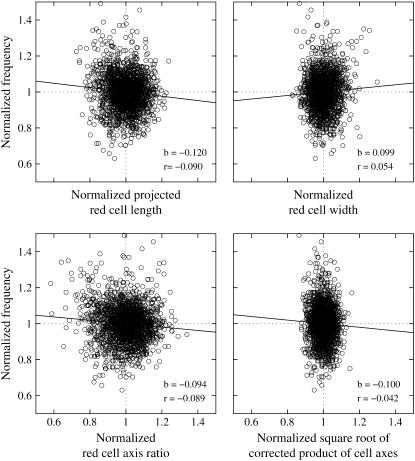
L′ of tank-treading red cells varies appreciably within the population. Because in red cells with short L′ the circumference to be traveled in one tank-tread cycle is shorter than in cells with longer L′ it is conceivable that f in short cells is higher than in the mean of the population. To inspect this conjecture in a cumulative manner for all conditions (specified by donor,  and η0), the values of L′ were normalized by the mean value of the respective condition. Besides L′ this normalization was also performed for the following parameters: B, L′/B as a measure of red cell elongation, and
  as a measure of red cell size. Scatter plots of the normalized values of f versus the normalized values of the four red cell parameters are shown in Fig. 8. A linear regression (solid line) was calculated for the data in each plot and the values of the correlation coefficient (r) and the slope of the regression line (b) are indicated.
FIGURE 8.
Scatter plots of f versus four morphological parameters: L′, B, L′/B, and  The primary data were normalized by the mean value of the respective condition (circles). Linear regressions are shown as solid lines. The values of the correlation coefficients (r) and the slopes of the regression lines (b) are indicated.
Although r ≤ 0.1 in all four cases the null hypothesis, i.e., that no correlation exists, had to be dismissed (t-test, significance level 95%). To inspect this counterintuitive finding more closely the t-test was performed for each condition (specified by donor,  and η0) separately. The results are summarized in Table 2. For at least three-quarters of all 81 conditions the null hypothesis was accepted. Further, in those conditions where the hypothesis was dismissed the correlation coefficient assumed positive as well as negative values. Comparison of the data showed that in only one case (morphological parameter: L′/B,
  1/s, and η0 = 109 mPa s) the correlation was significantly different from zero and the respective correlation coefficients had the same sign in all three donors. This shows that there is no systematic dependence of f on either of the four morphological parameters. The significance assessed above for the normalized values of all data is considered to be artificial and is attributed to the large sample size.
TABLE 2.
Correlation between f and four morphological parameters of tank-treading red cells
| Correlation between f and | L′ | B | L′/B |  |
|---|---|---|---|---|
| Null hypothesis accepted | 64 | 69 | 61 | 76 |
| Null hypothesis dismissed; r > 0 | 5 | 10 | 5 | 2 |
| Null hypothesis dismissed; r < 0 | 12 | 2 | 15 | 3 |
The null hypothesis (no correlation) was tested (t-test, significance level 95%) for the cells (∼25) measured for each condition (specified by donor,  and η0). The numbers indicate in how many of all 81 conditions the hypothesis was accepted or dismissed. The dismissed cases are split up according to the sign of the respective correlation coefficient (r).
The absence of a systematic correlation of f with  i.e., red cell size, indicates that the influence of the walls of the cone-plate chamber on the local flow in the vicinity of tank-treading red cells was negligible.
The absence of a correlation between f with L′, B, or L′/B indicates that a variation of intrinsic and/or extrinsic red cell parameters within the population exists, which has a much stronger influence on f than these morphological parameters. This is even more surprising recalling that the values of f as well as of L′/B decrease with increasing red cell age, or more precisely with red cell density (24,25).
Dependence of f/γ̇ on η0
One of the motivations for this study was the discrepancy as to the dependence of  on η0. Fischer et al. (13) found
  to be independent of η0 in the range of 11–59 mPa s whereas Tran-Son-Tay (14) found a moderate increase in the range of 10–100 mPa s (Fig. 5). In both studies much less red cells were measured to reach the respective conclusion than in this study. Here a dependence was found that was in between the two previous values (Fig. 5).
For spheres rotating in a shear field  This value is independent of η0 and more than twice as high as the values observed for tank-treading red cells. This difference is attributed to the difference in shape when both particles are viewed in the direction of the vorticity of the undisturbed shear flow. In contrast to spheres red cells display a very slender shape. This slender shape is suggested to decrease the tank-tread frequency in two ways with respect to spheres. First, the shear flow is disturbed less because the elongated shape is oriented in a steady-state fashion almost parallel to the direction of the undisturbed flow. Second, the circumference traveled by the tank-treading membrane increases with increasing cell deformation. The observed slight increase of
  with η0 might be explained by a decrease in slenderness with increasing η0, which in turn might be due to an increase in isotropic membrane tension with increasing red cell elongation (26).
Energy dissipation
The energy dissipated per volume of the undisturbed shear flow (ed0) is given by
 |
(3) |
By tank-treading, red cells take place in the overall shear flow and energy is dissipated (20,21,24) in the cytoplasm (EDcyt) as well as in the membrane (EDmem). EDcyt and EDmem have been estimated based on data collected at a single value of η0 (24,27). These data collected at four values of η0 are used in the following to estimate the dependence of EDmem on η0 and  which will then be compared to the respective dependence of ed0.
By geometrical considerations the energy dissipation per surface area of red cell membrane (edmem) due to 2D shear deformations is obtained as follows:
 |
(4) |
where λ is the stretch ratio of a membrane element and ηmem the 2D viscosity of the membrane.
To estimate the energy dissipation in the whole cell the local variations of λ are neglected and replaced by an integral measure. Tank-treading red cells assume a steady-state elongated shape. The ratio of minimal and maximal circumference of this shape is an integral measure of λ. Because both circumferences cannot be measured from the microscopic pictures the ratio of the projected length (L′) to the width (B) is taken as an approximation for the integral measure of λ.
Considering a quarter tank-tread cycle EDmem can then be approximated as follows:
 |
(5) |
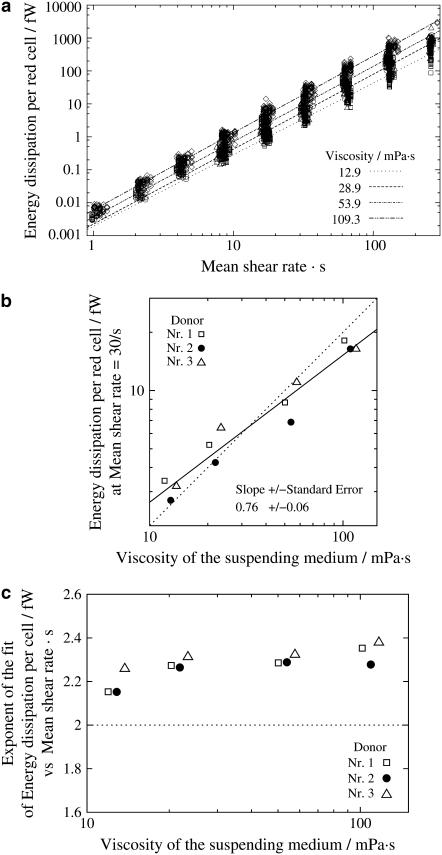
A plot based on this equation using ηmem = 36 × 10−5 mN s/m as determined by micropipette methods (1) is shown in Fig. 9 a. The regression lines for the four different η0 are almost parallel. Their vertical distance corresponds to their ratio of energy dissipation. Representative for the distance of the whole curves the values of energy dissipation at  are plotted versus η0 in Fig. 9 b. A regression line through the data points has a slope of 0.76 indicating that at constant
  the rise of EDmem with η0 is smaller than that in the undisturbed flow in which case the slope is unity.
FIGURE 9.
Energy dissipation in the membrane of tank-treading red cells. (a) Logarithmic plot of the energy dissipation versus  Single cell values (symbols as in Fig. 6); regressions (lines). (b) Logarithmic plot of the ordinate values of the regression lines in Fig. 9 a at
  versus η0. The mean ± SE is about the size of the symbols. The data of donor Nr. 1 and 3 (open symbols) are shifted horizontally for clarity. The data were fitted linearly in this logarithmic plot (solid line). The dotted line with slope = 1 corresponds to the undisturbed flow. (c) Semilogarithmic plot of the slopes of the regression lines in Fig. 9 a versus η0. The mean ± SE is about the size of the symbols. The data of donor Nr. 1 and 3 (open symbols) are shifted horizontally for clarity. The horizontal line (dotted) corresponds to the undisturbed flow.
In the foregoing consideration EDcyt was not included because the red cell volume cannot be estimated reliably from the experimental data. For η0 = 35 mPa s the ratio  has been estimated to range between 0.22 and 0.30 (24). Although this portion may vary with η0 its low value at η0 = 35 mPa s makes it likely that the above finding, i.e., that the rise of EDmem with η0 is lower than that of ed0, applies as well to EDmem + EDcyt.
Besides the dependence on η0 at constant  one can consider the dependence of the energy dissipation on
  at constant η0. In Fig. 9 c the values of the slopes of regression lines as in Fig. 9 a are plotted versus η0. It can be seen that all values are >2, which is the value for the energy dissipation in the undisturbed flow. This behavior is opposite to that at constant η0. However, looking at Eq. 5 and the observed dependence of f and L′/B on
  it is not surprising. Both quantities increase exponentially with
  For f the exponents are shown in Fig. 4. For L′/B an exponent averaged over all data of 0.23 was obtained (not shown).
In the foregoing only trends were compared. An absolute comparison of the energy dissipation in red cells and suspending fluid is not attempted because it requires the knowledge of EDcyt and ηmem. Although estimates for EDcyt exist (24,27), the published values for ηmem differ by an order of magnitude (1,24,27).
Relevance of the data for future model calculations
Fitting theoretical models of tank-treading red cells to the present data may allow one to determine intrinsic mechanical constants of the red cell membrane in a regime that is closer to in vivo flow situations than the regime of deformations that is covered by micropipette methods. Up to now micropipette derived constants were mostly used in theoretical models of blood flow in vivo (2–7).
The absence of a systematic correlation of f with red cell size (see above) indicates that the observed behavior is close to that in an infinite shear field, a situation that is usually modeled.
The absence of a systematic correlation of f with red cell elongation justifies fitting a model with averaged intrinsic and extrinsic red cell parameters.
To evaluate the variation of the elastic and viscous constants within the population would require fitting single cell data. In addition to the experimental data supplied in this work, information on the thickness of the red cell might be necessary for a meaningful fit. The collection of such data is technically feasible.
It is hoped that these data instigate the further development of theoretical models of tank-treading red cells.
Acknowledgments
I thank P. Steffens and S. Mundakapadam for technical help. The software used for evaluation of the videotapes was provided by Dipl. Phys. J. Hektor (Rechenzentrum der RWTH-Aachen).
Editor: Thomas Schmidt.
References
- 1.Waugh, R. E., and R. M. Hochmuth. 1995. Mechanics and deformability of hematocytes. In The Biomedical Engineering Handbook. J. D. Bronzino, editor. CRC, Boca Raton, FL. 474–486.
- 2.Secomb, T. W., and R. Hsu. 1996. Analysis of red blood cell motion through cylindrical micropores: effect of cell properties. Biophys. J. 71:1095–1101. [DOI] [PMC free article] [PubMed] [Google Scholar]
- 3.Secomb, T. W., R. Hsu, and A. R. Pries. 2002. Blood flow and red blood cell deformation in nonuniform capillaries: effects of the endothelial surface layer. Microcirculation. 9:189–196. [DOI] [PubMed] [Google Scholar]
- 4.Pozrikidis, C. 2001. Effect of membrane bending stiffness on the deformation of capsules in simple shear flow. J. Fluid Mech. 440:269–291. [Google Scholar]
- 5.Pozrikidis, C. 2005. Numerical simulation of cell motion in tube flow. Ann. Biomed. Eng. 33:165–178. [DOI] [PubMed] [Google Scholar]
- 6.Lim, G. H. W., M. Wortis, and R. Mukhopadhyay. 2002. Stomatocyte-discocyte-echinocyte sequence of the human red blood cell: evidence for the bilayer-couple hypothesis from membrane mechanics. Proc. Natl. Acad. Sci. USA. 99:16766–16769. [DOI] [PMC free article] [PubMed] [Google Scholar]
- 7.Noguchi, H., and G. Gompper. 2005. Shape transitions of fluid vesicles and red blood cells in capillary flows. Proc. Natl. Acad. Sci. USA. 102:14159–14164. [DOI] [PMC free article] [PubMed] [Google Scholar]
- 8.Brånemark, P.-I., and U. Bagge. 1977. Intravascular rheology of erythrocytes in man. Blood Cells. 3:11–24. [Google Scholar]
- 9.Fischer, T. M. 1978. A comparison of the flow behaviour of disk shaped versus elliptic red blood cells (RBC). Blood Cells. 4:453–461. [Google Scholar]
- 10.Schmid-Schönbein, H., and R. Wells. 1969. Fluid drop-like transition of erythrocytes under shear. Science. 165:288–291. [DOI] [PubMed] [Google Scholar]
- 11.Bagge, U., P.-I. Brånemark, R. Karlsson, and R. Skalak. 1980. Three-dimensional observations of red-blood-cell deformation in capillaries. Blood Cells. 6:231–237. [PubMed] [Google Scholar]
- 12.Gaehtgens, P., and H. Schmid-Schönbein. 1982. Mechanisms of dynamic flow adaptation of mammalian erythrocytes. Naturwissenschaften. 69:294–296. [DOI] [PubMed] [Google Scholar]
- 13.Fischer, T. M., M. Stöhr-Liesen, and H. Schmid-Schönbein. 1978. The red cell as a fluid droplet: tank tread-like motion of the human erythrocyte membrane in shear flow. Science. 202:894–896. [DOI] [PubMed] [Google Scholar]
- 14.Tran-Son-Tay, R. 1983. A study of the tank-treading motion of red blood cells in shear flow. PhD thesis. Washington University, St. Louis, MO.
- 15.Pozrikidis, C. 2003. Numerical simulation of the flow-induced deformation of red blood cells. Ann. Biomed. Eng. 31:1–12. [DOI] [PubMed] [Google Scholar]
- 16.Fischer, T. M., M. Stöhr, and H. Schmid-Schönbein. 1978. Red blood cell (RBC) microrheology: comparison of the behavior of single rbc and liquid droplets in shear flow. AIChE (Am Inst Chem Eng). Symp. Ser. 182:38–45. [Google Scholar]
- 17.Fischer, T. M. 1999. Isovolemic red cells in dextran-salt-solutions: a method to maintain normal red cell volumes in salt solutions containing high concentrations of dextran. Biorheology. 36:127. [Google Scholar]
- 18.Lew, V. L., and R. M. Bookchin. 1986. Volume, pH, and ion-content regulation in human red cells: analysis of transient behaviour with an integrated model. Membr. Biol. 92:57–74. [DOI] [PubMed] [Google Scholar]
- 19.Sutera, S. P., R. Tran-Son-Tay, C. W. Boylan, J. Williamson, and R. Gardner. 1983. A study of variance in measurements of tank-treading frequency in populations of normal human red cells. Blood Cells. 9:485–495. [PubMed] [Google Scholar]
- 20.Fischer, T. M. 1980. On the energy dissipation in a tank-treading human red blood cell. Biophys. J. 61:863–868. [DOI] [PMC free article] [PubMed] [Google Scholar]
- 21.Keller, S. R., and R. Skalak. 1982. Motion of a tank-treading ellipsoidal particle in a shear flow. J. Fluid Mech. 120:27–47. [Google Scholar]
- 22.Canham, P. B., and A. C. Burton. 1968. Distribution of size and shape in populations of normal human red cells. Circ. Res. 22:405–422. [DOI] [PubMed] [Google Scholar]
- 23.Fung, Y. C., W. C. O. Tsang, and P. Patitucci. 1981. High-resolution data on the geometry of red blood cells. Biorheology. 18:369–385. [DOI] [PubMed] [Google Scholar]
- 24.Tran-Son-Tay, R., S. P. Sutera, and P. R. Rao. 1984. Determination of red blood cell membrane viscosity from rheoscopic observations of tank-treading motion. Biophys. J. 46:65–72. [DOI] [PMC free article] [PubMed] [Google Scholar]
- 25.Sutera, S. P., R. Gardner, C. W. Boylan, G. L. Carroll, K. C. Chang, J. S. Marvel, C. Kilo, B. Gonen, and J. Williamson. 1985. Age-related changes in deformability of human erythrocytes. Blood. 65:275–282. [PubMed] [Google Scholar]
- 26.Tran-Son-Tay, R., S. P. Sutera, G. I. Zahalak, and P. R. Rao. 1987. Membrane stress and internal pressure in a red blood cell freely suspended in a shear flow. Biophys. J. 51:915–924. [DOI] [PMC free article] [PubMed] [Google Scholar]
- 27.Sutera, S. P., P. R. Pierre, and G. I. Zahalak. 1989. Deduction of intrinsic mechanical properties of the erythrocyte membrane from observations of tank-treading in the rheoscope. Biorheology. 26:177–197. [DOI] [PubMed] [Google Scholar]


