

Abstract
The membrane peptide pH (low) insertion peptide (pHLIP) lives in three worlds, being soluble in aqueous solution at pH 7.4, binding to the surface of lipid bilayers, and inserting as a transbilayer helix at low pH. With low pH driving the process, pHLIP can translocate cargo molecules attached to its C-terminus via a disulfide and release them in the cytoplasm of a cell. Here we examine a key aspect of the mechanism, showing that pHLIP is monomeric in each of its three major states: soluble in water near neutral pH (state I), bound to the surface of a membrane near neutral pH (state II), and inserted across the membrane as an α-helix at low pH (state III). The peptide does not induce fusion or membrane leakage. The unique properties of pHLIP made it attractive for the biophysical investigation of membrane protein folding in vitro and for the development of a novel class of delivery peptides for the transport of therapeutic and diagnostic agents to acidic tissue sites associated with various pathological processes in vivo.
INTRODUCTION
It has been demonstrated that the initial folding of helical membrane proteins can be separated into two stages: the formation of independently stable helices across the membrane lipid bilayer and, then, the interaction of the helices with each other to form higher order structures (1). For most membrane proteins, additional steps are required for the final equilibration of the native structure (2). Significant progress has been made in understanding protein insertion into membranes, usually catalyzed by the translocon, and the interactions that drive transmembrane helix association (3–6). Transmembrane helices are commonly identified in sequence data as hydrophobic stretches of ∼20 amino acids, so that they are expected to be soluble in the hydrophobic region of a lipid bilayer and insoluble in water. It was an unexpected surprise to find a peptide that is soluble both in water and in a bilayer, and that the spontaneous insertion and folding of a membrane peptide can have significant practical applications.
When we found that the C helix of bacteriorhodopsin can be soluble at high pH but inserted across a membrane at lower pH, we thought that it might be used to transport cargo across membranes (7–8). Subsequently we tested the idea, and found that the peptide pH (low) insertion peptide (pHLIP), based on the C helix, can translocate cargo molecules attached to its C-terminus into cells (9–10). Translocation is selective for low pH, and various types of cargo molecules can be released in the cytoplasm, including organic compounds, cyclic peptides, and peptide nucleic acids. Further, when injected into a mouse, pHLIP accumulates at sites of acidity, such as tumors, and appears nontoxic (11–12).
Because of its interest on fundamental and practical grounds, it is important to understand the mechanistic basis of the peptide insertion. In this work, we ask whether the peptide can function as a monomer, or whether its unusual properties arise from a cooperative series of self-interaction events. In earlier work, we found that insertion into lipid bilayers, human red blood cells, and cancer cells occurs as a result of protonation of Asp residues located in the transmembrane part of the peptide due to a decrease of pH (7,11). Protonation induces an increase of peptide hydrophobicity and triggers insertion of pHLIP into a membrane or bilayer. Here we present the results of the detailed biophysical characterization of pHLIP in solution, in the absence and presence of liposomes. The data show that pHLIP can act as a monomer, so its simple insertion mechanism is likely to be well suited to thermodynamic and kinetic studies of membrane protein folding in vitro, as well as for the development of drug delivery and imaging agents.
METHODS
Synthesis of peptides
We have used the following variants of pHLIP sequences:
pHLIP-1: GGEQNPIYWARYADWLFTTPLLLLDLALLVDADEGT,
pHLIP-2: AAEQNPIYWARYADWLFTTPLLLLDLALLVDADEGTCG,
pHLIP-3: ACEQNPIYWARYADWLFTTPLLLLDLALLVDADEGTG.
All peptides were prepared by solid-phase peptide synthesis using standard 9-fluorenylmethyloxycarbonyl chemistry and purified by reverse phase chromatography (on a C18 column) at the W.M. Keck Foundation Biotechnology Resource Laboratory at Yale University. In a typical preparation of the soluble form of the peptide, the lyophilized powder was dissolved in a solution containing 6 M urea and was transferred to working buffer by using a G-10 size-exclusion spin column. The concentration of the peptide was determined by absorbance (ɛ280 = 13,940 M−1 cm−1).
Conjugation of peptides with fluorescent dyes
Several fluorescent dyes were used in our studies. 4-Chloro-7-nitrobenz-2-oxa-1,3-diazole (NBD-Cl; Invitrogen, Carlsbad, CA) or 5-carboxytetramethylrhodamine, succinimidyl ester (TAMRA; Invitrogen) were conjugated with the α-amino group of the N-terminus of pHLIP-1. N,n′-dimethyl-n-(iodoacetyl)-n′-(7-nitrobenz-2-oxa-1,3-diazol-4-yl)ethylenediamine (IANBD; Invitrogen), and Cy3 or Cy5 maleimide (both dyes were from GE Healthcare, Waukesha, WI) were conjugated with the SH group of the Cys residue of pHLIP-2 or pHLIP-3. The conjugated peptides were purified on a G-10 size-exclusion column. The concentration of labeled peptide was determined by absorbance (NBD-Cl, ɛ336 = 9800 M−1 cm−1; TAMRA, ɛ555 = 65,000 M−1 cm−1; IANBD, ɛ478 = 25,000 M−1 cm−1; Cy3, ɛ549 = 150,000 M−1 cm−1; and Cy5, ɛ646 = 250,000 M−1 cm−1). In each case, the labeling ratio was determined and the concentration of dye never exceeded the concentration of peptide. In the majority of cases the labeled peptide was checked by surface-enhanced laser desorption/ionization time-of-flight.
Liposome preparation
Large unilamellar vesicles were prepared by extrusion. 1-Palmitoyl-2-oleoyl-sn-glycero-3-phosphocholine (POPC; Avanti Polar Lipids, Alabaster, AL) in chloroform was desolvated on a rotary evaporator and dried under high vacuum for several hours. The phospholipid film was rehydrated in 10 mM phosphate buffer, pH 8.0, vortexed for 2 h, and passed through the extruder (100 nm membrane) 15 times. The fluorescent lipids (fluorescent dyes were conjugated to the headgroups) for fusion experiments were prepared by mixing of 1 mol % of 1,2-dioleoyl-sn-glycero-3-phosphoethanolamine-n-(7-nitro-2-1,3-benzoxadiazol-4-yl) (Avanti Polar Lipids) or 1 mol % of 1,2-dioleoyl-sn-glycero-3-phosphoethanolamine-n-(lissamine rhodamine B sulfonyl) (Avanti Polar Lipids) with PC lipids. Large unilamellar vesicles were prepared by extrusion. The concentration of the fluorescent lipids was determined by absorbance of fluorescent dyes. The concentration of the nonfluorescent lipids was calculated by measuring of scattered light (excitation and emission at 700 nm and a vertical orientation of the excitation and emission polarizers) on a PC1 spectrofluorometer (ISS, Champaign, ILL). The scattering signal of the liposomes consisting of nonfluorescent lipids were compared with the signal of a known concentration of liposomes containing 1% phospholipids with fluorescently labeled headgroups (phosphatidylethanolamine lissamine rhodamine B) prepared by exactly the same method described above.
To prepare liposomes with 8-aminonaphthalene-1,3,6-trisulfonic acid, disodium salt (ANTS; Invitrogen) and p-xylene-bis-pyridinium bromide (DPX; Invitrogen) inside them, the phospholipid film was rehydrated in 10 mM phosphate buffer, pH 8.0 containing 12.5 mM ANTS, 45 mM DPX, and 20 mM NaCl. Untrapped ANTS and DPX were removed from the solution on a G-25 size-exclusion column and vesicles were transferred into 100 mM NaCl, 10 mM phosphate buffer, pH 8.0. The vesicles were used immediately after preparation. After two days at 4°C they became leaky and so they were freshly prepared as needed.
Fluorescence and circular dichroism measurements
Tryptophan fluorescence and circular dichroism (CD) measurements were carried out on SLM or PC1, ISS spectrofluorometers and a Jasco 810 spectropolarimeter, respectively (Jasco, Tokyo, Japan) with regulated temperature control units. After the first experiments to establish the self-association concentration dependence in aqueous solution, the concentration of peptides used in the study was kept at <30 μg/mL (or ∼7 μM). Tryptophan fluorescence spectra were recorded at excitation wavelengths of both 280 and 295 nm. For decomposition analysis, we used 295 nm to limit excitation to the tryptophan fluorophores in the peptide. Fluorescence spectra were recorded from 300 nm to 450 nm with the spectral widths of excitation and emission slits set at 2–4 nm and 2 nm, respectively. The polarizers in the excitation and emission paths were set at the magic angle (54.7° from the vertical orientation) and vertically (0°), respectively, to reduce Wood's anomalies from the reflecting holographic grating. The emission spectrum of an aqueous solution of l-tryptophan was used as a standard for the correction of protein spectra for the instrument spectral sensitivity.
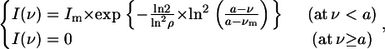
Decomposition of tryptophan fluorescence spectra
For the decomposition analysis, tryptophan fluorescence spectra of pHLIP were obtained using excitation at 295 nm in the absence and presence of POPC vesicles at pH 8.0 and 4.0 and in the presence of increasing concentrations of external quencher. We used acrylamide at concentrations of 0, 0.019, 0.038, 0.074, 0.109, 0.142, and 0.206 M as external quenchers of tryptophan fluorescence. The intensities in fluorescence spectra were corrected for the screening inner filter effect of this quencher at the excitation wavelength of 295 nm. The temperature was kept constant at 25°C. Decomposition of the tryptophan fluorescence spectra at different quencher concentrations was performed according to Burstein et al. (13). First, the fluorescence spectra were converted to the frequency scale from the wavelength scale, Fν = Fλ × λ2. Then, the shape of each spectral component of a protein fluorescence spectrum on the frequency (wavenumber) scale was approximated by a uniparametric log-normal function,
 |
(1) |
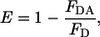
where Im is the maximal intensity; ν is the current wavenumber; νm is the spectral maximum position; ν− and ν+ are the positions at half-maximal amplitudes; ρ is the band asymmetry parameter,  ); and a is the function limiting point position,
  Therewith, νm, ν+, and ν− are related as (14)
 |
(2) |
The intensities for the components (Im) were calculated from the set of linear equations. The shapes and positions of spectral components remain unchanged with fluorescence quenching by water-soluble quenchers, and the changes in the intensities of individual components with quenching were found to obey the Stern-Volmer law. The decomposition was performed using the simple-fitting-using-mean-square method as a criterion and phase-plot-based-resolution-using-quenchers algorithms. The spectra were independently fitted by one, two, or three components. The typical experimental noise of fluorescence spectra, which is ∼0.5–1.5%, does not permit a sufficiently reliable decomposition for more than three spectral components. The criterion of attaining the best solution (a sufficient number of components) was the minimization of root-mean-square differences (residuals) between theoretical and experimental spectra. For each ith component, the program output data contained the value of the spectral maximum position (Lmax), the percent contribution of the component to the area of the total spectrum (F) and the relative values of the Stern-Volmer constants presented in percent (100% corresponds to the value of the Stern-Volmer constant for free tryptophan emission in aqueous solution quenched by acrylamide, which was taken as 16.8 M−1). The Stern-Volmer constants KSV(i) were calculated as the slopes of linear plots of (Ao/Ac − 1) versus quencher concentration, where Ao and Ac are the areas under the emission component spectra measured, respectively, in the absence (Ao) and in the presence of quencher at concentration c (Ac).
Multiangle laser light scattering size-exclusion chromatography
Size-exclusion chromatography coupled with on-line laser light scattering, ultraviolet, and refractive index detection (SEC-LS/UV/RI) was used for the determination of pHLIP mass in solution. Size-exclusion chromatography was performed on a Superdex 75 column (Pharmacia, Peapack, NJ) in 10 mM phosphate buffer pH 8.0 containing 100 mM NaCl. The elution profiles were monitored by UV absorption at 280 nm, light scattering at 690 nm, and differential refractometry. Light scattering and differential refractometry were carried out using the Mini-Dawn and Optilab instruments (Wyatt Technology, Santa Barbara, CA). Analysis was carried out as described by Astra (Astra Software, St. Petersburg, Russia). All data collection and analysis were performed in the W.M. Keck Foundation Biotechnology Resource Laboratory at Yale by Dr. Folta-Stogniew.
Sedimentation velocity
Sedimentation velocity experiments were conducted using a Beckman analytical ultracentrifuge (Fullerton, CA) at 25°C in 100 mM NaCl, 10 mM phosphate buffer, pH 8.0 using absorbance optics at 280 nm wavelength to visualize the peptide. The sample and buffer volumes were 450 μL. The peptide concentration was 30 μg/mL in phosphate buffer, pH 8.0. The data were analyzed using two different programs, SEDFIT and SVEDBERG. The SEDFIT program provides the distribution of sedimentation coefficients of noninteracting species, then fitting each distribution with a Gaussian function. The SVEDBERG program was used to fit the data by using one, two, and three components. The two-component solution was in very good agreement with the data obtained by SEDFIT analysis.
Detection of peptide topology
Dithionite (Na2S2O4) chemically quenches the fluorescence of IANBD, and since the ion does not readily traverse a bilayer, it was used to probe the topological locations of labels. IANBD groups were conjugated with the SH groups of Cys residues located on the N- or C-terminus of pHLIP. A 2 μM of labeled peptide was incubated with POPC liposomes (200 lipids per pHLIP) at neutral pH for 1 h, and then insertion was triggered by reducing the pH to 4.0. Changes in the fluorescence signal of IANBD were monitored at 550 nm (excited at 478 nm) upon addition of 12 mM of dithionite in phosphate buffer pH 5.0 (final concentration in cuvette = 1–2 mM). At the end of the experiment, vesicles were disrupted by Triton-100 to allow access of dithionite to all IANBD groups. As controls, dithionite (in phosphate buffer pH 8.0) was added to each peptide labeled on the N- or C-terminus in the absence and presence of POPC liposomes at pH 8.0, and immediate quenching of IANBD fluorescence was observed. Fresh dithionite solution was prepared for each experiment.
Membrane leakage
The POPC liposomes were loaded with the fluorescent dye ANTS and its quencher, DPX. Upon the disruption of liposomes, both molecules come out and dilution induces a decrease of the quenching of ANTS fluorescence by DPX, so the increase in fluorescence signal reports any process of liposome destabilization. The fluorescence was recorded at 495 nm with excitation at 350 nm. The temperature was kept at 25°C. First, the emission signal was recorded for POPC containing ANTS and DPX in phosphate buffer pH 8.0, then peptide was added followed by a drop of the pH to 5.0–4.0 by addition of HCl, and at the end of the experiment vesicles were disrupted by detergent. After each step the changes of fluorescence signal was monitored during 10–20 min. The experiment was performed over a wide range of peptide/lipid molar ratios: 0.001, 0.002, 0.004, 0.02, and 0.1 at a maximum peptide concentration of 10 μM. Only freshly prepared liposomes loaded with ANTS and DPX were used in the experiments.
Fusion assay
The fusion assay is based on energy transfer from NDB to rhodamine. POPC liposomes containing 1 mol % of NDB or rhodamine were prepared. The fluorescence was excited at 450 nm and emission was recorded from 480 to 620 nm. Vesicles containing NBD and rhodamine fluorophores were mixed with nonfluorescent POPC in the absence (as a control) and presence of pHLIP and the changes in fluorescence signal at 593 nm were recorded immediately, 1, 3, and 20 h later. Then, fusion was initiated by several freeze-thaw cycles after 20 h. Significant energy transfer from NDB to rhodamine occurred only after freeze-thaw cycles. The experiment was performed at two peptide/lipid molar ratios—0.004 and 0.008. The results in both cases were similar.
Oligomerization (Förster resonance energy transfer assay)
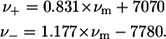
Oligomerization was monitored by Förster resonance energy transfer (FRET) using two donor-acceptor pairs: NDB-TAMRA and Cy3-Cy5. Donor and acceptor dyes were each conjugated to the N-terminal regions of pHLIP peptides. NDB and TAMRA fluorescent dyes were attached to the α-amino group of the N-terminus, while Cy3 and Cy5 were conjugated with the SH group of Cys included at the N-terminus of the peptide. The labeling ratio was determined by absorption at 280 nm and at the absorption wavelengths of the dyes (see section above). Several samples were prepared with increasing concentration of acceptor (from 0 to 1.2 μM). In all samples the total concentration of peptide was kept constant (<30 μg/mL) by the addition of nonlabeled peptide. In all samples the total concentration of lipids was kept constant and all measurements were carried out at peptide/lipid ratios of 0.013 and 0.0033. In the case of NDB-TAMRA, the samples were excited at 450 nm and emission was recorded over the 480–630 nm spectral range. In the case of Cy3-Cy5, the samples were excited at 500 nm and emission was recorded over the 540–800 nm spectral range. All measurements were performed in phosphate buffer at pH 8.0 or pH 4.0 at constant temperature (25°C). The efficiency of energy transfer (E) was measured by the decrease of donor fluorescence according to the standard equation
 |
where FD and FDA are the fluorescence intensity of the donor in the absence and presence of acceptor, respectively. Experimentally measured efficiency of energy transfer was compared with theoretically predicted values calculated from the Wolber-Hudson equation (15). Both donor-acceptor pairs have similar Förster distances, ∼55 Å.
RESULTS
The pHLIP peptide exhibits three characteristic states: state I, soluble in water near neutral pH; state II, bound to the surface of a membrane near neutral pH; and state III, inserted across the membrane as an α-helix at acidic pH (Fig. 1) (7,11). The major goal of our study is to establish the oligomeric state and conformation of the peptide in each of these states. We first studied pHLIP in solution at pH 8.0 in the absence of liposomes. Size-exclusion chromatography coupled with on-line laser light scattering, ultraviolet, and refractive index detection (SEC-LS/UV/RI) was used to probe the peptide behavior in solution. Table 1 and Fig. 2, a and b, present the data for various concentrations of pHLIP. Over a wide range of concentrations from 36 to 170 μg/mL pHLIP eluted in the form of a tetramer (16.4 ± 0.7 kDa). The molecular mass of pHLIP used in the experiment was 4.1 kDa. However, we noticed that the amount of peptide after the column was always much less than expected, and we suspected that low-molecular-mass species might exist, but they might interact with column, since the peptide sequence contains many hydrophobic residues.
FIGURE 1.

The three major states of pHLIP at concentration of < 30 μg/mL are illustrated: soluble in water at pH > 7 (State I), bound to the surface of a lipid bilayer at the same pH and at a lipid/peptide molar ratio > 100 (State II), and inserted across the bilayer as an α-helix at low pH (State III).
TABLE 1.
pHLIP in solution studied by size exclusion chromatography coupled with on-line laser light scattering, ultraviolet and refractive index detection; a predominant peak corresponding to a pHLIP tetramer was observed in each case
| Concentration in the injected sample (μg/ml) | Concentration at maximum (μg/ml) | Peak elution at UV trace (ml) | Molecular mass (kDa) averaged for the entire peak | Molecular mass (kDa) average from maximum |
|---|---|---|---|---|
| 700 | 169 | 10.81 | 16.7 | 16.8 |
| 560 | 62 | 10.83 | 17.1 | 17.1 |
| 420 | 48 | 10.82 | 16.0 | 15.9 |
| 280 | 36 | 10.83 | 15.9 | 15.7 |
FIGURE 2.

pHLIP mass in solution at pH 8.0 studied by size-exclusion chromatography coupled with on-line laser light scattering, ultraviolet, and refractive index detection. (a) The UV and RI signals of the major fraction from the column. (b) The results of SEC-LS/UV/RI analysis revealed that the major fraction from the column contained tetrameric pHLIP. Normalized fluorescence (c) and CD (d) spectra of various concentrations of pHLIP measured in 10 mM phosphate buffer, pH 8.0. The emission spectra were measured at an excitation wavelength of 295 nm. The spectral maximum shifts from 341 to 348 upon dilution. At high peptide concentration, the CD spectra have a characteristic exciton pattern (minimum at 232 nm), which disappears at low concentration where the peptide adopts a random configuration. (e) The pHLIP concentration dependence in solution of the fluorescence maximum (red point and line) and the 232:126 nm ratio of the CD signal (black point and line). (f) The distribution of sedimentation coefficients (black line) obtained by analysis of sedimentation velocity runs obtained for 30 μg/mL of pHLIP in 10 mM phosphate buffer, 100 mM NaCl, pH 8.0 using the SEDFIT program. The distribution was fitted by Gaussian functions and two components were revealed (the theoretical line is red, the components are green and blue). One predominant component was found, corresponding to a peptide molecular mass of 3.84 kDa (molecular mass of the peptide is 4.1 kDa). Similar results were obtained by applying the SVEDBERG program (see text).
We then applied spectroscopic approaches: fluorescence and circular dichroism (CD) spectroscopy to reveal oligomeric states of pHLIP in solution. Measurements of the tryptophan fluorescence (pHLIP has two tryptophan residues) and CD signals were performed over a wide range of concentrations (Fig. 2, c and d). Interestingly, we observed the CD spectrum characteristic of an exciton, with a minimum at 232 nm (16,17). Such an exciton could be formed as the result of the stacking of aromatic amino acids due to peptide aggregation. Further, the position of the tryptophan fluorescence maximum was 341 nm, reporting tryptophan residues partially buried in the protein interior (18). Dilution of pHLIP led to the disappearance of the CD exciton peak and a shift of the tryptophan emission maximum to 348 nm, which reflects the complete exposure of tryptophan residues to water (19). The data indicate that the pHLIP tetramer dissociates with decreasing concentration, and the dissociation curves obtained from the CD and fluorescence measurements are very similar (Fig. 2 e). At concentrations <30–35 μg/mL, the dissociation is completed.
What is the oligomeric state of pHLIP in solution at concentrations <30–35 μg/ml? We applied the method of decomposing the tryptophan fluorescence spectra into log-normal spectral components, which can be assigned to individual tryptophan residues (13,18). The decomposition method is based on use of additional information, which allows our reducing the complexity of the system and finding a stable solution. Particularly, the spectrum of an elementary spectral component on the frequency scale is described by a four-parametric log-normal function. The special experimental study of dependence between position of maximum and width of fluorescence spectra allowed us to reduce the number of unknown parameters from 4 to 2 (14). The use of an asymmetric log-normal function for the fitting of spectral signals has proved to be very successful in assessing the contributions of multiple tryptophans (20,21). The stability of solution is also enhanced by including the analysis set of fluorescence spectra measured at various concentrations of external quenchers of tryptophan fluorescence (the shape and position of spectral components should be unchanged during quenching, while the intensity is changed according to the Stern-Volmer law). The method of decomposing protein fluorescence into spectral components has been effectively applied to reveal heterogeneity in the spectral properties of tryptophan fluorophores arising from heterogeneity in the environments of tryptophan residues in proteins (22–24). Recently, additional supportive evidence of the accuracy of the decomposition algorithms was obtained through the analysis of the correlation of the experimental spectra of single-tryptophan-containing mutants of multi-tryptophan proteins OEP16 (22) and ECP (24).
The decomposition analysis was applied to pHLIP using a series of tryptophan fluorescence spectra measured at various concentrations of acrylamide as an external quencher. The positions of spectral maxima, their contributions to the total intensity, and the relative values of the Stern-Volmer constants obtained as a result of decomposition analysis of a series of tryptophan fluorescence spectra of 30 μg/mL of pHLIP in phosphate buffer, pH 8.0 are presented in Table 2. One-hundred percent corresponds to the value of the Stern-Volmer constant for free tryptophan emission in aqueous solution quenched by acrylamide, which was taken as 16.8 M−1. Two spectral components were identified. The short-wavelength component makes a small contribution (9.5 ± 3.7%) in total intensity. However, the second component, which exhibits emission at 349.1 nm with 81.8% accessibility to acrylamide, corresponds to the tryptophan residues fully exposed to solvent.
TABLE 2.
Decomposition of pHLIP tryptophan fluorescence spectra in the absence and presence of POPC liposomes at pH values 8.0 and 4.0
| Lmax, nm | F, % | Ksv, % | |
|---|---|---|---|
| pHLIP, pH8.0 | 325.0 ± 1.2 | 9.5 ± 3.7 | 18.1 ± 7.8 |
| 349.1 ± 0.5 | 90.5 ± 3.7 | 81.8 ± 0.8 | |
| pHLIP + POPC, pH8.0 | 326.4 ± 1.1 | 39.4 ± 3.0 | 16.1 ± 1.7 |
| 347.4 ± 1.5 | 60.6 ± 3.0 | 80.1 ± 5.1 | |
| pHLIP + POPC, pH4.0 | 321.8 ± 4.2 | 21.6 ± 1.0 | 9.9 ± 1.7 |
| 339.1 ± 4.6 | 78.4 ± 1.8 | 20.4 ± 1.9 |
The table contains the parameters of log-normal spectral components: the position of each spectral maximum (Lmax, nm), the total intensity contribution of each component (F, %), and the relative Stern-Volmer constant (Ksv, %, where 100% corresponds to the value of the Stern-Volmer constant for free tryptophan emission quenched by acrylamide in aqueous solution, which was taken as 16.8 M−1).
The fluorescence data indicate that tryptophan residues are accessible to water molecules; however, we cannot exclude the possibility of the formation of low-order oligomers in which the tryptophan residues are completely exposed to water. Therefore, we used analytical ultracentrifugation to perform sedimentation velocity runs with 30 μg/mL of pHLIP in phosphate buffer, pH 8.0. Analysis of the distribution of sedimentation coefficients using the SEDFIT program gave two components (Fig. 2 f). The fitting of the distribution of sedimentation coefficients by Gaussian functions gave a predominant component (94%) with a sedimentation coefficient of 0.73 ± 0.14 and a molecular mass of 3.84 ± 1.02 kDa. The second component made a small contribution (6%), and corresponded to the pHLIP tetramer (18.6 ± 13.0 kDa). The data were also analyzed by using the SVEDBERG program. The data were fitted using the modified Fujita-MacCosham function. The result of fitting shows a predominant component with sedimentation coefficient equal to 0.79 (95% confidence interval equals 0.79–0.80) and corresponding to a molecular mass of 3.98 kDa (95% confidence interval, 3.86–4.36 kDa) and the RMS of fitting was 1.4 × 10⁻². Both methods give very similar results: the existence of one predominant species with a molecular mass of 3.8–4.0 kDa that matches the molecular mass of monomeric pHLIP (4.05 kDa). Thus, all our data indicate that pHLIP is a monomer (at least 94% of the peptide) in solution at pH 8.0 and a concentration of <30 μg/ml.
To understand the mechanistic and practical aspects of pHLIP, it is important to establish the range of concentrations where pHLIP exists in a monomeric form in solution. Our previous studies showed that, at pH 7.4–8.0, the peptide interacts with a lipid bilayer and does not exhibit any elements of secondary structure; it binds weakly to the surface without insertion. A decrease of pH induces insertion of pHLIP and the formation of a stable transmembrane α-helix. Attachment and insertion can be monitored by changes of CD and fluorescence signals (Fig. 3, a and b). The process of insertion is fully reversible, increasing the pH leads to loss of helical structure and release of pHLIP from the membrane. At pH < 5.0, pHLIP has a tendency to aggregate (short wavelength shift of maximum position of tryptophan spectrum) with the formation of partial helical structure. The behavior of pHLIP at 25°C and 37°C was identical, except for a decreased amount of helicity for pHLIP in solution at low pH at elevated temperature versus lower temperature (data not shown).
FIGURE 3.

Tryptophan fluorescence (a) and CD (b) spectra of 30 μg/mL pHLIP in 10 mM phosphate buffer in the absence and presence of POPC liposomes at various pHs. The fluorescence and CD spectra of pHLIP at pH 8.0 (black solid line) indicate a random configuration with tryptophan residues fully exposed to solvent. However, at low pH (pH 3.5) (black dotted line) the peptide tends to aggregate, leading to a shift of position of the fluorescence maximum and the appearance of some elements of secondary structure. Incubation of pHLIP with the POPC liposomes at pH 8.0 (blue solid line) induces the burial of tryptophan residues inside the lipid bilayer without helix formation. Decreasing the pH to 4.0 by the addition of HCl (red solid line) induces the insertion of pHLIP and the formation of helix. When POPC vesicles were added to the pHLIP at pH 3.5 there was an increase of fluorescence, a shift of the spectrum to short wavelengths, and an enhancement of helicity (red dotted line). The insertion of pHLIP across the lipid bilayer is a reversible process; an increase of pH leads to a loss of helicity and the release of the peptide from the membrane (green solid line). (c) The ability of pHLIP to induce vesicle fusion was tested on a mixture of two populations of vesicles with NDB and rhodamine fluorescently-labeled lipids. The graph presents the changes of rhodamine fluorescent signal during incubation of labeled vesicles in the presence of pHLIP at pH 8.0 and 4.0. The values were normalized to the rhodamine fluorescence (at 593 nm, excited at 450 nm) recorded after mixing of NDB-labeled liposomes with rhodamine-labeled liposomes in the absence of pHLIP. A significant increase of emission signal was observed only after several freeze-thaw cycles, which led to the fusion of vesicles. (d) An atomic representation of pHLIP taken from the crystal structure 1C3W (the C helix of bacteriorhodopsin) was generated by RasWin Molecular Graphics 2.6. The green are tryptophan residues. (e) The topology of pHLIP in a lipid bilayer was determined using the IANBD-dithionite quenching reaction. The fluorescence signal of IANBD attached to an SH group at the N-terminus (IANBD-pHLIP) or C-terminus (pHLIP-IANBD) of the peptide was monitored at 550 nm (excited at 478 nm). The starting point is a signal of IANBD-pHLIP and pHLIP-IANDB incubated with POPC followed by lowering the pH to 4.0. Then, dithionite was added. In case of IANBD conjugated to the C-terminus no change of signal is observed (black line), while the fluorescence of IANBD conjugated to the N-terminus of peptide is completely quenched (red line). The data indicate that the N-terminus of pHLIP stays outside, but that the C-terminus of pHLIP goes inside of the vesicles. (f) The pHLIP oligomeric state in a lipid bilayer was studied by FRET. The N-terminus of pHLIP was conjugated either with NDB or TAMRA. Fluorescence spectra of NDB were measured in the presence of an increasing concentration of TAMRA-pHLIP while keeping the total peptide and lipid concentration constant. (g) The comparison of calculated efficiency of energy transfer for NDB-TAMRA (blue points) and Cy3-Cy5 (red points) pairs with the theoretically predicted efficiency of energy transfer (black line) calculated from the Wolber-Hudson equation for noninteracting molecules.
To examine whether fusion or leakage of liposomes is promoted or induced by pHLIP, we used standard Förster resonance energy transfer (FRET) assays. Fluorescently-labeled lipids were used to prepare two populations of vesicles containing NBD or rhodamine fluorophores. NBD and rhodamine form a good donor-acceptor pair, and any fusion of liposomes would induce mixing of lipids and enhance energy transfer from NBD to rhodamine (25). The liposomes were mixed in the absence (as a control) and presence of 25 μg/mL of pHLIP at pH 8.0 and 4.0, at peptide/lipid ratios of 0.004 and 0.008. The rhodamine fluorescence was measured to monitor a possible fusion immediately after mixing, 1, 3, and 20 h later (Fig. 3 c). We observed no significant fluorescence increase of rhodamine in the presence of peptide. As a secondary control experiment, we subjected the same vesicles to multiple freeze-thaw cycles to induce liposome fusion. In that case we observed a significant increase of rhodamine fluorescence due to energy transfer from NBD. We concluded that pHLIP does not induce fusion at either normal or low pH in the studied concentration range.
To probe the ability of pHLIP to induce leakage of liposomes we used a standard ANTS-DPX fluorescence assay. The assay is based on the ability of DPX to quench the fluorescence from ANTS when both are trapped inside vesicles. Disruption of liposomes leads to the release of molecules and enhancement of fluorescence signal of ANTS (26). The leakage experiments were performed for a range of peptide: lipid ratios of 0.001, 0.002, 0.004, 0.02, and 0.1 at a maximal peptide concentration of 10 μM. We observed no leakage of liposomes in presence of pHLIP at normal and low pH for various peptide/lipid ratios until the vesicles were disrupted by detergent. Only at a 1:10 peptide/lipid ratio, a very high concentration of peptide relative to lipids, was a gradual leakage observed at pH 8.0.
We next examined pHLIP on the surface of and inserted into lipid bilayers. We used the decomposition analysis (see above) of pHLIP in the presence of liposomes at pH 8.0 and 4.0 (Table 2). At pH 8.0, when pHLIP is attached to a lipid bilayer surface, we detected two components of the tryptophan fluorescence spectra measured at various concentrations of acrylamide. The long-wavelength component corresponds to a tryptophan residue exposed to water molecules, while the short-wavelength component indicates that one of the tryptophan residues is buried in the hydrophobic environment. A two-component solution was also found for pHLIP inserted across the lipid bilayer at pH 4.0; however, both components were shifted to short wavelengths with reduced accessibility of tryptophan to acrylamide. At low pH, the first and second components are consistent with one tryptophan residue buried deeply in the lipid bilayer and a second located at the interface between aqueous environment and lipid headgroups. These results correlate well with the position of the C helix in the crystal structure of bacteriorhodopsin, which show that one tryptophan of the C helix is located practically in the middle of the hydrophobic core of the membrane, while the other tryptophan is at the level of the headgroups. The quantum yield of the emission of the short-wavelength component might be reduced by contact of the indole ring atoms of tryptophan with the OH group of Tyr and side-chain nitrogen atoms of Arg (Fig. 2 d), which are known to be good quenchers of tryptophan emission (27).
One of the simplest methods to detect oligomerization of peptides is to study the dependence of the fluorescence maximum of a tryptophan residue located in the hydrophobic core on lipid concentration, since increasing the concentration of lipids should lead to a blue shift of tryptophan emission due to a dissociation of any peptide oligomers (28). We did not observe any changes in the position or shape of the fluorescence spectra of pHLIP over a wide range of POPC concentrations. However, these experiments cannot rule out completely the possibility of oligomers.
To further test for oligomers, we used FRET. Since energy transfer results even from random colocalization of donor and acceptors in a lipid bilayer, we needed to compare the experimental data of energy transfer with that theoretically predicted for the selected donor-acceptor pairs. To calculate the values of energy transfer we need to know the topology of pHLIP insertion into the lipid bilayer. In our previous work we used the membrane-impermeable dithionite ion ( ), which can chemically modify the NBD fluorophore and quench its fluorescence (29), to examine the position of peptide N-terminus labeled with NBD (9). The results indicated that the N-terminus stays outside while the C-terminus of the peptide is translocated across the bilayer. Further, cargo molecules attached to the C-terminus were successfully translocated by pHLIP into the cytoplasm, which is consistent with the topology experiments. However, there is the possibility that conjugation of the peptide C-terminus with dye might prevent insertion of this-terminus across the membrane. Since proper topology of insertion is essential for the FRET experiments we repeated the experiments with IANBD that is an analog of NBD designed for conjugation with Cys residues. IANBD was conjugated with a Cys residue placed on the N- or C-termini of the pHLIP. The peptides labeled with IANBD were incubated with POPC liposomes and the pH was dropped to pH 4.0 to induce peptide insertion. Addition of dithionite ion did not lead to the quenching of IANBD fluorescence in case of the C-terminus labeling (Fig. 3 e), while the fluorescence of dye conjugated with the N-terminus of pHLIP was completely quenched by addition of dithionite. As a control experiment, dithionite was used to quench emission of IANBD conjugated with the N- and C-termini of pHLIP in the absence and presence of POPC at pH 8.0 (when the peptide is not inserted), and we observed immediate quenching of the IANBD fluorescence after addition of dithionite. Thus, pHLIP labeling with IANBD does not prevent peptide insertion across the bilayer: insertion is unidirectional; the C-terminus of pHLIP goes through the lipid bilayer, while the N-terminus stays outside.
For FRET experiments we used a NBD-rhodamine (TAMRA) donor-acceptor pair with a nominal Förster distance (R0) of 55 Å. These dyes have been successfully used to probe oligomerization of other peptides in membranes (30). NBD and TAMRA were attached to the α-amino group of the N-terminus of pHLIP (there are no Lys residues in pHLIP). Several samples were prepared separately, with various concentrations of acceptor and a fixed concentration of donor. Peptide/lipid ratios were 0.013 and 0.0033, and unlabeled pHLIP was added to each sample to keep the total peptide concentration constant. After incubation of labeled and unlabeled pHLIP with the liposomes, the pH was dropped to 4.0 and fluorescence measurements were performed. The efficiency of energy transfer was monitored by the decrease in the fluorescence signal of the donor, NBD (Fig. 3 f). The measured efficiency of energy transfer as a function of acceptor concentration (Fig. 3 g) coincides with the theoretical values calculated from the Wolber-Hudson equation (15), indicating an absence of oligomers. We repeated the experiments with the Cy3-Cy5 donor-acceptor pair to exclude the possibility of donor self-quenching. It is known that self-quenching is minimal for the Cy3 dye (31). Using the Cy3-Cy5 pair, we observed nothing more than random colocalization of dyes in the lipid bilayer, implying an absence of oligomerization of the inserted pHLIP (Fig. 3 g).
We also performed FRET experiments with both donor-acceptor pairs described above at pH 8.0, when the peptide is attached to the surface of the membrane, and obtained the same behavior of energy transfer efficiency (data not shown). We conclude that dyes conjugated with the N-terminus of pHLIP are >60–80 Å from each other when pHLIP interacts with the membrane at pH 8.
DISCUSSION
The folding of membrane proteins is facilitated by complex molecular machines in vivo, including the translocon that places most transmembrane helices across the bilayer (32,33). The study of the insertion of helices in vitro is a problem that has been vexed by the insolubility of the helices in water and their strong aggregation tendencies. Attempts have been made to design synthetic peptides that are soluble in aqueous solution, and that spontaneously insert into the membrane (34). Peptides capable of spontaneous insertion into lipid bilayers are attracting attention because of the recent finding that moderately polar transmembrane domains with sequences of up to 85 residues can posttranslationally translocate themselves into membranes in a translocon-defective yeast strain, in contrast to more hydrophobic sequences that cannot (35,36). Also, spontaneous insertion could open an opportunity to translocate cargo molecules through the cell membrane into the cytoplasm (9), or to interact with membrane proteins to influence their activities. pHLIP is an example of a peptide that has three major states: soluble in water (state I), bound to the surface of a membrane (state II), and inserted across the membrane as an α-helix (state III) (see Fig. 1). Based on the studies reported here, we now know that the peptide is monomeric in all three states, establishing that a class of molecules exists with the properties needed for membrane folding and insertion studies in vitro.
We applied a variety of biophysical techniques to study the three states of the peptide. We found that, in solution, pHLIP exists as a monomer at concentrations <30 μg/mL (∼7.3 μM) or less. All further experiments were performed at concentrations of pHLIP < 30 μg/mL. Before investigating the oligomeric state of pHLIP in the presence of lipid vesicles, we confirmed that the peptide does not induce vesicle fusion or leakage at the experimental pH values. Various fluorescence methods were applied, and it was found that the peptide is a monomer inserted across a lipid bilayer and in its surface interaction mode. The results obtained are in a very good agreement with the experiments carried out on HeLa and human red blood cells, where an absence of cell toxicity and leakage was found in the presence of pHLIP (9–11). These and other data (see (9)) ruled out the possibility of pore formation as a mechanism of molecular translocation through the membrane by pHLIP.
pHLIP possesses properties that are well suited for the thermodynamic and kinetic investigation of insertion and folding of membrane peptides, since the peptide is soluble in aqueous solution and monomeric in all three major states. pHLIP constitutes the first example of the use of the insertion and folding of a monomeric membrane peptide to translocate cargo molecules through the lipid bilayer of a cell membrane. Thus, fundamental studies of membrane protein folding have led to potentially important practical applications. We demonstrated in vivo that pHLIP can target acidic solid tumors and inflammatory arthritis with high accuracy (11) and translocate through the lipid bilayer and release cargo molecules in the cytoplasms of cells with an elevated level of extracellular acidity (9). All experiments with cargo molecule translocation into live cells by pHLIP were performed at peptide concentrations of 0.5–2.0 μM, which is much lower than the 7–8 μM limit for remaining monomeric. A concentration range of 0.5–4 μM to target sites of disease also is also realistic for in vivo experiments. Therefore, the findings presented in this article have significance both for fundamental and applied studies. We believe that pHLIP opens the opportunity to reveal the major physical principles of membrane protein folding using a simple model system and also enables the design of a new class of agents for targeting therapeutic and diagnostic agents to tissues with low extracellular pH, such as those associated with a variety of pathological processes.
Acknowledgments
We thank Erin E. Matthews, Department of Molecular Biophysics and Biochemistry, Yale University for her skillful guidance in the analytical ultracentrifugation experiments and data analysis. We also thank Dr. Ewa Folta-Stogniew, Howard Hughes Medical Institute Biopolymer Facility and W.M. Keck Foundation Biotechnology Resource Laboratory, Yale University for MALLS measurements and data analysis; Janet Crawford, W.M. Keck Foundation Biotechnology Resource Laboratory, Yale University for peptide synthesis and purification; and Dr. Aftab Ahmed for assistance in the use of instruments in research at the IDeA Network of Biomedical Research Excellence core facility at the University of Rhode Island.
This work was supported in part by grants from the National Institutes of Health (No. GM073857 and GM070895) to D.M.E. and from the Department of Defense (No. PCRP CDMRP PC050351) to Y.K.R., and from a University of Rhode Island Undergraduate Research grant to M.S. We thank the IDeA Network of Biomedical Research Excellence core facility at the University of Rhode Island (RI-INBRE grant No. P20RR016457 from the National Center for Research Resources, a component of the National Institutes of Health) for use of the circular dichroism spectrometer.
Editor: David D. Thomas.
References
- 1.Popot, J.-L., and D. M. Engelman. 2000. Helical membrane protein folding, stability, and evolution. Annu. Rev. Biochem. 69:881–922. [DOI] [PubMed] [Google Scholar]
- 2.Engelman, D. M., Y. Chen, C. N. Chin, A. R. Curran, A. M. Dixon, A. D. Dupuy, A. S. Lee, U. Lehnert, E. E. Matthews, Y. K. Reshetnyak, A. Senes, and J. L. Popot. 2003. Membrane protein folding: beyond the two-stage model. FEBS Lett. 555:122–125. [DOI] [PubMed] [Google Scholar]
- 3.Lehnert, U., Y. Xia, T. E. Royce, C. S. Goh, Y. Liu, A. Senes, H. Yu, Z. L. Zhang, D. M. Engelman, and M. Gerstein. 2004. Computational analysis of membrane proteins: genomic occurrence, structure prediction and helix interactions. Q. Rev. Biophys. 37:121–146. [DOI] [PubMed] [Google Scholar]
- 4.Curran, A. R., and D. M. Engelman. 2003. Sequence motifs, polar interactions and conformational changes in helical membrane proteins. Curr. Opin. Struct. Biol. 13:412–417. [DOI] [PubMed] [Google Scholar]
- 5.Van den Berg, B., W. M. Jr. Clemons, I. Collinson, Y. Modis, E. Hartmann, S. C. Harrison, and T. A. Rapoport. 2004. X-ray structure of a protein-conducting channel. Nature. 427:36–44. [DOI] [PubMed] [Google Scholar]
- 6.White, S. H., and G. von Heijne. 2005. Transmembrane helices before, during, and after insertion. Curr. Opin. Struct. Biol. 15:378–386. [DOI] [PubMed] [Google Scholar]
- 7.Hunt, J. F., P. Rath, K. J. Rothschild, and D. M. Engelman. 1997. Spontaneous, pH-dependent membrane insertion of a transbilayer α-helix. Biochemistry. 36:15177–15179. [DOI] [PubMed] [Google Scholar]
- 8.Engelman, D. M., and J. F. Hunt. 1998. US Patent 5,739,273.
- 9.Reshetnyak, Y. K., O. A. Andreev, U. Lehnert, and D. M. Engelman. 2006. Translocation of molecules into cells by pH-dependent insertion of a transmembrane helix. Proc. Natl. Acad. Sci. USA. 103:6460–6465. [DOI] [PMC free article] [PubMed] [Google Scholar]
- 10.Andreev, O. A., S. Sandugu, D. M. Engelman, and Y. K. Reshetnyak. 2006. Injection of Molecules into cells using a pH-triggered molecular nanosyringe. Technical Proceedings of the 2006 Nanotech Conference. 2:57–60.
- 11.Andreev, O. A., A. D. Dupuy, M. Segala, S. Sandugu, D. A. Serra, C. O. Chichester, D. M. Engelman, and Y. K. Reshetnyak. 2007. Mechanism and uses of a peptide that targets tumors and other acidic tissues in vivo. Proc. Natl. Acad. Sci. USA. 104:7893–7898. [DOI] [PMC free article] [PubMed] [Google Scholar]
- 12.Vavere, A. L., O. A. Andreev, D. M. Engelman, Y. K. Reshetnyak, and J. S. Lewis. 2007. 64Cu Labeling and PET imaging of tumors in a small animal using a pH-dependent insertion of peptide 64Cu-DOTA-pHLIP. 17th International Symposium on Radiopharmaceutical Sciences, Aachen, Germany.
- 13.Burstein, E. A., S. M. Abornev, and Y. K. Reshetnyak. 2001. Decomposition of protein tryptophan fluorescence spectra into log-normal components: I. Algorithm of decomposition. Biophys. J. 81:1699–1709. [DOI] [PMC free article] [PubMed] [Google Scholar]
- 14.Burstein, E. A., and V. I. Emelyanenko. 1996. Log-normal description of fluorescence spectra of organic fluorophores. Photochem. Photobiol. 64:316–320. [Google Scholar]
- 15.Wolber, P. K., and B. S. Hudson. 1979. An analytic solution to the Förster energy transfer problem in two dimensions. Biophys. J. 28:197–210. [DOI] [PMC free article] [PubMed] [Google Scholar]
- 16.Tuzi, A., M. R. Ciajolo, G. Guarino, P. A. Temussi, A. Fissi, and O. Pieroni. 1993. Solid state and solution structure of Boc-L-Ala-δ Phe-δ Phe-NHMe: a dihydropeptide showing propensity for 310-helices of both screw senses. Biopolymers. 33:1111–1121. [DOI] [PubMed] [Google Scholar]
- 17.Roy, R. S., H. N. Gopi, S. Raghothama, R. D. Gilardi, I. L. Karle, and P. Balaram. 2005. Peptide hairpins with strand segments containing α- and β-amino acid residues: cross-strand aromatic interactions of facing Phe residues. Biopolymers. 80:787–799. [DOI] [PMC free article] [PubMed] [Google Scholar]
- 18.Reshetnyak, Y. K., and E. A. Burstein. 2001. Decomposition of protein tryptophan fluorescence spectra into log-normal components: II. The statistical proof of discreteness of tryptophan classes in proteins. Biophys. J. 81:1710–1734. [DOI] [PMC free article] [PubMed] [Google Scholar]
- 19.Reshetnyak, Y. K., Y. Koshevnik, and E. A. Burstein. 2001. Decomposition of protein tryptophan fluorescence spectra into log-normal components: III. Correlation between fluorescence and microenvironment parameters of individual tryptophan residues. Biophys. J. 81:1735–1758. [DOI] [PMC free article] [PubMed] [Google Scholar]
- 20.Metzler, C. M., A. E. Cahill, S. Petty, D. E. Metzler, and L. Lang. 1985. The widespread applicability of log-normal curves for the description of absorption spectra. Appl. Spectrosc. 39:333–339. [Google Scholar]
- 21.Djikanovic, D., A. Kalauzi, M. Jeremic, M. Micic, and K. Radotic. 2006. Deconvolution of fluorescence spectra: contribution to the structural analysis of complex molecules. Colloids Surf. B Biointerfaces. 54:188–192. [DOI] [PubMed] [Google Scholar]
- 22.Linke, D., J. Frank, M. S. Pope, J. Soll, I. Ilkavets, P. Fromme, E. A. Burstein, Y. K. Reshetnyak, and V. I. Emelyanenko. 2004. Folding kinetics and structure of OEP16. Biophys. J. 86:1479–1487. [DOI] [PMC free article] [PubMed] [Google Scholar]
- 23.Reshetnyak, Y. K., R. P. Kitson, M. Lu, and R. H. Goldfarb. 2004. Conformational and enzymatic changes of 20S proteasome of rat natural killer cells induced by mono and divalent cations. J. Struct. Biol. 145:263–271. [DOI] [PubMed] [Google Scholar]
- 24.Torrent, M., E. Cuyás, E. Carreras, S. Navarro, O. López, A. de la Maza, M. V. Nogués, Y. K. Reshetnyak, and E. Boix. 2007. Topology studies on the membrane interaction mechanism of the eosinophil cationic protein. Biochemistry. 46:720–733. [DOI] [PubMed] [Google Scholar]
- 25.Struck, D. L., D. Hoekstra, and R. E. Pagano. 1981. Use of resonance energy transfer to monitor membrane fusion. Biochemistry. 20:4093–4099. [DOI] [PubMed] [Google Scholar]
- 26.Ellens, H., J. Bentz, and F. C. Szoka. 1985. H+- and Ca2+-induced fusion and destabilization of liposomes. Biochemistry. 24:3099–3106. [DOI] [PubMed] [Google Scholar]
- 27.Chen, Yu., and M. D. Barkley. 1998. Toward understanding tryptophan fluorescence in proteins. Biochemistry. 37:9976–9982. [DOI] [PubMed] [Google Scholar]
- 28.Lew, S., G. A. Caputo, and E. London. 2003. The effect of interactions involving ionizable residues flanking membrane-inserted hydrophobic helices upon helix-helix interaction. Biochemistry. 42:10833–10842. [DOI] [PubMed] [Google Scholar]
- 29.McIntyre, J. C., and R. G. Sleight. 1991. Fluorescence assay for phospholipid membrane asymmetry. Biochemistry. 30:11819–11827. [DOI] [PubMed] [Google Scholar]
- 30.Yano, Y., T. Takemoto, S. Kobayashi, H. Yasui, H. Sakurai, W. Ohashi, M. Niwa, S. Futaki, Y. Sugiura, and K. Matsuzaki. 2002. Topological stability and self-association of a completely hydrophobic model transmembrane helix in lipid bilayers. Biochemistry. 41:3073–3080. [DOI] [PubMed] [Google Scholar]
- 31.You, M., E. Li, W. C. Wimley, and K. Hristova. 2005. Forster resonance energy transfer in liposomes: measurements of transmembrane helix dimerization in the native bilayer environment. Anal. Biochem. 340:154–164. [DOI] [PMC free article] [PubMed] [Google Scholar]
- 32.Van den Berg, B., W. M. Jr, I. Clemons, Y. Collinson, E. Modis, S. C. Hartmann, S. C. Harrison, and T. A. Rapoport. 2004. X-ray structure of a protein-conducting channel. Nature. 427:36–44. [DOI] [PubMed] [Google Scholar]
- 33.Osborne, A. R., T. A. Rapoport, and B. van den Berg. 2005. Protein translocation by the Sec61/SecY channel. Annu. Rev. Cell Dev. Biol. 21:529–550. [DOI] [PubMed] [Google Scholar]
- 34.Wimley, W. C., and S. H. White. 2000. Designing transmembrane α-helices that insert spontaneously. Biochemistry. 39:4432–4442. [DOI] [PubMed] [Google Scholar]
- 35.Brambillasca, S. M., P. Yabal, S. Soffientini, S. Stefanovic, M. Makarow, R. S. Hegde, and N. Borgese. 2005. Transmembrane topogenesis of a tail-anchored protein is modulated by membrane lipid composition. EMBO J. 24:2533–2542. [DOI] [PMC free article] [PubMed] [Google Scholar]
- 36.Brambillasca, S. M., M. Yabal, M. Makarow, and N. Borgese. 2006. Unassisted translocation of large polypeptide domains across phospholipid bilayers. J. Cell Biol. 175:767–777. [DOI] [PMC free article] [PubMed] [Google Scholar]