Abstract
For some sets of surfaces, the spatial ratios of cone-photoreceptor excitations produced by light reflected from pairs of surfaces are almost invariant under illuminant changes. These sets include large populations of spectral reflectances, some of which represent individual natural surfaces but not their relative abundances in nature. The aim of this study was to determine whether spatial cone-excitation ratios are preserved under illuminant changes within the natural visual environment. A fast hyperspectral imaging system was used to obtain populations of 640,000 reflectance spectra from each of 30 natural scenes. The statistics of spatial cone-excitation ratios for randomly selected pairs of points in these scenes were determined for two extreme daylights. Almost-invariant ratios were common, suggesting that they represent a reliable property of the natural visual environment and a suitable foundation for visual color constancy.
1. INTRODUCTION
In a scene comprising several illuminated surfaces, the spectral distribution of light as a function of position in the image presented to the eye defines the color signal.1 When the illuminant on the scene changes, so in general does the color signal. There is, however, a property of the color signal that remains almost invariant under changes in illuminant, at least for certain classes of reflecting surfaces and illuminants. This property is the spatial ratio of cone-photoreceptor excitations, defined for any cone class, produced by light reflected from any pair of surfaces in the scene.2
Before being established empirically, this invariance of cone-excitation ratios was often assumed in explanations of the constancy of perceived surface color under changes in illuminant (“visual color constancy”).3-6 More recently, it has been argued to underlie the constancy of perceived color relations under illuminant changes (“relational color constancy”)2,7-9 and the spatially parallel detection of violations in color constancy.10
The extent of the invariance of spatial cone-excitation ratios has been estimated from computational simulations.2 In these simulations, reflecting surfaces were sampled randomly and uniformly from the Munsell Book of Color11 and from surfaces with random reflectance spectra. Illuminants were sampled randomly from different phases of daylight and from Planckian radiators. Although the set of spectral reflectances spanned by the spectral basis functions generally used to reproduce the Munsell set12 includes the spectral reflectances of flowers, flower clusters, leaves, and berries (see e.g., Ref. 13), it is not clear how well the results of these computational simulations provide a true representation of the invariance or otherwise of spatial cone-excitation ratios in natural scenes. In practice, there are two factors to consider: (1) the types of reflectance spectra encountered in natural scenes and (2) the spatial distribution and relative abundance of these spectra within natural scenes. Data relating to (1) have already been reported,14-22 but there are only limited data available relating to (2).23,24
In the present study, a fast hyperspectral imaging system was used to obtain populations of reflectance spectra from sets of rural and urban scenes. From these data, the statistical properties of spatial cone-excitation ratios under changes in daylight were determined. It was found that the mean deviation in cone-excitation ratios under daylight changes was approximately 4% in both sets of scenes, a level much lower than that obtained by sampling Munsell surfaces.
2. METHODS
A. Apparatus
A hyperspectral25 imaging system with an electronic, continuously tunable filter was used to obtain images with high spectral resolution (see, e.g., Ref. 26 for a review of the general technique). Hyperspectral images were acquired with a progressive-scanning monochrome digital camera (Pulnix TM-1010, Pulnix America Inc., Sunnyvale, Calif.) with a CCD array of 1024 × 1024 pixels and 10-bit output (for fast transfer of the data to the computer, only the central portion of each image, corresponding to 800 × 800 pixels, was captured). The camera had an electronic shutter with a timer controlled by an external signal. The lens was an f/1.8, 12.5–75 mm typically operating at 75 mm and producing an angular resolution of ∼1 arc min per pixel. A tunable birefringent filter (VariSpec, model VS-VIS2-10HC-35-SQ, Cambridge Research and Instrumentation, Inc., Boston, Mass.) was mounted in front of the lens. The wavelength of peak transmission could be varied over the range 400–720 nm, with a full width at half-maximum transmission of 10 nm at 550 nm, decreasing to 6 nm at 400 nm and increasing to 16 nm at 720 nm. Out-of-band transmission was less than 0.01%. The filter had a 35-mm aperture and a field of view of ±7 deg. The images were captured with a frame grabber with a digital input board (Matrox Corona/8/E, Matrox Electronic Systems Ltd., Quebec, Canada). The frame grabber also provided the external signal needed to control the electronic shutter of the camera. Individual control and synchronization of the frame grabber, tunable filter, and camera were accomplished by inhouse software running on the host computer.
B. Hyperspectral Image Acquisition and Processing
For each scene, two hyperspectral sequences of signal images were obtained, namely, a sequence of raw “scene” images and a sequence of “light-reference” images, along with two corresponding sequences of noise images. Scene images were obtained by pointing the camera at the scene under study, adjusting the focus and zoom, and recording the sequence; light-reference images were obtained with the same optical arrangement but with the camera pointing at a flat, uniformly reflecting, uniformly lit surface that was interposed between the scene and the camera; noise images were obtained in the same way but with the camera entrance aperture blocked. The wavelength range of 400–720 nm was sampled at 10-nm intervals; each of the four image sequences for each scene therefore consisted of 33 images. The data for the spectral extremes of this range (400 and 720 nm) were subsequently discarded because of low signal-to-noise ratios there.
For each scene, exposure time at each wavelength was determined by an automatic routine that was executed before image acquisition, so that the maximum output at any pixel was within 86–90% of the CCD saturation value. Each complete sequence of 33 spectral images took between 5 and 15 s to acquire, depending on the light levels on the scene. Particular care was taken to avoid recording scenes containing movement.
To correct for the effects of noise, the noise images were subtracted at each wavelength from their corresponding scene and light-reference images. To correct for the effects of transmission through the optical system (mainly off-axis vignetting by the tunable filter), the noise-corrected scene image was divided at each wavelength by the noise-corrected light-reference image.
Spectral-reflectance functions for each pixel element were then estimated by normalizing this corrected signal at each pixel against that obtained with a white standard derived from a small gray object with a flat reflectance spectrum placed within the scene. Initially, the illumination was assumed to be spatially uniform in all scenes, the effect of shadows to be considered later.
Cone excitations were calculated from the Smith-Pokorny27,28 set of fundamentals for two illuminants corresponding to the phases of natural daylight with correlated color temperatures of 25,000 and 4300 K, which are representative of natural illumination at noon and evening, respectively.29 Their spectral power distributions were generated from three basis functions taken from a principal components analysis30 of 622 samples of skylight and sunlight-with-skylight. This device for generating the two daylight spectra has no theoretical implication here.
C. Accuracy in Estimating Reflectance Functions
In addition to the factors already identified as influencing the accuracy of the hyperspectral imaging system, there may be other potential sources of uncertainty. The overall performance of the system used here was therefore assessed by acquiring and processing images from a test scene comprising an array of 15 colored surfaces and then comparing the derived reflectances with those obtained with a telespectroradiometer (SpectraColorimeter, PR-650, Photo Research Inc., Chatsworth, Calif.), whose calibration was traceable to the National Physical Laboratory. The test surfaces were flat uniform colored papers mounted on a dark background illuminated by sunlight from a clear sky at noon.
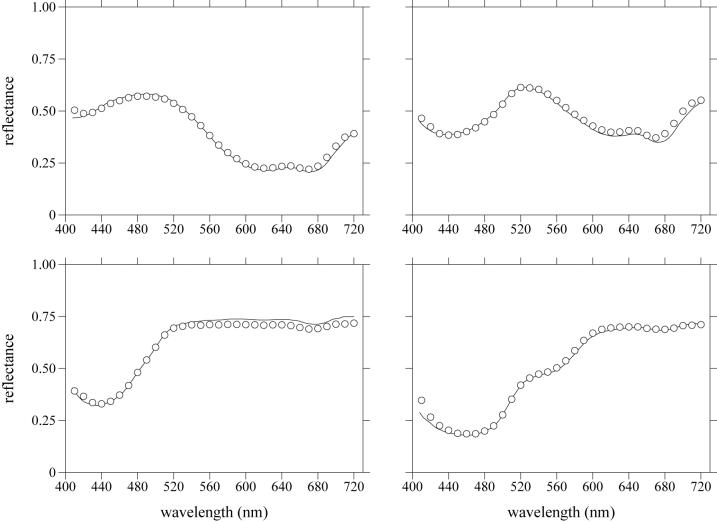
Figure 1 shows data from the two spectral-reflectance determinations for a representative 4 of the 15 colored surfaces; symbols show data for the hyperspectral system and continuous lines for the telespectroradiometer. The root mean square error in the hyperspectral estimates of reflectance across the set of test surfaces was 0.0025. Although some small systematic distortions were present in some regions of the spectrum, the overall accuracy of the system was sufficient for the present calculations.
Fig. 1.
Comparison of reflectance spectra estimated by hyperspectral imaging (symbols) and by telespectroradiometry (continuous lines). Data shown for a representative 4 of 15 colored surfaces used in a test scene.
D. Scenes
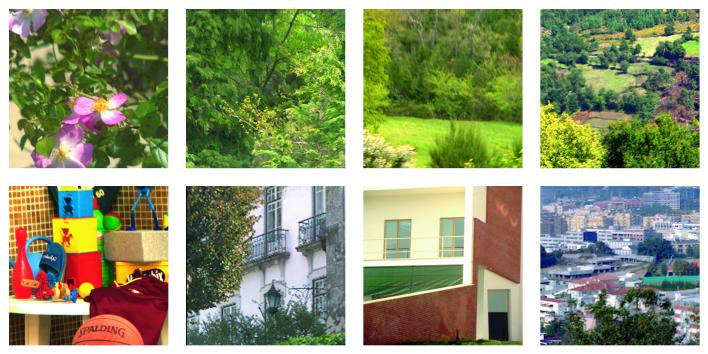
Images of 30 scenes were obtained: 15 rural scenes in the Minho region of Portugal, each containing, rocks, trees, leaves, grass, and earth; and 15 urban scenes, from the cities of Porto and Braga, Portugal. All images were acquired during the summers of 1999 and 2000 under daylight at between mid-morning and mid-afternoon. Scenes were illuminated by direct sunlight in clear or almost-clear sky; if clouds were present, special care was taken to avoid variations in illumination during image acquisition. Figure 2 shows a representative sample from the sets of images used.
Fig. 2.
Samples of rural and urban scenes used in this study.
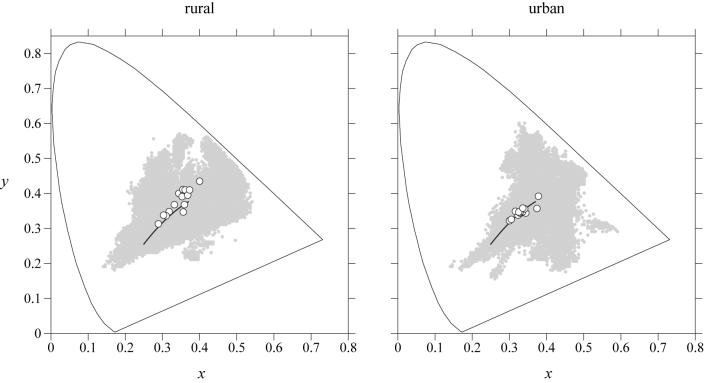
Figure 3 shows in the CIE 1931 (x, y) chromaticity diagram the distributions of chromaticities of surfaces from the complete sets of rural and urban scenes (overlapping gray symbols) under CIE standard illuminant D65. The distributions for rural scenes are similar to those reported in other studies of natural scenes15,23,31 and natural surfaces.21 The distributions for urban scenes are, however, different, almost certainly a consequence of the presence of manufactured materials and objects. The mean chromaticity coordinates of each of the scenes (overlapping open symbols) fall on or near the daylight locus (continuous lines). Rather than being attributable to the illuminant, this bias seems to be an intrinsic property of the scenes. These distributions are, as expected, more constrained than the distribution of Munsell chromaticities, which are spread extensively over the chromaticity diagram.
Fig. 3.
Distributions in the CIE 1931 (x, y) chromaticity diagram of chromaticities (gray symbols) of populations of surfaces from sets of rural and urban scenes under CIE standard illuminant D65. Open symbols show mean chromaticity coordinates for each scene, and continuous lines show the daylight locus.
3. RESULTS
A. Cone Excitations
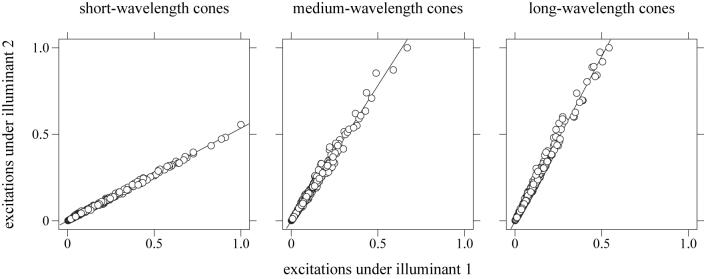
Excitations for short-, medium-, and long-wavelength-sensitive cones were calculated for all scenes under each of the two daylight illuminants used. Figure 4 shows data based on random samples of 100 pixels from each of the 15 rural scenes (i.e., 1500 samples in all). Each point in the graphs represents a pair of excitations for a single pixel: the value on the x axis is for a daylight with correlated color temperature 25,000 K and the value on the y axis for a daylight with correlated color temperature 4300 K. Ranges were normalized to unity for each cone class. Data for the 15 urban scenes were closely similar.
Fig. 4.
Cone excitations for a set of rural scenes. Each point in the graphs represents a pair of excitations for a single pixel: The value on the x axis is for a daylight of correlated color temperature 25,000 K, and the value on the y axis is for a daylight of correlated color temperature 4300 K. The data in each graph were based on 100 samples drawn at random from each of 15 rural scenes. Ranges were normalized to unity for each cone class. The straight lines are unconstrained regression lines. Data for a set of urban scenes were closely similar.
The distributions of projected data values along the x and y axes reveal for each cone class a relatively wide range of excitations. As expected,32,33 the two values produced by the two illuminants varied proportionally across the range of surfaces, as shown by the close distributions of points about their regression lines.
B. Spatial Ratios of Cone Excitations
The degree of invariance of the spatial ratios of cone excitations was quantified in the following way. Let r1 be the (nonzero) ratio of cone excitations in a particular cone class due to light with correlated color temperature 25,000 K being reflected from two points in the scene represented by a particular pair of pixels. Let r2 be the corresponding ratio for light with correlated color temperature 4300 K. The relative deviation is defined by the quotient |r1 − r2| /min{r1, r2}.34
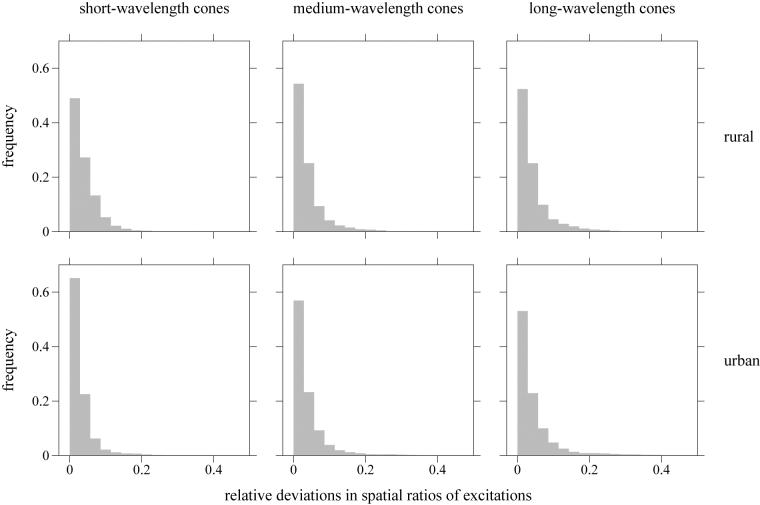
Relative deviations for the sets of rural and urban scenes were calculated separately. In the analysis, 1000 pairs of pixels were sampled randomly from each population of 640,000 pixels from each of the 15 scenes in each set (i.e., 15,000 pairs of pixels from rural scenes and 15,000 pairs of pixels from urban scenes) and the relative deviation calculated for each pair. The histograms in Fig. 5 show the frequencies of occurrence of relative deviations in spatial ratios of excitations for short-, medium-, and long-wavelength-sensitive cones for the two sets of scenes. Table 1 shows the mean relative deviations in spatial ratios of excitations within each cone class for these scenes and for the Munsell set for comparison. Data for images indicated as having been cropped to eliminate shadows are considered later in the text.
Fig. 5.
Frequencies of occurrence of relative deviations in spatial ratios of cone excitations under changes in illuminant for short-, medium-, and long-wavelength-sensitive cones, based on 15,000 pairs of surfaces drawn randomly from a set of 15 rural scenes and a set of 15 urban scenes (see Table 1 for mean values).
Table 1.
Mean Relative Deviations in Spatial Ratios of Cone Excitations under Changes in Illuminant for the Three Classes of Cones (Standard Errors <0.0006)a
| Scenes | Short-Wavelength | Medium-Wavelength | Long-Wavelength |
|---|---|---|---|
| Rural | 0.041 | 0.040 | 0.041 |
| Ruralb | 0.041 | 0.040 | 0.042 |
| Urban | 0.031 | 0.040 | 0.048 |
| Urbanb | 0.028 | 0.038 | 0.046 |
| Munsell set | 0.060 | 0.099 | 0.111 |
Based on 15,000 pairs of surfaces drawn randomly from each set of 15 natural scenes and from the Munsell set.
Cropped to eliminate shadows.
The mean relative deviations over all rural scenes and over all urban scenes are small, less than 5% for each cone class, but the distributions of relative deviations are different for the two types of scenes: For long-wavelength-sensitive cones, relative deviations are larger with urban scenes than with rural scenes; for short-wavelength-sensitive cones, it is the opposite. These differences are probably due to the different color biases of the two types of scenes, indicated by the distributions of the mean chromaticities in Fig. 3 (Relative deviations obtained with the Munsell set as the reflecting surfaces are, however, rather larger, and this is discussed below.) Relative deviations are also small in relation to the natural variations of the ratios themselves: Each mean relative deviation is less than 3% of the coefficient of variation of the corresponding distribution of ratios, under either illuminant.
In view of the almost invariance of cone-excitation ratios, can they be used to label uniquely pairs of regions within scenes? This question was addressed in the following way.35 For a given scene, suppose that a pair i of pixels is chosen randomly from the 1000 available. Suppose that, for this pair, the triple of ratios of cone excitations for the three cone classes under the 4300-K illuminant is ri . If among all 1000 pairs of pixels, a pair j is then chosen such that the corresponding triple rj of ratios under the 25,000-K illuminant is nearest to ri , then the probability of the pair j coinciding with the pair i is approximately 0.91. If the number of pixel pairs falls to 100, then this probability increases to 0.98.
These and the preceding calculations of spatial ratios of cone excitations under changes in illuminant depend on each of the illuminants being uniform across corresponding pairs of points in the scene. But, if one of the points were directly illuminated and the other were in shadow, then, although the incident lights might have been related (e.g., coming mainly from the sun at one point and from the sky at the other point), their spectral distributions would have been different. Treating a shadowed region as if it were under the same illuminant as an adjacent unshadowed region could introduce a confound that influences the values of the calculated relative deviations.
To ensure that this potential confound was eliminated, all images were heavily cropped to leave unshadowed regions only, and the relative-deviation calculations were repeated. The proportion of cropping varied from approximately 25% to 40%. Results are shown in Table 1. Mean relative deviations were almost identical to those for uncropped images.
4. DISCUSSION
Hyperspectral imaging has an advantage over alternative methods for combining spatial and spectral data in that it allows spectrally selective samples of reflected light to be recorded simultaneously over the scene, a critical factor for the present application where cone excitations were to be compared over pairs of points in the image. The particular imaging system used here differs from some employed in previous studies in that image acquisition was relatively fast, which is desirable in sampling naturally illuminated scenes if temporal variations in the illuminant or the positions of surfaces within the scene are not to distort estimates of the reflected spectra. This system also has the advantage of high spatial resolution, comparable to that of the eye under similar conditions.
The rural and the urban scenes sampled in the present study represent two types of scenes with different distributions of reflectance spectra. Nevertheless, ratios of cone excitations obtained from randomly sampled pairs of points in images of these scenes were, on average, almost identical in their invariance under the selected changes in daylight: Mean relative deviations were 4.1% for rural scenes and 4.0% for urban scenes. But, when calculated individually for each of the three cone classes, mean relative deviations differed systematically across the two types of scenes.
Despite the size of the mean relative deviations being unexpectedly low, they should have been detectable by the visual system.7,36 For comparison, the mean relative deviation obtained by uniform random sampling of the Munsell set under these two illuminants was 9.0%. (Previously published values2,8 for the Munsell set were smaller, e.g., 2% in Ref. 8, Table 1, Unmodified Image, but they were derived under random sampling of the two illuminants rather than with two fixed extreme illuminants, as was done here.) Although the Munsell set has basis functions that span reflection spectra that include those of grass and other natural components of real scenes,13 in the sampling of this set, all spectra would have received equal a priori weighting. In contrast, in the sampling of the populations of spectra taken here from the sets of rural and urban scenes, the reflection spectra were weighted by their natural relative abundances.
The almost invariance of spatial ratios of cone excitations even under extreme daylight changes seems to be a general property of the visual environment rather than an artifact of a specific set of spectral-reflectance samples or of a particular sampling strategy. These findings strengthen the argument for the basic role played by cone-excitation ratios in a range of color-constancy phenomena.
ACKNOWLEDGMENTS
This work was supported by PRAXIS XXI (grant FIS/18/96); the Centro de Física da Universidade do Minho; the Institute of Materials (Minho), Braga, Portugal; the Engineering and Physical Sciences Research Council, UK; the Biotechnology and Biological Sciences Research Council, UK; and The British Council. We thank K. Amano and E. K. Oxtoby for critical reading of the manuscript and D. H. Brainard for helpful comments.
REFERENCES AND NOTES
- 1.Buchsbaum G, Gottschalk A. Trichromacy, opponent colours coding and optimum colour information transmission in the retina. Proc. R. Soc. London Ser. B. 1983;220:89–113. doi: 10.1098/rspb.1983.0090. [DOI] [PubMed] [Google Scholar]
- 2.Foster DH, Nascimento SMC. Relational colour constancy from invariant cone-excitation ratios. Proc. R. Soc. London Ser. B. 1994;257:115–121. doi: 10.1098/rspb.1994.0103. [DOI] [PubMed] [Google Scholar]
- 3.Land EH, McCann JJ. Lightness and retinex theory. J. Opt. Soc. Am. 1971;61:1–11. doi: 10.1364/josa.61.000001. [DOI] [PubMed] [Google Scholar]
- 4.McCann JJ, McKee SP, Taylor TH. Quantitative studies in Retinex theory. A comparison between theoretical predictions and observer responses to the ‘Color Mondrian’ experiments. Vision Res. 1976;16:445–458. doi: 10.1016/0042-6989(76)90020-1. [DOI] [PubMed] [Google Scholar]
- 5.West G, Brill MH. Necessary and sufficient conditions for von Kries chromatic adaptation to give color constancy. J. Math. Biol. 1982;15:249–258. doi: 10.1007/BF00275077. [DOI] [PubMed] [Google Scholar]
- 6.Worthey JA, Brill MH. Heuristic analysis of von Kries color constancy. J. Opt. Soc. Am. A. 1986;3:1708–1712. doi: 10.1364/josaa.3.001708. [DOI] [PubMed] [Google Scholar]
- 7.Nascimento SMC, Foster DH. Detecting natural changes of cone-excitation ratios in simple and complex coloured images. Proc. R. Soc. London Ser. B. 1997;264:1395–402. doi: 10.1098/rspb.1997.0194. [DOI] [PMC free article] [PubMed] [Google Scholar]
- 8.Nascimento SMC, Foster DH. Relational color constancy in achromatic and isoluminant images. J. Opt. Soc. Am. A. 2000;17:225–231. doi: 10.1364/josaa.17.000225. [DOI] [PubMed] [Google Scholar]
- 9.Foster DH, Amano K, Nascimento SMC. Colour constancy from temporal cues: better matches with less variability under fast illuminant changes. Vision Res. 2001;41:285–293. doi: 10.1016/s0042-6989(00)00239-x. [DOI] [PubMed] [Google Scholar]
- 10.Foster DH, Nascimento SMC, Amano K, Arend L, Linnell KJ, Nieves JL, Plet S, Foster JS. Parallel detection of violations of color constancy. Proc. Natl. Acad. Sci. USA. 2001;98:8151–8156. doi: 10.1073/pnas.141505198. [DOI] [PMC free article] [PubMed] [Google Scholar]
- 11.Munsell Book of Color—Matte Finish Collection. Baltimore, Md.: Munsell Color Corporation; 1976. [Google Scholar]
- 12.Parkkinen JPS, Hallikainen J, Jaaskelainen T. Characteristic spectra of Munsell colors. J. Opt. Soc. Am. A. 1989;6:318–322. [Google Scholar]
- 13.Jaaskelainen T, Parkkinen J, Toyooka S. Vector-subspace model for color representation. J. Opt. Soc. Am. A. 1990;7:725–730. [Google Scholar]
- 14.Krinov EL. Tech. Transl. TT-439. Ottawa: National Research Council of Canada; 1947. Spectral reflectance properties of natural formations. [Google Scholar]
- 15.Hendley CD, Hecht S. The colors of natural objects and terrains, and their relation to visual color deficiency. J. Opt. Soc. Am. 1949;39:870–873. doi: 10.1364/josa.39.000870. [DOI] [PubMed] [Google Scholar]
- 16.Cohen J. Dependency of the spectral reflectance curves of the Munsell color chips. Psychon. Sci. 1964;1:369–370. [Google Scholar]
- 17.Vrhel MJ, Gershon R, Iwan LS. Measurement and analysis of object reflectance spectra. Color Res. Appl. 1994;19:4–9. [Google Scholar]
- 18.Osorio D, Ruderman DL, Cronin TW. Estimation of errors in luminance signals encoded by primate retina resulting from sampling of natural images with red and green cones. J. Opt. Soc. Am. A. 1998;15:16–22. doi: 10.1364/josaa.15.000016. [DOI] [PubMed] [Google Scholar]
- 19.Ruderman DL, Cronin TW, Chiao C-C. Statistics of cone responses to natural images: implications for visual coding. J. Opt. Soc. Am. A. 1998;15:2036–2045. [Google Scholar]
- 20.Chiao C-C, Cronin TW, Osorio D. Color signals in natural scenes: characteristics of reflectance spectra and effects of natural illuminants. J. Opt. Soc. Am. A. 2000;17:218–224. doi: 10.1364/josaa.17.000218. [DOI] [PubMed] [Google Scholar]
- 21.Bonnardel V, Maloney LT. Daylight, biochrome surfaces, and human chromatic response in the Fourier domain. J. Opt. Soc. Am. A. 2000;17:677–686. doi: 10.1364/josaa.17.000677. [DOI] [PubMed] [Google Scholar]
- 22.Chiao C-C, Vorobyev M, Cronin TW, Osorio D. Spectral tuning of dichromats to natural scenes. Vision Res. 2000;40:3257–3271. doi: 10.1016/s0042-6989(00)00156-5. [DOI] [PubMed] [Google Scholar]
- 23.Webster MA, Mollon JD. Adaptation and the color statistics of natural images. Vision Res. 1997;37:3283–3298. doi: 10.1016/s0042-6989(97)00125-9. [DOI] [PubMed] [Google Scholar]
- 24.Párraga CA, Brelstaff G, Troscianko T, Moorehead IR. Color and luminance information in natural scenes. J. Opt. Soc. Am. A. 1998;15:563–569. doi: 10.1364/josaa.15.000563. For the correct spelling of the fourth author's name, see C. A. Párraga, G. Brelstaff, T. Troscianko, and I. R. Moorhead, “Color and luminance information in natural scenes: errata,” J. Opt. Soc. Am. A 15, 1708 (1998).
- 25.The term “hyperspectral” was used here instead of “multispectral” to indicate that the spacing of sample wavelengths could, in principle, have been arbitrarily fine.
- 26.Gat N. Imaging spectroscopy using tunable filters: a review. In: Szu HH, Vetterli M, Campbell WJ, Buss JR, editors. Wavelet Applications VII. Vol. 4056. Proc. SPIE; 2000. pp. 50–64. [Google Scholar]
- 27.Smith VC, Pokorny J. Spectral sensitivity of color-blind observers and the cone photopigments. Vision Res. 1972;12:2059–2071. doi: 10.1016/0042-6989(72)90058-2. [DOI] [PubMed] [Google Scholar]
- 28.Smith VC, Pokorny J. Spectral sensitivity of the foveal cone photopigments between 400 and 500 nm. Vision Res. 1975;15:161–171. doi: 10.1016/0042-6989(75)90203-5. [DOI] [PubMed] [Google Scholar]
- 29.Wyszecki G, Stiles WS. Color Science: Concepts and Methods, Quantitative Data and Formulae. New York: Wiley; 1982. [Google Scholar]
- 30.Judd DB, MacAdam DL, Wyszecki G. Spectral distribution of typical daylight as a function of correlated color temperature. J. Opt. Soc. Am. 1964;54:1031–1040. [Google Scholar]
- 31.Burton GJ, Moorhead IR. Color and spatial structure in natural scenes. Appl. Opt. 1987;26:157–170. doi: 10.1364/AO.26.000157. [DOI] [PubMed] [Google Scholar]
- 32.Zaidi Q, Spehar B, DeBonet J. Color constancy in variegated scenes: role of low-level mechanisms in discounting illumination changes. J. Opt. Soc. Am. A. 1997;14:2608–2621. doi: 10.1364/josaa.14.002608. [DOI] [PubMed] [Google Scholar]
- 33.Zaidi Q. Identification of illuminant and object colors: heuristic-based algorithms. J. Opt. Soc. Am. A. 1998;15:1767–1776. doi: 10.1364/josaa.15.001767. [DOI] [PubMed] [Google Scholar]
- 34.A formula based on a Michelson contrast produced similar values, apart from a scaling factor of approximately 2.
- 35.A suggestion due to D. H. Brainard.
- 36.Nascimento SMC, Foster DH. Detecting changes of spatial cone-excitation ratios in dichoptic viewing. Vision Res. 2001;41:2601–2606. doi: 10.1016/s0042-6989(01)00142-0. [DOI] [PubMed] [Google Scholar]


