Abstract
Many therapeutic leads fail to advance clinically because of bioavailability, selectivity, and formulation problems. Molecular transporters can be used to address these problems. Molecular transporter conjugates of otherwise poorly soluble or poorly bioavailable drugs or probes exhibit excellent solubility in water and biological fluids and at the same time an enhanced ability to enter tissues and cells and with modification to do so selectively. For many conjugates, however, it is necessary to release the drug/probe cargo from the transporter after uptake to achieve activity. Here, we describe an imaging method that provides quantification of transporter conjugate uptake and cargo release in real-time in animal models. This method uses transgenic (luciferase) reporter mice and whole-body imaging, allowing noninvasive quantification of transporter conjugate uptake and probe (luciferin) release in real time. This process effectively emulates drug-conjugate delivery, drug release, and drug turnover by an intracellular target, providing a facile method to evaluate comparative uptake of new transporters and efficacy and selectivity of linker release as required for fundamental studies and therapeutic applications.
Keywords: drug delivery, imaging, transgenic animals
Molecular transporters§ are agents which, when covalently linked to or complexed with a cargo, enable or enhance its entry into cells or tissues. Many types of transporters have been reported in recent years including peptides (1–5), peptoids (6), polyamines (7, 8), oligocarbamates (9), dendrimers (10, 11), polysaccharides (12), steroids (13), cationic lipids (14, 15), guanidinoglycosides (16), and even nanotubes (17). These transporters operate through a variety of mechanisms and some through multiple mechanisms depending on cell type, cargo, and other variables (5, 18–22). Among the classes of transporters, oligoguanidine based transporters are particularly promising, providing excellent water solubility and at the same time the remarkable ability to rapidly cross the nonpolar membrane of a cell. These transporters have been used for the delivery of small molecules, peptides, proteins, nucleic acids, liposomes, and imaging agents (23–29) and have been modified to provide selective delivery of drugs into target cells and tissue (30, 31). Significantly, an octaarginine transporter has been shown to facilitate uptake into tissue (32), including human skin (23). A conjugate of octaarginine and Cyclosporin A enabling uptake of the latter selectively into the skin and thereby effectively eliminating its systemic toxicity has been advanced into Phase II clinical trials (23).
There are two overarching and interrelated challenges confronting the further advancement of this field: the development of methods to quantify the uptake of new or existing transporters in real-time in animal models and the identification and evaluation of linkers that would allow for controllable release (if required) of a free drug/probe from the transporter conjugate only after cell or tissue entry. With respect to the former, most studies on transporters have focused on their cellular uptake and have relied heavily on a fluorescence readout. Transporters covalently conjugated to fluorescent dyes have been used to measure uptake in vitro, but they cannot be used to readily measure cargo release in a cell or applied to real-time in vivo analyses. Although radiolabeled conjugates can be used for in vivo studies, they require special handling and, significantly, neither establish whether the labeled conjugate is intra- or extracellular nor whether it is intact or has released its cargo. A functional readout based on biological activity (protection against ischemic damage) has been used to measure uptake of an oligoarginine-peptide conjugate and release of its otherwise cell-impermeable peptide cargo through intracellular disulfide bond cleavage (26). This assay, however, does not lend itself to rapidly evaluating new transporters and linkers, because it is costly in both time and animals and only indirectly measures release of the active cargo through a chemical readout (creatine phosphokinase release from damaged cells).
Closely coupled to the importance of developing methods for the real-time quantification of transporter uptake is the challenge of identifying and evaluating new linkers whose cleavage would allow for the release of a cargo from a transporter conjugate after entry into targeted cells or tissue. Theoretically, the cleavage of a linker between a cargo and transporter could be effected by chemical, photochemical, or biochemical processes. Biochemical activation is especially promising, because it would allow for the use of transporter-linker-cargo systems that would be shelf stable and only release the cargo in the presence of a target enzyme or under conditions specific to the target cell or tissue. Although many enzyme classes could be targeted for this purpose, it is again difficult to measure the dynamic effectiveness of such enzyme activated release systems, in real-time, in animals. In this article, we describe an imaging method that allows for the facile quantification of the uptake of a transporter-linker-luciferin conjugate and release of its cargo, luciferin, in vivo, in real-time without killing animals. This process is accomplished in transgenic reporter mice, FVB-luc+, where the transgene is comprised of a strong constitutive promoter (synthetic β-actin) and the coding sequence from firefly luciferase such that all cells of this animal express the luciferase reporter gene (33). Intracellular delivery of firefly luciferin, a substrate for luciferase, results in the formation of oxyluciferin and the emission of photons, measurable with a cooled charge-coupled device camera (34).
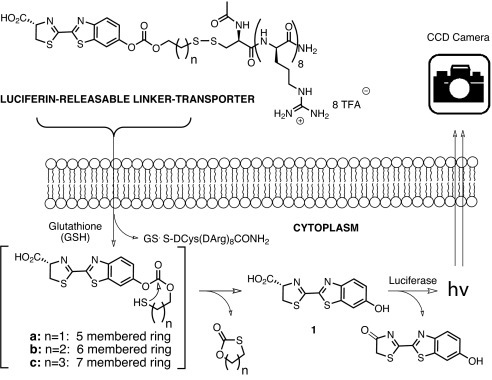
In the present study, transporter uptake and linker release with the FVB-luc+ mouse are investigated by using a conjugate comprised of a transporter attached to luciferin through a bioactivatable linker. A disulfide linker was selected because its cleavage would occur only after cell entry upon encountering a high glutathione concentration (15 mM inside vs. 15 μM outside) (35) (Fig. 1). The resultant thiol would then undergo cyclization, releasing free luciferin (1) which would be converted by luciferase to oxyluciferin and a photon of light (36). Because luciferin derivatives alkylated on the phenolic oxygen do not generate light (37), only free luciferin is measured. Importantly, the signal-to-noise ratios are excellent relative to fluorescence, because there is essentially no background tissue luminescence. The approach is readily applied to cells and to live animals (33).
Fig. 1.
Scheme for measurement of intracellular release.
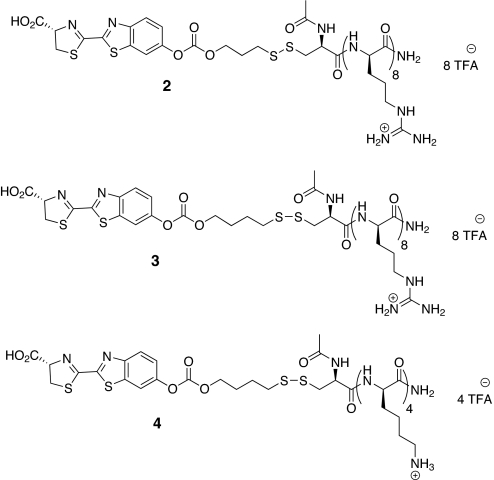
The design and step-economical syntheses of the luciferin-transporter conjugates (Fig. 2) used herein were described in ref. 38. These conjugates demonstrated ex vivo stability and at the same time quick release in PC3M-luc cells. For this current study, a topical administration assay, using FVB-luc+ transgenic mice, was selected to measure conjugate uptake and cargo release in the skin. Because of the ubiquitous expression of luciferase in these animals, this method is also amenable to the quantification of uptake in other organs (lung, eye, etc.) (34) and can also be applied to the dynamic evaluation of bioactivatable release by various enzymes (e.g., esterases, proteases, and phosphatases).
Fig. 2.
Luciferin-releasable linker-transporter conjugates; conjuate 2, r8 transporter-disulfide linker-luciferin conjugate whose release would involve closure of a six-membered ring; conjugate 3, a homologous conjugate whose release would involve closure of a seven-membered ring; conjugate 4, negative control, analogous to 3, but incorporating a tetralysine, whose cellular uptake is minimal.
Results
Calibration with Intradermal Injection.
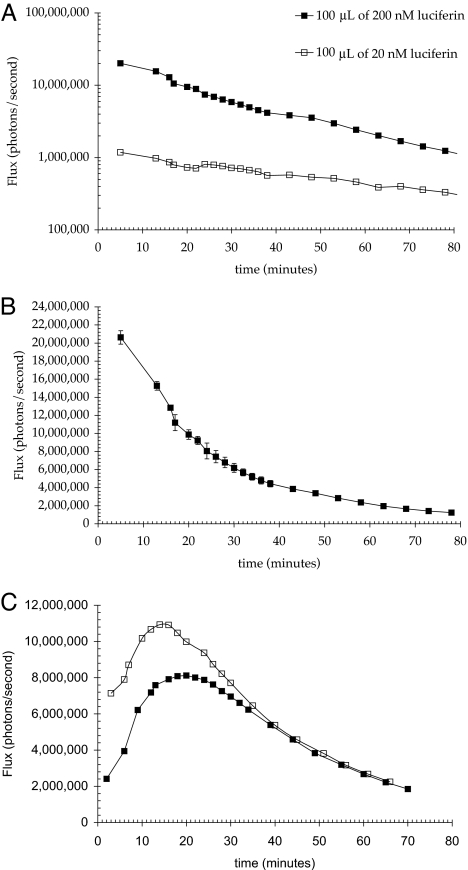
Calibration of this mouse model for intradermal delivery was conducted by using free luciferin. To establish the amount of free luciferin needed for signal detection from the skin of FVB-luc+ mice and whether light emitted is dose dependent, a known amount of free luciferin (100 μl of either a 20 nM or a 200 nM solution of luciferin in HBS (Hepes buffered saline) was injected intradermally into the flanks of mice, and the resulting bioluminescence signal (photons/unit time) was measured. The total number of photons emitted was calculated by integrating the area under the curve (Fig. 3).
Fig. 3.
Resultant bioluminescence after intradermal injection of luciferin in HBS pH 7.4 into transgenic (FVB-luc+) mice. (A and B) Approximately 10 times the amount of light was observed when the luciferase expressing mice were injected with 200 vs. 20 nM luciferin (1) (A). Area under the curve for 200 nM was 3.02 × 10¹⁰ photons, whereas that for 20 nM was 3.11 × 10⁹ photons (10.24%). When plotted linearly, the bioluminescence rapidly decreases for the first 30 min (B). The plot is the average of three injections in separate animals. (C) Resultant bioluminescence after intradermal injection of 100 μl of 200 nM carbonate 2 in HBS pH 7.4 into luciferase transgenic (FVB-luc+) mice. The pattern of luminescence is shown for two different animals. The areas under the curve are 2.54 and 2.01 × 10¹⁰ photons.
The pattern of luminescence as a function of time was reproducible and similar for both doses, with a steady postinjection decrease in light emission over the duration of measurement (Fig. 3A). The area under the curve for the 10-fold higher dose was almost exactly 10 times that of the lower dose, indicating at these concentrations a linear response to dose and no saturation was observed for up to 2 μM injected. Based on the known amount of luciferin injected and the observed luminescence, one photon of light is detected by the camera for every 400 molecules of luciferin injected. As is shown in Fig. 3A, there was 10 times more light observed for the higher doses throughout the time course of the experiment. Additionally, for topical applications at various concentrations, an increase in the luciferin conjugate concentration resulted in a linear increase in signal [see supporting information (SI)]. This data supports a proportional relationship between photons observed and injected luciferin (or applied conjugate) at multiple time points over the period of observation.
To determine the number of photons produced from a known amount of the conjugate independent of transporter mediated skin entry, the luciferin conjugate 2 was injected intradermally as described above for free luciferin. Intradermal injection of conjugate 2 generated a distinctly different temporal pattern of bioluminescence relative to that observed for free luciferin (Fig. 3C). A significant signal is apparent immediately after injection, which increases for the next 20 min and then slowly decays over the next 50 min. The profile is consistent with the time dependent generation and depletion of luciferin upon cellular uptake and linker cleavage. Approximately 80% of the theoretical amount of luciferin in the injected sample of conjugate 2 was accounted for when the total number of photons emitted in 60 min was multiplied by the previously calculated number of 400 molecules of luciferin per photon detected.
Topical Application of Luciferin Conjugates.
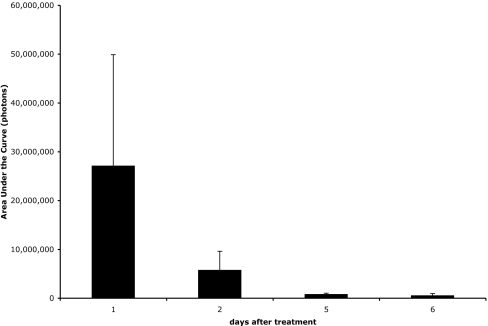
For topical applications, the fur of the FVB-luc+ mice interferes with contact between the conjugate sample and the skin, creating reproducibility problems during administration. There were no transgenic hairless mice available and shaving alone with razors did not uniformly remove fur. Moreover, highly variable degradation of the stratum corneum, a barrier of great importance for topical applications, was observed, creating further reproducibility problems in measuring uptake. The alternative use of a depilatory (Nair; Church and Dwight, Princeton, NJ) removed fur more uniformly but also caused variable erosion of the stratum corneum, compromising the ability to reproducibly study uptake in intact skin. Our observation that luciferin readily enters the skin of mice whose stratum corneum has been eroded and produces a bioluminescent signal provided the basis for a solution to this reproducibility problem. Specifically, by applying only luciferin (1) to the skin of the transgenic mice one can determine the integrity of the stratum corneum and importantly its regrowth over time. As is shown in Fig. 4, at the first time point after treatment with Nair, a large and highly variable signal is observed. As time progresses, however, not only does the signal decrease, indicating decreasing penetration of luciferin with stratum corneum regrowth, but there is more reproducibility in the signal.
Fig. 4.
Uptake of free luciferin (1) into skin immediately after depilatory treatment is significant and variable but is reduced with time to an insignificant level as the stratum corneum reestablishes itself. Total luminescence observed after topical application of 15 μl of 5.5 mM luciferin (1) in 200 mM NaOAc (pH 6.0) vehicle at various time points after treatment with Nair (Church and Dwight).
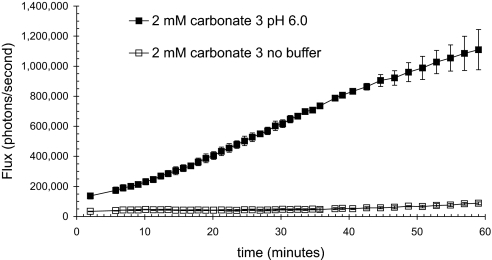
From this time-course study, the ideal time to obtain a reproducible signal was determined to be 5 days after treatment with Nair. The next step was to determine the best vehicle for topical application of the conjugates. Solutions of 5 mM trifluoroacetate salts of octa-d-arginine luciferin conjugates have a pH close to 2.0. The importance of including a buffer was tested by topically applying 15 μl of a 5 mM solution of 3 either in 25% water, or buffered with 25% 200 mM NaOAc (pH 6.0), and combining with 75% PEG 400 (Fig. 5). There was a dramatic difference in the amount of light produced, with a steadily increasing amount of luminescence being observed only when the conjugate was applied in the buffered vehicle. The lack of light in the absence of buffer could arise from the acidification of the skin by the conjugate, which would decrease both the activity of luciferase and the rate of release of luciferin (39). These results establish the need to include an appropriate buffer in the vehicle.
Fig. 5.
Inherent acidity of the trifluoroacetate salt of the conjugate 3 results in decreased bioluminescence. Differential bioluminescence observed when conjugate applied in buffered (filled squares) or unbuffered (open squares) vehicle. Carbonate 3 (2 mM) was applied in either 25% water/75% PEG 400 or 25% 200 mM NaOAc, pH 6.0/75% PEG 400.
With the identification of an appropriate vehicle for application, a procedure for reproducibly obtaining an intact, fur-free stratum corneum and with calibrations based on intradermal injections of luciferin and of a luciferin conjugate, the uptake and release of luciferin from two topically administered, disulfide linked conjugates of luciferin and octa-d-arginine were investigated. The most reproducible method to evaluate the relative performance of transporters and linkers was to apply a single drop of a solution of each conjugate to the flank of anesthetized FVB-luc+ mice. The drop was allowed to remain in contact with the skin for the duration of the assay during which luminescence from the animal was monitored. In selected experiments the wash sample containing the residual contents of the administered drop was examined by analytical HPLC and the conjugate was found to be fully intact. The administration experiments were designed for reproducibility, for comparative quantification of different conjugates and release systems, and to conserve camera time and not to achieve optimum therapeutic levels. However, as would be expected, greater uptake can be achieved by increasing the dose, exposure time or area of application or by repeated applications.
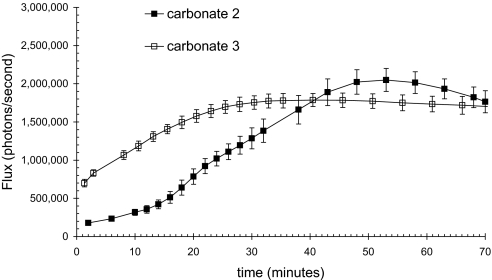
As is shown in Fig. 6, both conjugates generated a strong and reproducible luminescence signal. The difference between the observed signal and the amount of conjugate entering the skin represents the nonproductive fates of the conjugate (e.g., incomplete uptake, incomplete cleavage, clearance from the skin, metabolism). Based on the intradermal calibration, the total amount of luciferin released in 1 hr can be determined by multiplying the area under the curve by 400 molecules per detected photon. Dividing by Avogadro's number indicates that the amount of luciferin released is 3.62 × 10⁻¹² mol for carbonate 2 and 2.0 × 10⁻¹¹ mol for carbonate 3. From the area of application and the thickness of mouse skin (0.69 mm), the cumulative intradermal concentrations resulting from skin exposure over 1 hr are 47 nM and 62 nM, respectively. The amount of light generated is linearly proportional to the amount of conjugate applied within the range of 0.5 to 4.5 mM (SI), affording intradermal concentrations as high as 299 nM.
Fig. 6.
Observed bioluminescence from luciferase transgenic mice as a function of time after topical application of 15 μl of 5 mM carbonate 2 and 3 in 75% PEG 400/25% 200 mM NaOAc, pH 6.0.
Negative Control.
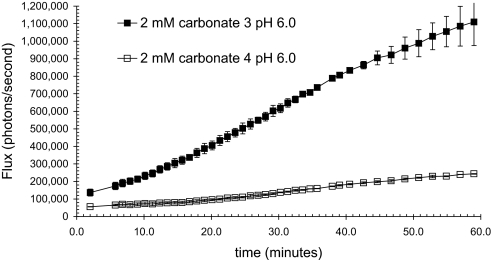
It was necessary to determine whether the light observed was solely due to transport and intracellular release or conjugate decomposition and luciferin release on the skin. In addition to analyzing the post assay droplet for free luciferin, another control was to test a conjugate that is composed of an inefficient transporter with exactly the same releasable linker and luciferin cargo. Lysine tetramers are known to be poor transporters for skin entry (40). Therefore, a conjugate of a lysine tetramer 4 was synthesized and tested (Fig. 7). When this less effective transporter conjugate 4 is compared with the corresponding r8 conjugate 3, there is 77% less light, thus establishing that luminescence results primarily from the intracellular release and not external hydrolysis of the prodrug.
Fig. 7.
Observed bioluminescence from luciferase transgenic mice as a function of time after topical application of 15 μl of 2 mM carbonate 3 and 4 in 75% PEG 400/25% 1 M NaOAc, pH 6.0.
Discussion
As the field of transporter-mediated drug and probe delivery moves forward, quantification of the comparative performance of existing and new transporters will have increasing importance in the selection of preferred systems for therapeutic, diagnostic, or imaging purposes. Methods that allow for quantification of transporter uptake into both cells and animals and especially temporal tissue distribution are needed. In addition, for many conjugates, release of free cargo is required and thus real-time release must also be evaluated in intact tissue. Ideally, these evaluations would be done in living systems, using an assay with a real-time readout. We opted to use a luciferin-luciferase reporter system, because both stably transfected cell lines and a transgenic reporter mouse (FVB-luc+) that expresses luciferase in all of its cells were available, allowing for screening in cells and animals. Additionally, the biochemistry of the luciferin-luciferase system is well established and lends itself superbly to the current objective because of the absence of background signal leading to sensitive in vivo detection. Another advantage is that only free luciferin is a substrate for luciferase, and the reaction is only active within cells because of its ATP dependence (41). This process emulates a drug-target interaction, and the photon release on turnover can be quantified with excellent sensitivity, using a charge-coupled device camera (IVIS100; Xenogen, Alameda, CA). A further feature of this system is that, by design, it is not intended to distinguish among mechanisms of entry and can thus be used as a first screen to quantify the cumulative success of entry and release.
In this study, we built on our work in which conjugates were synthesized, and their performance was tested in cells (38). The synthesis of the luciferin conjugates proved initially to be difficult because of luciferin's limited solubility in organic solvents. After much effort, however, a strategy was found to readily prepare the conjugates shown in Fig. 2 in only three steps and in good yield without protecting groups, providing a versatile methodology for the synthesis and study of other transporter-linker conjugates. The conjugates are stable at room temperature (for up to months as solids) for storage and handling, but release luciferin in minutes when exposed to dithiothreitol or to the reducing environment in cells (38). Analyses of free luciferin injected directly into the skin of transgenic mice revealed that the number of photons generated was reproducible and had a linear dose–response curve over the range tested. A similar study was conducted by intradermal injection of the transporter conjugate. These calibration experiments were intended to determine the number of photons produced from a known amount of agent independent of transporter mediated entry into skin. In the case of conjugate 2, 80% of the theoretically possible photon flux and therefore free luciferin based on the injected dose, was detected. The difference between the amount of luciferin injected and of photons detected is in part a reflection of the amount of injected luciferin that has access to the intracellular enzyme (34), the uniformity of luciferase expression in different cell types (33, 42), the number of luciferin molecules turned over by luciferase, the quantum efficiency of the enzyme, and the absorption and scattering of the signal by mammalian tissues. The photon flux thus represents a minimum but reproducibly quantifiable measure of uptake and release.
The results generated from the intradermal injection, and calibration assays were then used to determine the amount of luciferin delivered and released by topically administered octaarginine transporter conjugates of luciferin. A great deal of variability in the photon readout was initially observed because of erosion of the stratum corneum resulting from the method of fur removal. A method was devised to monitor stratum corneum regrowth after fur removal by measuring the diminishing ability of free luciferin to enter skin as a function of time. Five days after fur removal, the stratum corneum in the area of fur removal was restored as indicated by the minimal uptake of free luciferin. Uptake experiments conducted after day 5 and before day 12 exhibited excellent reproducibility and were not complicated by the presence of fur.
Once the procedure for fur removal was established, the next step was to determine a vehicle with which to apply the conjugate. The transporter has been shown to acidify its environment, making it essential to buffer the vehicle with NaOAc, pH 6.0 buffer. In unbuffered vehicle, essentially no signal was observed. To assure reproducibility in the application procedure, we found that administration of a known volume of solution to the prepared skin surface provided reproducible control of the area of application. No further manipulation of the sample was done. This procedure was designed for the comparative and reproducible evaluation of the conjugates under a standard set of administration conditions and not for maximizing uptake. For therapeutic applications, administration over a larger area, using a rubbing in procedure would result in greater uptake. Using the drop administration procedure and the values determined by the intradermal injection of free luciferin and conjugate, we were able to determine the amount of luciferin released by the conjugates. In the case of conjugate 3, 299 nM of luciferin was delivered in a 1-hr period, which is well above what is required for therapeutic activity for many drugs. For therapeutic applications, it is noteworthy that the area of signal readout resulting from released luciferin was larger than the area of application of the conjugate, and it increased with time, indicating that the conjugate moved inward and laterally after passage across the stratum corneum.
As a control, it was necessary to determine whether the majority of light was due to intracellular release of luciferin by disulfide cleavage after cell entry or extracellular hydrolysis of the carbonate functionality. This was done by attaching a luciferin conjugate to a lysine tetramer, using the same carbonate disulfide linker. It is known that lysine is a poor transporter relative to octaarginine, and thus the conjugate would produce a signal only if the conjugate were cleaved extracellularly or during administration (40). In comparison to the octaarginine transporter the lysine tetramer produced a significantly attenuated signal, indicating that the light signal reflects the efficacy of transporter uptake and bioactivatable release and not extracellular hydrolysis of the conjugate or cleavage during administration. This is consistent with previous in vivo experiments (43), suggesting that signals are only produced after intracellular uptake of substrate.
This assay allowed us to test a number of linkers for topical uptake and release without having to kill animals or manipulate tissue to collect the data. The linkers that were developed are currently being used to study delivery of therapeutic agents. In addition to studying the comparative performance of transporters in real-time, this protocol also allows for the study of bioactivatable release in real-time and could thus be applied to evaluation of release strategies for which dynamic enzyme functional activity in animal tissue is not available. The bioactivatable release strategies studied and optimized by using the luciferin/luciferase system could then be applied to the release of drugs with similar functionalities (phenolic oxygens and related heteroatoms).
In summary, we have developed an in vivo assay that allows for the real-time quantification of uptake and release of molecular transporters conjugated to luciferin through a bioactivatable disulfide linker. The transporter conjugates are stable on storage (up to months) and handling. They are not substrates for luciferase, but release luciferin within seconds to minutes when exposed to DTT or the reducing environment of cells in culture or in animals. For a given linker, this method allows for the quantification of the relative performance of new and existing transporters. For a given transporter, this method allows for the quantification of the relative performance of bioactivatable linkers in releasing the luciferin cargo. Although uptake into skin was the focus of this initial study, this method can also be applied to other modes of administration (e.g., i.v., i.p., inhalation, ocular, buccal, etc.) (34). More generally, when used for the bioactivatable release of luciferin, this procedure can be used to measure the temporal and spatial availability and dynamic effectiveness of extra- and intracellular enzymes (e.g., esterases, phosphatases, proteases) or conditions that promote cleavage, information of critical value in prodrug design, and performance. The ability to measure uptake of transporters and release of their probe or drug cargo in real-time in animals is an important step in advancing this technology toward fundamental and therapeutic applications.
Materials and Methods
Synthesis of Conjugates.
Unless otherwise stated, all reagents and solvents were obtained from commercial sources and used without purification. Compounds 2 and 3 have been previously reported (38). For synthesis of compound 4, see SI.
Transgenic Animals.
A transgenic animal expressing firefly luciferase (FVB-luc+) was created by using standard methods of pronuclear injection (42) and used here to evaluate the delivery of releasable luciferin conjugates across the skin. The transgene comprised of a hybrid CMV-chicken-β-actin promoter, a modified coding sequence based on the firefly luciferase gene (present in the pGL3 vector from Promega, Madision, WI), a FMDV 2A ribosomal slippage site and GFP gene. The animals first described by Cao et al. (33) were shown to express luciferase in most cell types (not expressed in erythroid cells) and exhibit GFP expression in the skin but not in many other tissues (40). All procedures were approved by the Animal Care and Use Committee of Stanford University.
Mouse Preparation.
Animals were treated after hair removal by clipping with a large hair clipper on the right flank. Subsequently, Nair (Church and Dwight) was applied for 90 seconds then wiped off, and the animals were washed well with wet paper towels and dried. Five days were allowed for stratum corneum regrowth before the mice were used for imaging.
Intradermal Injection of Luciferin (1).
A 2 mM solution of luciferin was made by dissolving 0.62 mg in 1 ml water pH 5.5. This solution was serially diluted with HBS (pH 7.4) (1:10) to make 1 ml of 200, 20, 2, 0.2, and 0.02 μM solutions. Solutions of luciferin (1) (100 μl), 0.02 and 0.2 μM, were injected intradermally into two different mice. Luminescence was observed, and the higher dose was shown to be sufficiently intense to be useful for the experiment. Subsequently, three other mice were injected and imaged as rapidly as possible.
Intradermal Injection of Conjugate.
A 1 mM solution of carbonate 2 was made by dissolving 2.1 mg in 770 μl water pH 5.5. This solution serially diluted with HBS (pH 6.9) (1:10) to make 1 ml of 200, 20, 2, 0.2, and 0.02 μM solutions. Solutions of carbonate 2 (100 μl), 0.2 μM, were injected intradermally into two different mice. Luminescence was observed, and the dose was shown to be sufficiently intense to be useful for the experiment.
Topical Application of Conjugates.
In an Eppendorf (Boulder, CO) tube, we combined 25 μl of 200 mM NaOAc pH 6.0, 55 μl of PEG 400 with 1 mg each of carbonate 2 and carbonate 3 to produce final concentrations of carbonate 2 of 4.93 mM, of carbonate 3 of 4.93 mM, and sodium acetate of 63 mM. Solutions (15-μl) of 5 mM carbonate 2 and carbonate 3 were topically applied in two locations on each of four mice, using a standard pipette tip (1–20 μl size). Luminescence was observed over ≈60 min.
In Vivo Bioluminescence Imaging.
Animals were imaged in a dark chamber, using a cooled charge-coupled device camera (IVIS100; Xenogen) as described in ref. 44, and the data were analyzed with LivingImage software (Xenogen). Data are expressed as photons per ster radian per sec for each region of interest such that the data are not dependent on camera settings, chamber geometry, or integration time.
Other Methods.
Additional details are provided in SI.
Supplementary Material
Acknowledgments
This work was supported by American Chemical Society Medicinal Chemistry and Amgen (Thousand Oaks, CA) (to L.R.J.), National Institutes of Health Grants CA31841 and CA31845, National Science Foundation Grant 002865-SU, and CellGate (Redwood City, CA).
Footnotes
The authors declare no conflict of interest.
This article is a PNAS Direct Submission.
For recent reviews on transporters, including lead references to work on guanidinium transporters from the groups of Torchilin, Prochiantz, Langel, Futaki, Vives, Wender, Doudy, Piwnica-Worms, Seebach, Gellman, Goodman, and others, see: (2005) Adv. Drug Deliv. Rev. 57:489–651.
This article contains supporting information online at www.pnas.org/cgi/content/full/0703919104/DC1.
References
- 1.Snyder EL, Dowdy SF. Pharm Res. 2004;21:389–393. doi: 10.1023/B:PHAM.0000019289.61978.f5. [DOI] [PubMed] [Google Scholar]
- 2.Trehin R, Merkle HP. Eur J Pharm Biopharm. 2004;58:209–223. doi: 10.1016/j.ejpb.2004.02.018. [DOI] [PubMed] [Google Scholar]
- 3.Fischer R, Fotin-Mleczek M, Hufnagel H, Brock R. ChemBioChem. 2005;6:2126–2142. doi: 10.1002/cbic.200500044. [DOI] [PubMed] [Google Scholar]
- 4.Gupta B, Levchenko TS, Torchilin VP. Adv Drug Deliv Rev. 2005;57:637–651. doi: 10.1016/j.addr.2004.10.007. [DOI] [PubMed] [Google Scholar]
- 5.Zorko M, Langel U. Adv Drug Deliv Rev. 2005;57:529–545. doi: 10.1016/j.addr.2004.10.010. [DOI] [PubMed] [Google Scholar]
- 6.Wender PA, Mitchell DJ, Pattabiraman K, Pelkey ET, Steinman L, Rothbard JB. Proc Natl Acad Sci USA. 2000;97:13003–13008. doi: 10.1073/pnas.97.24.13003. [DOI] [PMC free article] [PubMed] [Google Scholar]
- 7.Wang C, Delcros J-G, Cannon L, Konate F, Carias H, Biggerstaff J, Gardner RA, Phanstiel O., IV J Med Chem. 2003;46:5129–5138. doi: 10.1021/jm030223a. [DOI] [PubMed] [Google Scholar]
- 8.Reguera RM, Tekwani BL, Balana-Fouce R. Comp Biochem Physiol C Toxicol Pharmacol. 2005;140C:151–164. doi: 10.1016/j.cca.2005.02.006. [DOI] [PubMed] [Google Scholar]
- 9.Wender PA, Rothbard JB, Jessop TC, Kreider EL, Wylie BL. J Am Chem Soc. 2002;124:13382–13383. doi: 10.1021/ja0275109. [DOI] [PubMed] [Google Scholar]
- 10.Wender PA, Kreider EL, Pelkey ET, Rothbard JB, VanDeusen CL. Org Lett. 2005;7:4815–4818. doi: 10.1021/ol051496y. [DOI] [PubMed] [Google Scholar]
- 11.VanDeusen CL. Guanidinium-Rich Molecular Transporters for Drug Delivery. Palo Alto, CA: Stanford University; 2003. PhD thesis. [Google Scholar]
- 12.Alaimo C, Catrein I, Morf L, Marolda CL, Callewaert N, Valvano MA, Feldman MF, Aebi M. EMBO J. 2006;25:967–976. doi: 10.1038/sj.emboj.7601024. [DOI] [PMC free article] [PubMed] [Google Scholar]
- 13.Tsuji A, Tamai I. Pharm Res. 1996;13:963–977. doi: 10.1023/a:1016086003070. [DOI] [PubMed] [Google Scholar]
- 14.Rao NM, Gopal V. Expert Opin Ther Pat. 2006;16:825–844. [Google Scholar]
- 15.Eichhorn ME, Becker S, Strieth S, Werner A, Sauer B, Teifel M, Ruhstorfer H, Michaelis U, Griebel J, Brix G, et al. Cancer Biol Ther. 2006;5:89–96. doi: 10.4161/cbt.5.1.2346. [DOI] [PubMed] [Google Scholar]
- 16.Elson-Schwab L, Garner OB, Schuksz M, Crawford BE, Esko JD, Tor Y. J Biol Chem. 2007;282:13585–13591. doi: 10.1074/jbc.M700463200. [DOI] [PubMed] [Google Scholar]
- 17.Kam NWS, Jessop TC, Wender PA, Dai H. J Am Chem Soc. 2004;126:6850–6851. doi: 10.1021/ja0486059. [DOI] [PubMed] [Google Scholar]
- 18.Maiolo JR, Ferrer M, Ottinger EA. Biochim Biophys Acta. 2005;1712:161–172. doi: 10.1016/j.bbamem.2005.04.010. [DOI] [PubMed] [Google Scholar]
- 19.Drin G, Cottin S, Blanc E, Rees AR, Temsamani J. J Biol Chem. 2003;278:31192–31201. doi: 10.1074/jbc.M303938200. [DOI] [PubMed] [Google Scholar]
- 20.Nakase I, Niwa M, Takeuchi T, Sonomura K, Kawabata N, Koike Y, Takehashi M, Tanaka S, Ueda K, Simpson JC, et al. Mol Ther. 2004;10:1011–1022. doi: 10.1016/j.ymthe.2004.08.010. [DOI] [PubMed] [Google Scholar]
- 21.Rothbard JB, Jessop TC, Lewis RS, Murray BA, Wender PA. J Am Chem Soc. 2004;126:9506–9507. doi: 10.1021/ja0482536. [DOI] [PubMed] [Google Scholar]
- 22.Rothbard JB, Jessop TC, Wender PA. Adv Drug Del Rev. 2005;57:495–504. doi: 10.1016/j.addr.2004.10.003. [DOI] [PubMed] [Google Scholar]
- 23.Rothbard JB, Garlington S, Lin Q, Kirschberg TA, Kreider EL, McGrane P, Wender PA, Khavari PA. Nat Med. 2000;6:1253–1257. doi: 10.1038/81359. [DOI] [PubMed] [Google Scholar]
- 24.Kirschberg TA, VanDeusen CL, Rothbard JB, Yang M, Wender PA. Org Lett. 2003;5:3459–3462. doi: 10.1021/ol035234c. [DOI] [PubMed] [Google Scholar]
- 25.Samuel B, Hearn B, Mack D, Wender PA, Rothbard JB, Kirisits M, Mui E, Wernimont S, Roberts C, Muench S, et al. Proc Natl Acad Sci USA. 2003;100:14281–14286. doi: 10.1073/pnas.2436169100. [DOI] [PMC free article] [PubMed] [Google Scholar]
- 26.Chen L, Wright LR, Chen C, Oliver SF, Wender PA, Mochly-Rosen D. Chem Biol. 2001;8:1123–1129. doi: 10.1016/s1074-5521(01)00076-x. [DOI] [PubMed] [Google Scholar]
- 27.Kim DT, Mitchell DJ, Brockstedt DG, Fong L, Nolan GP, Fathman CG, Engleman EG, Rothbard JB. J Immunol. 1997;159:1666–1668. [PubMed] [Google Scholar]
- 28.Robbins PB, Oliver SF, Sheu SM, Goodnough JB, Wender PA, Khavari PA. BioTechniques. 2002;33:190–194. doi: 10.2144/02331dd02. [DOI] [PubMed] [Google Scholar]
- 29.Siprashvili Z, Scholl FA, Oliver SF, Adams A, Contag CH, Wender PA, Khavari PA. Hum Gene Ther. 2003;14:1225–1233. doi: 10.1089/104303403767740768. [DOI] [PubMed] [Google Scholar]
- 30.Jiang T, Olson ES, Nguyen QT, Roy M, Jennings PA, Tsien RY. Proc Natl Acad Sci USA. 2004;101:17867–17872. doi: 10.1073/pnas.0408191101. [DOI] [PMC free article] [PubMed] [Google Scholar]
- 31.Goun EA, Shinde R, Dehnert KW, Adams-Bond A, Wender PA, Contag CH, Franc BL. Bioconjugate Chem. 2006;17:787–796. doi: 10.1021/bc0503216. [DOI] [PubMed] [Google Scholar]
- 32.Wright LR, Rothbard JB, Wender PA. Curr Protein Pept Sci. 2003;4:105–124. doi: 10.2174/1389203033487252. [DOI] [PubMed] [Google Scholar]
- 33.Cao YA, Wagers AJ, Beilhack A, Dusich J, Bachmann MH, Negrin RS, Weissman IL, Contag CH. Proc Natl Acad Sci USA. 2004;101:221–226. doi: 10.1073/pnas.2637010100. [DOI] [PMC free article] [PubMed] [Google Scholar]
- 34.Shinde R, Perkins J, Contag CH. Biochemistry. 2006;45:11103–11112. doi: 10.1021/bi060475o. [DOI] [PubMed] [Google Scholar]
- 35.Saito G, Swanson JA, Lee K. Adv Drug Deliv Rev. 2003;55:199–215. doi: 10.1016/s0169-409x(02)00179-5. [DOI] [PubMed] [Google Scholar]
- 36.Jenkins DE, Oei Y, Hornig YS, Yu S-F, Dusich J, Purchio T, Contag PR. Clin Exp Metastasis. 2003;20:733–744. doi: 10.1023/b:clin.0000006815.49932.98. [DOI] [PubMed] [Google Scholar]
- 37.Denburg JL, Lee RT, McElroy WD. Arch Biochem Biophys. 1969;134:381–394. doi: 10.1016/0003-9861(69)90297-5. [DOI] [PubMed] [Google Scholar]
- 38.Jones LR, Goun EA, Shinde R, Rothbard JB, Contag CH, Wender PA. J Am Chem Soc. 2006;128:6526–6527. doi: 10.1021/ja0586283. [DOI] [PubMed] [Google Scholar]
- 39.Amidon WJ, Pfeil JE, Gal S. Biochem J. 1999;343:425–433. [PMC free article] [PubMed] [Google Scholar]
- 40.Mitchell DJ, Kim DT, Steinman L, Fathman CG, Rothbard JB. J Pept Res. 2000;56:318–325. doi: 10.1034/j.1399-3011.2000.00723.x. [DOI] [PubMed] [Google Scholar]
- 41.Seliger HH, McElroy WD. Arch Biochem Biophys. 1960;88:136–141. doi: 10.1016/0003-9861(60)90208-3. [DOI] [PubMed] [Google Scholar]
- 42.Cao YA, Bachmann MH, Beilhack A, Yang Y, Tanaka M, Swijnenburg RJ, Reeves R, Taylor-Edwards C, Schulz S, Doyle TC, et al. Transplant. 2005;80:134–139. doi: 10.1097/01.tp.0000164347.50559.a3. [DOI] [PubMed] [Google Scholar]
- 43.Contag CH, Spilman SD, Contag PR, Oshiro M, Eames B, Dennery P, Stevenson DK, Benaron DA. Photochem Photobiol. 1997;66:523–531. doi: 10.1111/j.1751-1097.1997.tb03184.x. [DOI] [PubMed] [Google Scholar]
- 44.Contag CH, Bachmann MH. Annu Rev Biomed Eng. 2002;4:235–260. doi: 10.1146/annurev.bioeng.4.111901.093336. [DOI] [PubMed] [Google Scholar]
Associated Data
This section collects any data citations, data availability statements, or supplementary materials included in this article.


