Abstract
Elimination of misfolded membrane proteins in the endoplasmic reticulum (ER) affects cell survival and growth and can be triggered by either local physiologic events or disease-associated mutations. Regulation of signaling receptor degradation involves both cytosolic and ER luminal molecular chaperones, but the mechanisms and timing of this process remain uncertain. Here we report that calreticulin (CRT) and Hsp90 exert distinct effects on the stability and cell surface levels of native and misfolded forms of the human insulin receptor (hIR) and a human variant found in type A insulin resistance. CRT was unique in stabilizing the disease variant and in augmenting hIR expression when glycolysis was abrogated. Effects of Hsp90 were independent of receptor tyrosine phosphorylation and did not change levels of downstream signaling kinases. Live cell imaging revealed that movement of the hIR through the ER was accelerated by misfolding or by overexpression of either CRT or Hsp90. Together, our results indicate that both CRT and Hsp90 control expression of hIR at its earliest maturation stages and modulate its movement within the ER before either degradation or cell surface expression.
Keywords: protein folding, endoplasmic reticulum quality control, insulin resistance
The early maturation of transmembrane signaling receptor tyrosine kinases (RTKs) occurs in the endoplasmic reticulum (ER) under the surveillance of an intricate quality control (QC) system that redirects mutant or improperly processed proteins to ER-associated degradation (ERAD) (reviewed in refs. 1 and 2). The level of expression and activity of RTKs affects cell metabolism and growth and is thought to involve a network of protein-folding enzymes, molecular chaperones, and proteases on both sides of the ER membrane. However, how these individual ER and cytosolic factors collaborate to redirect mutant or misprocessed receptors to degradation and the factors that modulate cell surface levels of wild-type RTKs under basal conditions are not fully known.
Studies of exogenous viral membrane protein folding have led to a model implicating glycan maturation as a key step in signaling receptor QC (3). This process begins with the binding of calnexin and calreticulin (CRT) to N-linked carbohydrates and proceeds with cycles of glucosylation and deglucosylation that are coupled to maturation and calnexin/CRT dissociation (4, 5). Thus, calnexin/CRT are candidates for control of RTK expression. In addition to ER luminal chaperones, RTK expression is also influenced by Hsp90, one of the most abundant cytosolic proteins. Inhibiting Hsp90 leads to degradation of RTKs through effects that involve autophosphorylation (6). However, Hsp90 also participates in ERAD of nonphosphorylated ER proteins including the cystic fibrosis transmembrane conductance regulator (CFTR) (7).
An additional important mechanism involved in control of RTK expression involves the movement of these proteins through the ER, a process dependent on the rate of folding, oligomerization, and binding and dissociation from both ER luminal and cytosolic chaperones. Here we have analyzed the spatiotemporal dynamics in the maturation and QC of the human insulin receptor (hIR), a prototypical RTK, to better understand stages in receptor expression that affect its function and delivery to the cell surface. Previous studies have established distinct stages in the maturation of the hIR, a major RTK involved in metabolism and energy balance. Receptor folding, glycosylation, and dimerization are posttranslational steps involved in the acquisition of the active binding site for insulin (8, 9). Previously, we exploited chemical cross-linking to identify the major molecular components associated with the nascent insulin receptor (IR) and the impact of N-linked glycosylation on IR biogenesis (10). We found that the immature receptor monomer is present in complexes comprising the glycan-specific chaperones calnexin and CRT in addition to BiP and that CRT was the predominant ER luminal chaperone associated with the newly translated receptor. Previous studies have also shown that Hsp90 interacts with the hIR on its cytosolic surface. However, the effect of Hsp90 and the possible involvement of kinase phosphorylation in receptor degradation remain controversial. Thus, to better define the roles of CRT and Hsp90 in ERAD of the hIR, we designed bioluminescent forms of both the native protein and a misfolded disease variant and investigated how interactions with luminal and cytosolic chaperones influence the steady-state expression of functional receptors.
Results
CRT, an ER Chaperone, Buffers Degradation of the IR.
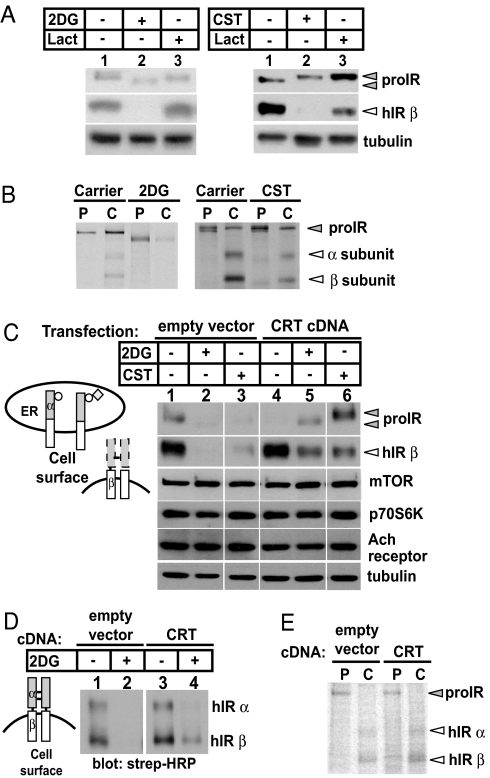
Expression of unliganded RTK proteins in mammalian cells varies under different physiologic conditions and is also linked to protein structural maturation. Regulation of hIR during its biogenesis can be monitored through a series of characteristic gel shifts that correspond with movement of its pro-form (220 kDa) from ER to trans Golgi, where it is cleaved into α and β subunits of 135 and 90 kDa, respectively (8). We and others have previously demonstrated that glucose deprivation and insulin resistance lead to reduced expression of the IR (10, 11). For example, after exposure of cells to 2-deoxyglucose (2DG), a nonmetabolizable glucose analogue that blocks the production of UDP-glucose, we observed a reduction in the amount of immature proIR and mature IR β (Fig. 1A Left, lane 2) and abnormalities in the gel migration of the proIR, consistent with impaired glycan processing. The magnitude of receptor degradation caused by 2DG was similar to the effects of inhibition of glycan modification with castanospermine (CST), an inhibitor of glucosidases I and II in the ER (Fig. 1A Right, lane 2). The decrease in steady-state levels of the receptor was due to proteasomal degradation because treatment with lactacystin, a potent proteasomal inhibitor, attenuated the reduction in hIR induced by 2DG. We also used pulse–chase labeling to determine whether the reduction in receptor levels was due to increased degradation. Fig. 1B shows that pretreatment with 2DG and CST decreased the stability and increased degradation of the receptor. Together, these observations indicated that impaired glycan maturation and/or reduced availability of intracellular UDP-glucose trigger receptor down-regulation.
Fig. 1.
ER chaperone CRT selectively attenuates ERAD of IR induced by altered N-linked glycosylation. (A) 293 cells stably expressing hIR were treated with 50 mM 2DG for 20 h (Left) or 1 mM CST for 72 h (Right) with or without 4.5 μM lactacystin (Lact). Cell lysates were processed as described previously and immunoblotted with anti-IR β and anti-tubulin. Closed and open triangles indicate proIR and hIR β subunits, respectively. (B) Cells were pretreated with 2DG or CST before performing pulse–chase analysis. Lysates from the pulse (P) and 6-h chase (C) were processed as described previously. (C) Cells were transfected with an empty vector or with CRT cDNA and treated with 2DG or CST and processed as above. Circles and diamonds indicate N-linked glycans and terminal glucose, respectively. (D) Cells stably expressing hIR were transfected with an empty vector or with CRT cDNA and treated with 2DG as above. Cell surface receptors were biotinylated and analyzed as described previously. (E) Pulse–chase was performed on cells transfected with an empty vector or with CRT cDNA. Lysates were harvested immediately after the pulse (P) and 6-h chase (C) and processed as described previously.
In previous studies, we identified hIR–CRT interactions as an important step linking glucose metabolism to receptor maturation (10). We therefore sought to determine whether changes in CRT levels affect expression of the hIR in cells grown under normal concentrations of glucose or after inhibition of glycolysis. We found that CRT overexpression overcame degradation of the hIR induced by either 2DG or CST (Fig. 1C, lanes 5 and 6). Interestingly, CRT did not alter basal expression of two signaling proteins downstream of the IR, mTOR and p70S6K (reviewed in ref. 12), consistent with its restricted role in maturation of proteins in the secretory pathway. Moreover, the effect of CRT on hIR was selective because expression of another transmembrane glycoprotein, the muscarinic acetylcholine (Ach) receptor, was unchanged under identical conditions. More importantly, under both basal conditions and after glycan misprocessing, CRT increased not only steady-state levels of the nascent hIR proreceptor and total processed β-subunit but also increased the cell surface expression of the mature receptor (Fig. 1D). In addition, pulse–chase experiments also showed that CRT overexpression increased the stability of mature α- and β-subunits of the hIR (Fig. 1E). These results indicate that CRT may function independently of glycan binding to stabilize the hIR. Interestingly, glycan-independent interactions of CRT have also been observed with IgY, citrate synthase, and malate dehydrogenase (13, 14).
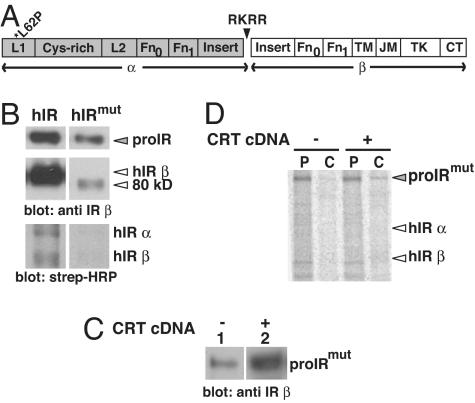
Second, we directly tested the effects of CRT on expression of a missense mutant variant of the receptor (hIRmut) (Fig. 2A) that we discovered in a young woman with classical type A insulin resistance (15). We previously reported that the hIRmut protein is present primarily as an immature precursor (proIR) that is converted to an 80-kDa species that is rapidly degraded and unable to reach the cell surface (Fig. 2B). When we examined processing of the hIRmut variant, we found that glycan maturation was altered and interactions with CRT were prolonged (10). However, the effect of CRT on maturation and homeostasis of the mutant receptor was not previously investigated. Here, we show that overexpression of CRT increased the steady-state levels of hIRmut (Fig. 2C) and stabilized the proIRmut (Fig. 2D). Nonetheless, CRT had no effect on cell surface expression of hIRmut (data not shown). Taken together, our results suggest that CRT buffers the expression of the native wild-type protein and has the capacity to attenuate degradation when glucose metabolism is abrogated. However, severe structural disruption caused by human mutations in the hIR gene could not be overcome by CRT overexpression.
Fig. 2.
CRT abrogates ERAD of IR from subject with congenital type A insulin resistance. (A) The Leu→Pro mutation at aa62 (*L62P) is in the first leucine-rich repeat domain (L1) of the IR. Protein domains in the IR include: leucine-rich repeat domains (L1 and L2), Cys-rich region, fibronectin type III domains (Fn0, Fn1, Fn2) and Fn1 insert, transmembrane (TM), juxtamembrane (JM), and tyrosine kinase (TK) domains, and carboxyl-terminal tail (CT). Furin recognition at the RKRR site cleaves the polypeptide into α and β subunits. (B) 293 cells were transfected with wild-type hIR or hIRmut cDNA. Cell surface receptors were biotinylated and processed as described previously. (C) Cells were transfected with hIRmut cDNA alone or with CRT cDNA and processed for Western blotting or for pulse–chase analysis (D), as described previously. P, pulse; C, chase.
Cytoplasmic Hsp90 Stabilizes the Nascent IR.
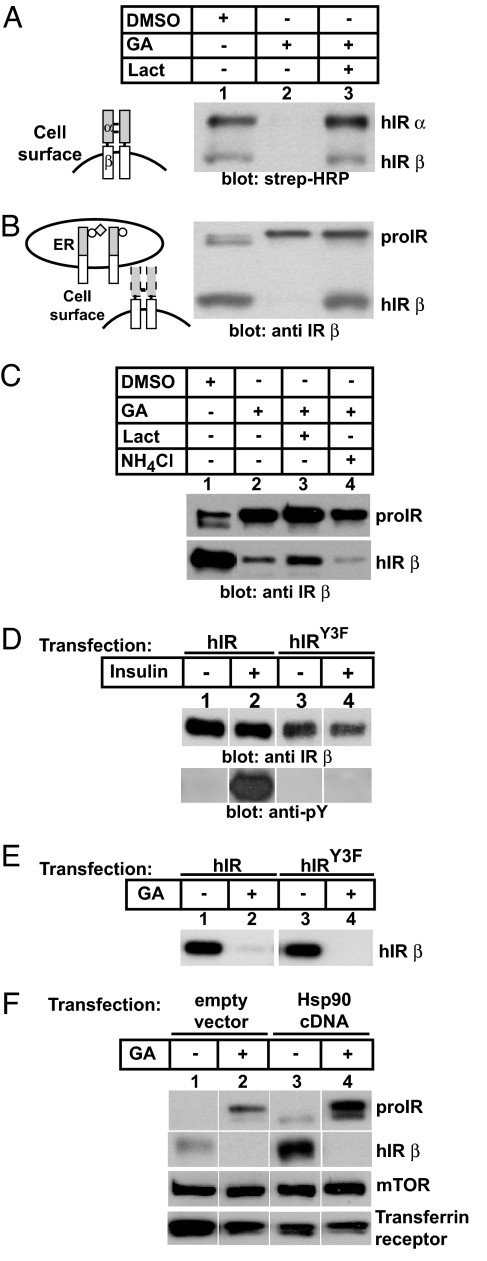
In addition to binding to CRT within the luminal surface of the ER, the transmembrane IR kinase is positioned in the cytoplasm where it interacts with cytosolic Hsp90. Because the effects of Hsp90 and its mechanism of action in controlling RTK expression have not yet been fully elucidated, we next examined how the cytosolic chaperone Hsp90 might affect levels of wild-type receptors. We took advantage of the ansamycin geldanamycin (GA), an Hsp90 inhibitor, to delineate the impact of cytoplasmic Hsp90 on receptor maturation, because GA has been previously shown to exhibit 3-fold higher affinity for cytoplasmic Hsp90 than for ER luminal Grp94 (16), and association of hIR with Grp94 was not observed by coimmunoprecipitation (10). In contrast to our studies with glycan inhibition, we found that inhibitors of Hsp90 led to complete degradation of the fully processed cell surface receptor and an increase in immature proIR (Fig. 3 A and B, lanes 1 and 2). Receptor degradation after inhibition of Hsp90 was blocked by lactacystin, a potent proteasomal inhibitor (Fig. 3 A and B, lane 3). Furthermore, lysosomal function was not required for ansamycin-mediated hIR degradation because addition of a lysosomal inhibitor, ammonium chloride, did not abrogate degradation induced by GA (Fig. 3C, lane 4). Because previous studies had demonstrated a role for the kinase domain in degradation of the homologous RTK, ErbB2 (16), we tested the effect of GA on a kinase-dead IR variant (hIRY3F) (Fig. 3D). Surprisingly, the kinase-dead IR variant was still degraded in the presence of GA (Fig. 3E), indicating that Hsp90 interactions involve the nonphosphorylated receptor. We also found that overexpression of Hsp90 led to increased levels of the mature β subunits of hIR (Fig. 3F, lane 3), whereas inhibition of Hsp90 with GA caused the accumulation of the immature species (Fig. 3F, lanes 2 and 4). We conclude that Hsp90 function is important in the conversion of immature proIR to its mature α/β subunits. These studies also reveal that Hsp90 selectively affects hIR levels because the downstream levels of mTOR, and the unrelated transferrin receptor, were not altered under identical conditions (Fig. 3F).
Fig. 3.
Kinase-independent ansamycin degradation of the hIR is attenuated by Hsp90. (A) 293 cells expressing wild-type hIR were treated with either carrier, 4.5 μM GA, or both GA and 9.5 μM lactacystin (Lact) for 20 h. Cell surface receptors were biotinylated and processed as described previously. (B) Blot in A was stripped and reprobed with anti-IR β. Circles and diamonds indicate N-linked glycans and terminal glucose, respectively. (C) 293 cells were treated with GA and either lactacystin or ammonium chloride (25 mM) for 20 h and lysates were processed as described previously. (D) 293 cells were transfected with either wild-type hIR or hIRY3F cDNA, serum-deprived for 24 h before treatment with 10−7 M insulin for 5 min. Cell lysates were immunoprecipitated with anti-IR α (8314) and processed for Western blotting with anti-IR β (Upper) and anti-phosphotyrosine antibodies (Lower). (E) Cells were transfected with either wild-type hIR or hIRY3F cDNA and treated with either carrier (0.5% DMSO) or 4.5 μM GA for 20 h. Cell lysates were processed as described previously. (F) 293 cells stably expressing wild-type hIR were transfected with an empty expression vector or Hsp90 cDNA and treated with either DMSO or GA and processed as described previously.
Nonoverlapping Function of CRT and Hsp90 in hIR QC.
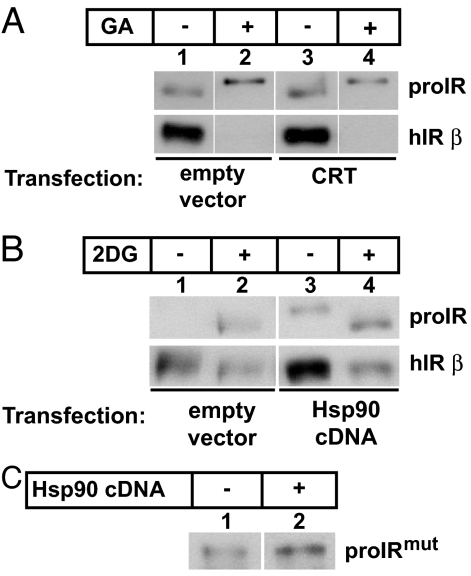
To test whether the effects of CRT and Hsp90 on hIR expression were functionally overlapping or distinct, we tested the reciprocal effects of each chaperone in the presence of either glycolytic inhibition (2DG) or Hsp90 blockade (GA). Lane 3 in Fig. 4A shows that CRT increased the basal level of hIR expression in cells grown in standard medium and after 2DG treatment (Fig. 1C) but did not stabilize degradation induced by GA (Fig. 4A, lane 4). Conversely, overexpression of cytosolic Hsp90 enhanced basal levels of wild-type hIR expression (Fig. 4B, lane 3, and Fig. 3F) but did not attenuate degradation of hIR induced by glycolytic inhibition with 2DG (Fig. 4B, lane 4). Interestingly, we found that CRT had a more potent effect on stabilizing the disease-causing mutant than Hsp90 (compare Fig. 4C with Fig. 2C). Together, these results indicate that the capacity of ER and cytoplasmic chaperones to attenuate degradation of a membrane-spanning protein are nonoverlapping and may be dependent on the location of the misfolded domain within the ER lumen or cytosol.
Fig. 4.
CRT and Hsp90 have independent roles in ERAD of IR. (A) 293 cells expressing wild-type hIR were transfected with an empty vector or with CRT cDNA and treated with carrier or 4.5 μM GA for 20 h. Cell lysates were processed as described previously. (B) Cells stably expressing wild-type hIR were transfected with an empty vector or with Hsp90 cDNA and treated with either carrier or 50 mM 2DG and lysates were processed as described previously. (C) Cells were transfected with hIRmut cDNA alone or with Hsp90 cDNA and lysates were processed as described previously.
Effect of Mutation in Luminal Domain on Diffusional Mobility Within the ER.
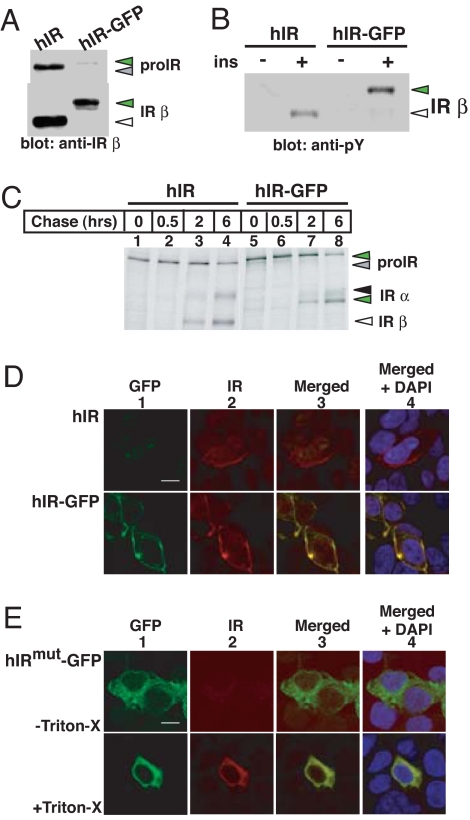
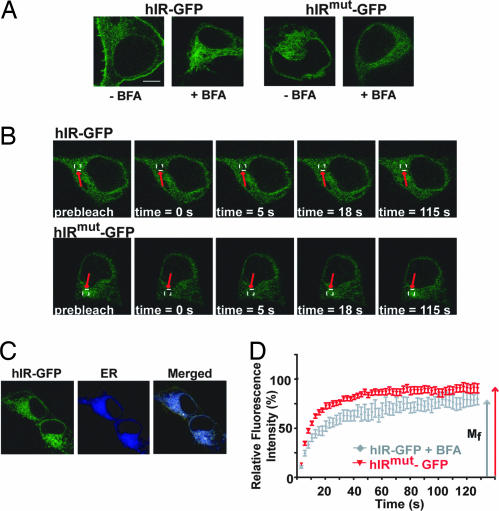
To extend our biochemical analyses of folding of wild-type and disease-associated IR, we generated wild-type and mutant IR-GFP chimeras and established live-cell imaging techniques to monitor the dynamics of this process. Fusion to GFP did not impair biogenesis (Fig. 5 A and C–E) nor signaling of the chimeric protein compared with wild-type receptors (Fig. 5B). Two strategies enabled us to restrict our analysis of hIR movement within the ER: first, we used brefeldin A (BFA) to block ER-Golgi transport, and second, we analyzed movement of misfolded hIRmut-GFP chimeras that remain trapped in the ER (Fig. 6A). We used fluorescence recovery after photobleaching (FRAP) to compare the kinetics of movement of the wild type with those of the ER-trapped hIRmut-GFP chimera. A region of the ER was rapidly bleached at 100% laser power to reduce fluorescence to 10–20% of its initial value, and subsequent fluorescence recovery was monitored by using an attenuated laser. Fluorescence recovery curves were generated as described (17–20), and the diffusion coefficient (D) and mobile fraction (Mf) were then calculated.
Fig. 5.
Characterization of bioluminescent hIR-GFP chimeras. (A) GFP was fused in-frame to the carboxyl terminus of the IR (hIR-GFP) as described in Materials and Methods. 293 cells were transfected with either hIR or hIR-GFP cDNA and processed as described previously. (B) 293 cells transfected with either hIR or hIR-GFP cDNA were serum-starved 24 h before incubation with 10−7 M insulin (ins) for 5 min and processed as described previously. Green triangles refer to IR-GFP fusion proteins. (C) 293 cells were transfected with either hIR or hIR-GFP cDNA and processed for pulse–chase analysis as described previously. (D) Cells expressing hIR or hIR-GFP were fixed, permeabilized, and incubated with mouse anti-IR α (8314) followed by Texas red donkey anti-mouse as the secondary antibody. GFP (green, panel 1) and Texas red (red, panel 2) fluorescence were visualized by using epifluorescence. Nuclei were stained with DAPI (blue). (Scale bar: 10 μm.) (E) Cells expressing hIRmut-GFP were fixed and kept intact (Upper) or permeabilized with Triton X-100 (Lower) and then processed as above.
Fig. 6.
Visualization of ER mobility of wild-type and mutant hIR by live-cell imaging. (A) Live 293 cells expressing hIR-GFP or hIRmut-GFP were incubated in media alone or in the presence of 5 μg/ml BFA at 37°C. Images were obtained at ×100 magnification and ×4 zoom. (Scale bar: 10 μm.) (B) Live 293 cells expressing hIR-GFP in the presence of BFA (Upper) or hIRmut-GFP (Lower) were kept at 37°C on a temperature-controlled stage by using a Zeiss LSM 510 laser confocal microscope. FRAP was performed on these cells as described in Materials and Methods. (C) The live cells were incubated with an ER-specific dye (ER Tracker Blue-White) for 15 min at 37°C before FRAP for targeted bleaching of the hIR-GFP within the ER. (D) The ratio between mean fluorescent intensity in the photobleached ER region and in a nonphotobleached region of the cell (relative fluorescent intensity) was plotted as a function of time to generate a fluorescence recovery curve, as described in Materials and Methods.
Fig. 6B shows a comparison of time-lapse images captured by FRAP of wild-type hIR-GFP in the presence of BFA and hIRmut-GFP. Studies of hIR-GFP monitored in BFA-treated cells, and untreated cells expressing hIRmut-GFP, revealed a typical ER distribution that was confirmed by colocalization by using an ER tracker dye (Fig. 6C). Quantitation of fluorescence recovery in the photobleached area showed that both wild-type and mutant hIR-GFP had similar mobile fractions within the ER; however, the diffusion coefficients were 2.3 and 3.4 × 10⁻¹⁰ cm2/s, respectively (Fig. 6D and Table 1). Our observations with FRAP analysis were further confirmed when we also performed studies using fluorescence loss in photobleaching (FLIP) [see supporting information (SI) Fig. 7]. Specifically, by continuously bleaching a focal region within the ER and then monitoring loss of fluorescence in adjacent, but distinct, regions of the cell, we detected equivalent disappearance of fluorescent signal in cells expressing either wild-type or the mutant ER-trapped variant. Interestingly, the misfolded receptor exhibited a significantly higher diffusion rate compared with that of the wild-type hIR (Table 1). However, in cells expressing the wild-type receptor, we did not observe a difference in diffusion rate after incubation with BFA. These results suggest that ER retention of the receptor is not sufficient to influence its rate of diffusion but rather, alterations of structure, folding, and oligomerization are necessary to impact diffusion. Interestingly, we also observed that augmenting chaperone expression significantly increased the diffusional mobility of wild-type receptor but only moderately increased the diffusional mobility of the misfolded variant. We conclude that CRT and Hsp90 influence the mobility of the native wild-type receptor to a greater extent than the nonnative misfolded mutant variant.
Table 1.
Diffusion coefficients (D) and mobile fractions (Mf) of hIR-GFP and hIRmut-GFP
| Treatment |
D (×10−10), cm2/s ± SE |
Mf, % ± SE |
||
|---|---|---|---|---|
| hIR-GFP | hIRmut-GFP | hIR-GFP | hIRmut-GFP | |
| −BFA | 2.35 ± 0.12 | 3.32 ± 0.17 | 69.7 ± 6.3 | 81.0 ± 2.9 |
| +BFA | 2.29 ± 0.20 | 3.38 ± 0.30* | 76.8 ± 4.1 | 82.3 ± 4.4 |
| +CRT | 3.57 ± 0.26†‡ | 3.79 ± 0.23§ | 84.0 ± 2.2† | 81.2 ± 3.9 |
| +Hps90 | 3.55 ± 0.29†‡ | 3.60 ± 0.37‡ | 86.0 ± 3.6† | 78.0 ± 4.9 |
*P < 0.05 compared with hIR-GFP + BFA.
†In the presence of BFA; n = 11–22 individual cells per set of experiments.
‡P < 0.01 compared with hIR-GFP + BFA.
§P < 0.001 compared with hIR-GFP + BFA.
Discussion
Although cytosolic and luminal molecular chaperones have been implicated in ER QC, the present study provides several previously unrecognized findings that support a function for CRT and Hsp90 in the dynamics of QC during biogenesis of a transmembrane signaling receptor kinase in living cells. First, we demonstrate that CRT, a major ER luminal chaperone, augments cell surface expression of native wild-type proteins under basal metabolic conditions and attenuates degradation of a human mutant variant.
Second, our experiments clarify the mechanisms whereby Hsp90 influences cell surface expression of one subtype of RTKs. Although previous studies with EGFR and GA indicated a role for receptor autophosphorylation in Hsp90-mediated degradation (16), our analysis revealed that kinase-dead hIR remained susceptible to degradation (Fig. 3E). A related observation concerns the stage in hIR biogenesis during which cytosolic Hsp90 affects expression. Specifically, our results showed that Hsp90 promoted the conversion of immature hIR to mature proteolytically processed native protein (Fig. 3 A and F), indicating that Hsp90 affects not only the cell surface population of hIR but it may also facilitate movement of the immature receptor to post-ER compartments and promote the progression of the receptor through earlier stages of maturation. Indeed, previous studies with CFTR have shown that Hsp90 participates in the ER degradation of the Δ F508 CFTR mutant variant (21, 22), indicating an important and broad role for cytosolic Hsp90 in basal membrane protein biogenesis and QC.
A third aspect of our studies addressed temporal dynamics of hIR movement within the ER. Calculations from our fluorescence recovery studies showed a diffusion coefficient of ≈2.3–3.4 × 10⁻¹⁰ cm2/s for the hIR-GFP chimeras. Although previous studies have established similar diffusion coefficients for various forms of aquaporin2 (AQP2), a multispanning transmembrane protein (23), our results provide previously unrecognized evidence to show comparable diffusion rates for proteins with single-pass topology. Interestingly, we found that hIRmut had increased movement compared with wild-type hIR-GFP. In contrast, previous experiments with AQP2 and CFTR showed that missense mutant variants had mobilities equivalent to native proteins within the ER (23, 24). More recently, mutant Gas3/PMP22, a misfolded tetraspan component of myelin protein, was found to be less mobile than its wild-type counterpart (25), an effect attributed to differences in the Stokes' radius of the mutant protein oligomers. Additional studies support a relationship between diffusional mobility and the physical size of the transmembrane domain (18, 26). Given these observations, it is noteworthy that our previous biochemical studies have shown that hIRmut does not dimerize in the ER (15). We speculate that a reduced membrane-spanning radius and/or failure to engage in the proper maturation steps enhances the movement of the mutant monomer through the ER.
Fourth, our data further indicate a role for both CRT and Hsp90 in the temporal dynamics of hIR movement. CRT significantly increased the diffusion coefficient of the wild-type hIR-GFP, resulting in a rate of mobility similar to that of the misfolded hIRmut-GFP (Table 1). Recent analyses have shown that CRT itself is highly mobile within the ER (27) and may contribute to movement of its client proteins. Moreover, overexpression of BiP has been shown to increase the solubility of pα F and decrease its degradation (28). Thus, ER chaperones appear to generally promote protein mobility even after misfolding. However, it should be noted that effects of each chaperone may depend on the specific substrate because BiP overexpression was also shown to immobilize misfolded vesicular stomatitis virus glycoprotein (29).
Cytosolic chaperones have been shown to play a role in ER substrate mobility and our FRAP experiments showed that Hsp90 was also able to significantly increase mobility of the wild-type receptor (Table 1). Our genetic transfection experiments extend previous observations that inhibiting Hsp90 decreased CFTR mobility (24) and that Hsp90 maintains solubility of an aggregation-prone domain of CFTR (30). Overall, we propose that Hsp90 also plays a facilitative role in transmembrane protein movement within the ER.
Together, our studies reveal that CRT and Hsp90, chaperones found on opposite sides of the ER membrane, exert distinct roles on the stability and mobility of the hIR and ultimately its cell surface expression. Our observations raise the intriguing possibility that regulation of movement of transmembrane proteins within the ER may be substrate-specific and result from distinct interactions with ER luminal and cytosolic chaperones. Future studies elucidating the spatiotemporal steps in RTK biogenesis may improve our understanding of disease conditions, including diabetes and obesity, both of which are associated with dysregulation of IR homeostasis.
Materials and Methods
Miscellaneous.
Molecular biology reagents were purchased from Pierce (Rockford, IL), Cell Signaling (Danvers, MA), and Stressgen (Victoria, Canada). The mAb 83-14 was a gift from K. Siddle (University of Cambridge, Cambridge, U.K.). Purified bovine insulin was from Novo Nordisk (Bagsvaerd, Denmark). The Hsp90 cDNA was a gift of R. Morimoto (Northwestern University) and subcloned into pBK-CMV. The CRT cDNA was a gift of M. Michalak (University of Alberta, Edmonton, AB, Canada).
Mutagenesis of hIR Tyrosine Kinase Domain.
Site-directed mutagenesis of the hIR was conducted by using QuikChange (Stratagene, La Jolla, CA). Forward/reverse strand primers for hIRY3F were 5′-GACCAGAGACATCTTTGAAACGGATTTCTTCCGGAAAGG-3′/5′-CCTTTCCGGAAGAAACCGTTTCAAAGATCTCTCGCTC-3′ for mutagenesis of tyrosines in the catalytic triad of the hIR kinase domain at amino acid position 1158, 1162, and 1163 to phenylalanine (the mutated nucleotides are underlined).
Cloning of hIR-GFP.
The terminal region of the 3′ end of wild-type hIR from pSel-hIR was amplified with Pfu Turbo polymerase by using forward and reverse primers (5′-GACGGTACCAGATCTTGCGCATGTGCTGGCAATTC-3′/5′-CGAGG G G C CCGGAAGGATTGGACCGAGGCAAG-3′), to facilitate cloning hIR in-frame into the pEGFP-N2 vector (Clontech, Palo Alto, CA). The 355-bp PCR product was blunt ligated into pCR-BluntII-TOPO (Invitrogen, Carlsbad, CA). An EcoRI/ApaI fragment was then subcloned into the multiple cloning site of pEGFP-N2. An XbaI/EcoRI fragment of pSel-HIR was then subcloned into the NheI/EcoRI sites of pEGFP-N2. The entire hIR-GFP cDNA was sequenced at restriction junctions and across the entire coding region of the hIR.
Biotinylation, Immunoprecipitation, Gel Electrophoresis, and Immunoblotting.
Transient transfections were performed in 293 HEK cells by using Lipofectamine 2000 (Invitrogen) and grown in conditions as described previously. Biotinylation, cell lysis, immunoprecipitation, gel electrophoresis, and immunoblotting were performed as described (10). For studies of IR expression, total protein was measured (Bradford assay), and equivalent protein amounts were immunoprecipitated with anti-IR α antibody (8314) or loaded directly onto an SDS gel. Tubulin blotting was performed on all Western blots to confirm equivalent amounts of total loaded protein.
Metabolic Labeling.
293 cells were starved for 1 h by preincubation in Met/Cys-free DMEM containing 5% dialyzed FBS. Pulse labeling was then performed by addition of Met/Cys-free medium containing 200 μCi (1 Ci = 37 GBq)/ml of [35S]methionine and [35S]cysteine for 1 h and chased with cold media for up to 18 h. After each time point, cells were washed and equivalent amounts of lysates were immunoprecipitated with anti-IR α (8314) and processed as described previously.
Photobleaching and Live Cell Imaging.
293 HEK cells were seeded on 35-mm dishes with coverslip bottoms (MatTek, Ashland, MA) and transfected with the appropriate cDNA. After transfection, cells were either incubated with 5 μg/ml of BFA (Sigma, St. Louis, MO) for a minimum of 6 h, or dishes were directly mounted onto a Zeiss (Thornwood, NY) 510 confocal laser scanning microscope and maintained at 37°C for the duration of the experiment. The 488-nm and 405-nm lasers and 100× plan apo objective were used in imaging. An ER-specific dye, ER-Tracker-Blue-White (Invitrogen), was used to specifically label the ER before targeted photobleaching. A laser power of 2.5–5% transmission was used in image acquisition, and 100% transmission was used for photobleaching. For FRAP analysis, a single image was taken at fourth zoom power, and an area of ≈1 μm2 was bleached for 3 s (100 iterations), after which an image was collected every 2 s until fluorescence recovery had plateaued. Relative fluorescence intensity (RFI) and mobile fraction were determined as described (20). Because the photobleached region was a circular area, the diffusion coefficient was determined for two-dimensional recovery in spot photobleaching (17). Briefly, an RFI versus time curve was fit to the equation Ft = Ffinal[1− exp(−π Dt/ω2)], where ω2 is the bleached area and D is the effective diffusion coefficient. Prism software 4.0 (GraphPad, San Diego, CA) was used to determine the D value that allowed best fit with earlier time points and to perform one-way ANOVA to test for statistical significance.
Supplementary Material
Acknowledgments
We thank Aleks Stojanowicz and Soojin Kim for technical assistance, Rick Morimoto for helpful discussions, and Bill Russin and T. Leong Chew for microscope technical support. We acknowledge Mathias Rouard for originally identifying the proband with the L62P mutation in the hIR. This work was supported by the National Institutes of Health (1 R03 DK62056-01), Astellas (Deerfield, IL), and an International Fellowship from the American Association of University Women (AAUW) to R.R.R. We also acknowledge the generous support of the Lazarus Family Foundation and the Charles Walgreen Jr. Trust.
Abbreviations
- RTK
receptor tyrosine kinase
- ER
endoplasmic reticulum
- QC
quality control
- ERAD
ER-associated degradation
- CRT
calreticulin
- IR
insulin receptor
- hIR
human IR
- 2DG
2-deoxyglucose
- CST
castanospermine
- GA
geldanamycin
- BFA
brefeldin A
- FRAP
fluorescence recovery after photobleaching.
Footnotes
The authors declare no conflict of interest.
This article is a PNAS Direct Submission.
This article contains supporting information online at www.pnas.org/cgi/content/full/0701114104/DC1.
References
- 1.McCracken AA, Brodsky JL. Curr Top Microbiol Immunol. 2005;300:17–40. doi: 10.1007/3-540-28007-3_2. [DOI] [PubMed] [Google Scholar]
- 2.Meusser B, Hirsch C, Jarosch E, Sommer T. Nat Cell Biol. 2005;7:766–772. doi: 10.1038/ncb0805-766. [DOI] [PubMed] [Google Scholar]
- 3.Hammond C, Braakman I, Helenius A. Proc Natl Acad Sci USA. 1994;91:913–917. doi: 10.1073/pnas.91.3.913. [DOI] [PMC free article] [PubMed] [Google Scholar]
- 4.Parodi AJ. Annu Rev Biochem. 2000;69:69–93. doi: 10.1146/annurev.biochem.69.1.69. [DOI] [PubMed] [Google Scholar]
- 5.Molinari M, Eriksson KK, Calanca V, Galli C, Cresswell P, Michalak M, Helenius A. Mol Cell. 2004;13:125–135. doi: 10.1016/s1097-2765(03)00494-5. [DOI] [PubMed] [Google Scholar]
- 6.Cabrera N, Diaz-Rodriguez E, Becker E, Martin-Zanca D, Pandiella A. J Cell Biol. 1996;132:427–436. doi: 10.1083/jcb.132.3.427. [DOI] [PMC free article] [PubMed] [Google Scholar]
- 7.Loo MA, Jensen TJ, Cui L, Hou Y, Chang XB, Riordan JR. EMBO J. 1998;17:6879–6887. doi: 10.1093/emboj/17.23.6879. [DOI] [PMC free article] [PubMed] [Google Scholar]
- 8.Olson TS, Bamberger MJ, Lane MD. J Biol Chem. 1988;263:7342–7351. [PubMed] [Google Scholar]
- 9.Elleman TC, Frenkel MJ, Hoyne PA, McKern NM, Cosgrove L, Hewish DR, Jachno KM, Bentley JD, Sankovich SE, Ward CW. Biochem J. 2000;347:771–779. [PMC free article] [PubMed] [Google Scholar]
- 10.Bass J, Chiu G, Argon Y, Steiner DF. J Cell Biol. 1998;141:637–646. doi: 10.1083/jcb.141.3.637. [DOI] [PMC free article] [PubMed] [Google Scholar]
- 11.Hwang JB, Hernandez J, Leduc R, Frost SC. Biochim Biophys Acta. 2000;1499:74–84. doi: 10.1016/s0167-4889(00)00109-9. [DOI] [PubMed] [Google Scholar]
- 12.Wullschleger S, Loewith R, Hall MN. Cell. 2006;124:471–484. doi: 10.1016/j.cell.2006.01.016. [DOI] [PubMed] [Google Scholar]
- 13.Saito Y, Ihara Y, Leach MR, Cohen-Doyle MF, Williams DB. EMBO J. 1999;18:6718–6729. doi: 10.1093/emboj/18.23.6718. [DOI] [PMC free article] [PubMed] [Google Scholar]
- 14.Leach MR, Cohen-Doyle MF, Thomas DY, Williams DB. J Biol Chem. 2002;277:29686–29697. doi: 10.1074/jbc.M202405200. [DOI] [PubMed] [Google Scholar]
- 15.Bass J, Turck C, Rouard M, Steiner DF. Proc Natl Acad Sci USA. 2000;97:11905–11909. doi: 10.1073/pnas.97.22.11905. [DOI] [PMC free article] [PubMed] [Google Scholar]
- 16.Xu W, Mimnaugh E, Rosser MF, Nicchitta C, Marcu M, Yarden Y, Neckers L. J Biol Chem. 2001;276:3702–3708. doi: 10.1074/jbc.M006864200. [DOI] [PubMed] [Google Scholar]
- 17.Axelrod D, Koppel DE, Schlessinger J, Elson E, Webb WW. Biophys J. 1976;16:1055–1069. doi: 10.1016/S0006-3495(76)85755-4. [DOI] [PMC free article] [PubMed] [Google Scholar]
- 18.Lippincott-Schwartz J, Snapp E, Kenworthy A. Nat Rev Mol Cell Biol. 2001;2:444–456. doi: 10.1038/35073068. [DOI] [PubMed] [Google Scholar]
- 19.Ellenberg J, Siggia ED, Moreira JE, Smith CL, Presley JF, Worman HJ, Lippincott-Schwartz J. J Cell Biol. 1997;138:1193–1206. doi: 10.1083/jcb.138.6.1193. [DOI] [PMC free article] [PubMed] [Google Scholar]
- 20.Kim S, Nollen EA, Kitagawa K, Bindokas VP, Morimoto RI. Nat Cell Biol. 2002;4:826–831. doi: 10.1038/ncb863. [DOI] [PubMed] [Google Scholar]
- 21.Fuller W, Cuthbert AW. J Biol Chem. 2000;275:37462–37468. doi: 10.1074/jbc.M006278200. [DOI] [PubMed] [Google Scholar]
- 22.Wang X, Venable J, LaPointe P, Hutt DM, Koulov AV, Coppinger J, Gurkan C, Kellner W, Matteson J, Plutner H, et al. Cell. 2006;127:803–815. doi: 10.1016/j.cell.2006.09.043. [DOI] [PubMed] [Google Scholar]
- 23.Levin MH, Haggie PM, Vetrivel L, Verkman AS. J Biol Chem. 2001;276:21331–21336. doi: 10.1074/jbc.M101901200. [DOI] [PubMed] [Google Scholar]
- 24.Haggie PM, Stanton BA, Verkman AS. J Biol Chem. 2002;277:16419–16425. doi: 10.1074/jbc.M112361200. [DOI] [PubMed] [Google Scholar]
- 25.Fontanini A, Chies R, Snapp EL, Ferrarini M, Fabrizi GM, Brancolini C. J Biol Chem. 2005;280:2378–2387. doi: 10.1074/jbc.M405104200. [DOI] [PubMed] [Google Scholar]
- 26.Hughes BD, Pailthorpe BA, White LR, Sawyer WH. Biophys J. 1982;37:673–676. [PMC free article] [PubMed] [Google Scholar]
- 27.Snapp EL, Sharma A, Lippincott-Schwartz J, Hegde RS. Proc Natl Acad Sci USA. 2006;103:6536–6541. doi: 10.1073/pnas.0510657103. [DOI] [PMC free article] [PubMed] [Google Scholar]
- 28.Kabani M, Kelley SS, Morrow MW, Montgomery DL, Sivendran R, Rose MD, Gierasch LM, Brodsky JL. Mol Biol Cell. 2003;14:3437–3448. doi: 10.1091/mbc.E02-12-0847. [DOI] [PMC free article] [PubMed] [Google Scholar]
- 29.Nehls S, Snapp EL, Cole NB, Zaal KJ, Kenworthy AK, Roberts TH, Ellenberg J, Presley JF, Siggia E, Lippincott-Schwartz J. Nat Cell Biol. 2000;2:288–295. doi: 10.1038/35010558. [DOI] [PubMed] [Google Scholar]
- 30.Youker RT, Walsh P, Beilharz T, Lithgow T, Brodsky JL. Mol Biol Cell. 2004;15:4787–4797. doi: 10.1091/mbc.E04-07-0584. [DOI] [PMC free article] [PubMed] [Google Scholar]
Associated Data
This section collects any data citations, data availability statements, or supplementary materials included in this article.


