

Abstract
Aphids, which constitute one of the most important groups of agricultural pests, ingest nutrients from sieve tubes, the photoassimilate transport conduits in plants. Aphids are able to successfully puncture sieve tubes with their piercing mouthparts (stylets) and ingest phloem sap without eliciting the sieve tubes' normal occlusion response to injury. Occlusion mechanisms are calcium-triggered and may be prevented by chemical constituents in aphid saliva injected into sieve tubes before and during feeding. We recorded aphid feeding behavior with the electrical penetration graph (EPG) technique and then experimentally induced sieve tube plugging. Initiation of sieve tube occlusion caused a change in aphid behavior from phloem sap ingestion to secretion of watery saliva. Direct proof of “unplugging” properties of aphid saliva was provided by the effect of aphid saliva on forisomes. Forisomes are proteinaceous inclusions in sieve tubes of legumes that show calcium-regulated changes in conformation between a contracted state (below calcium threshold) that does not occlude the sieve tubes and a dispersed state (above calcium threshold) that occludes the sieve tubes. We demonstrated in vitro that aphid saliva induces dispersed forisomes to revert back to the nonplugging contracted state. Labeling Western-blotted saliva proteins with 45Ca2+ or ruthenium red inferred the presence of calcium-binding domains. These results demonstrate that aphid saliva has the ability to prevent sieve tube plugging by molecular interactions between salivary proteins and calcium. This provides aphids with access to a continuous flow of phloem sap and is a critical adaptation instrumental in the evolutionary success of aphids.
Keywords: calcium-binding, plant–aphid interaction, plugging, saliva proteins, sieve element
Aphids (Homoptera: Aphididae: Aphidinae) withdraw nutrients from sieve tubes, the photoassimilate-conducting channels of plants, using their stylet mouthparts and, by doing so, weaken the plant. An intriguing aspect of aphid feeding is that they apparently inactivate occlusion of the sieve tubes. This defense reaction in response to injury (1) prevents the loss of sieve-tube sap, which is pressed as a mass flow through the sieve tubes. The functional units of sieve tubes are sieve elements (SEs) that are elongated cells arranged end-to-end to form a continuous conduit; their abutting ends are modified as porous sieve plates to allow the flow of sap from one SE to the next. Because SEs are part of a continuous sap transport conduit, damage to a single SE would result in far more sap loss than simply the contents of a single cell; thus SE occlusion is a vital function for plants (2, 3).
Occlusion reactions have been documented extensively by confocal laser scanning microscopy [CLSM (4, 5)] and transmission electron microscopy [TEM (6)] for broad bean, Vicia faba. In response to injury in SEs of intact broad bean plants, spindle-like protein bodies (forisomes) disperse, and parietal proteins detach from the plasma membrane and SE reticulum (3), plugging the sieve plates (4), whereas callose deposition constricts the pores in the sieve plates from the apoplast side (7, 8). Protein meshworks inside SEs that collapse as a consequence of wounding are described for some dicotyledonous plants (6, 9) and water-soluble proteins, which become insoluble after wounding, thereby plugging the sieve plate, are postulated for Poaceae (10). Different combinations of these mechanisms can be observed in various plant families (11) with exception of forisomes that are restricted to the Fabaceae (12, 13). Regardless of plant species and family, usually sieve plates are immediately occluded in response to the slightest mechanical damage that is initiated by an increase in free calcium (4, 5, 10) in the SEs or by a change in the redox state (14, 15).
Impaling SEs with a fluid-filled microcapillary with a tip diameter of 1 μm, fixed in a microelectrode holder, induces the deposition of “plugs” on the sieve plates of V. faba (4). In contrast, insertion of aphid stylets with a similar tip diameter does not appear to trigger such a plugging reaction that would stop the mass flow in the affected SE.
The contrasting SE response between the microcapillary and aphid stylet raises the question of how aphids prevent the natural blocking of the sieve plates (5), which includes plugging by different types of proteins and constriction by callose (2, 3). Before the plasma membrane seals in response to impalement by a microcapillary tip, extracellular calcium presumably gets into the sieve tube lumen through the wound site, inducing sieve plate occlusion (4).
During stylet penetration, aphids secrete two types of saliva, one of which gels almost immediately after exiting the stylet tip and forms a continuous sheath around the stylet. This type of saliva is called sheath saliva, and it also seals the puncture site in the SE cell wall before and during the stylet tip piercing the SE plasma membrane (16). Thus, sheath saliva may reduce the influx of extracellular calcium into the SE lumen through the punctured site (10). Calcium influx into sieve tubes may also be brought about by drastic changes in SE turgor (5, 17). The sheath saliva sealing the puncture site presumably also reduces loss of phloem sap through the wound and in this way decreases a loss of turgor pressure as well (10).
Furthermore, the microcapillary has a large compressible volume that can contribute to a loss of turgor pressure when the microcapillary pierces the SE, whereas the two canals in aphid stylets (salivary and food canals) have a much smaller width and length (10). Moreover, the stylet canals are initially closed by the precibarial valve in the head region (18) during a SE puncture, further restricting the loss of turgor through the lumens of the stylet canals. All in all, there are good reasons to believe that the structure of aphid stylets and the secretion of sheath saliva mitigate physical factors that are normally responsible for a sudden rise in calcium concentration in the SE (18).
The second type of saliva secreted by aphids is called watery saliva because, unlike sheath saliva, it does not gel (19). When aphids penetrate a SE with their stylet tips, they start injecting watery saliva into the SE (20), and, if the penetration is successful, after a period of secretion of watery saliva, the aphid then begins ingesting sap from the SE. When feeding on resistant plants, the transition from salivation to ingestion often fails to occur or, if ingestion does occur, the aphid often reverts back to salivation after a brief ingestion period (21, 22).
Despite the likely effects of the stylet size and sheath saliva minimizing the influx of calcium into the SE lumen, as described (10), it seems likely that this would not be 100% effective and that aphids would possess additional capabilities of inhibiting sieve-plate occlusion. Indeed, it has frequently been hypothesized that the watery saliva interferes with the sieve plate occlusion mechanisms in response to penetration of the SE (16, 20, 23, 24). One way that watery saliva could interfere with sieve plate occlusion would be to bind calcium in the SE and thus prevent calcium from exceeding a threshold level (25) that would trigger SE occlusion. Forisomes, one of the main components of SE occlusion in broad bean as described (12, 13), are easy to extract and handle in vitro and are clearly visible under a light microscope (25). Prior knowledge about the mechanism of forisome-based SE plugging and the ability to manipulate forisomes make broad bean an ideal model plant to visualize whether aphid saliva suppresses a rise in free calcium inside pierced SEs and hence sieve plate occlusion by secretion of watery saliva.
Here, we verify this postulate in three successive experimental steps based on the (i) organismal, (ii) physiological, and (iii) biochemical interactions of the mechanisms involved. As the events associated with sieve tube plugging (physiological interaction) cannot be observed in vivo, we designed an experimental setup, where the components involved (aphid saliva and plugging proteins) were confronted with each other in vitro.
Results and Discussion
Cooling as well as electrical stimulation of the leaf tip of apparently nonexcitable plants such as maize, results in an electrical-potential wave (plant action potential) along the sieve tubes that is accompanied by a stoppage of mass flow of phloem sap (26). Similarly, burning of V. faba leaf tips results in remote dispersion of forisomes, followed by a stoppage of mass flow (45). The leaf tip damage generates an electrical-potential wave along the sieve tube and is accompanied by calcium influx into SEs, which is presumably the cause of the observed forisome dispersion. The dispersion of the forisomes is reversed ≈10 min after burning. Thus, burning the leaf tips of V. faba can be used to observe how aphids react to induced SE plugging.
For this reason, aphid feeding behavior was monitored by use of electrical penetration graph (EPG) technique. Distinct stages of stylet penetration and feeding by aphids have been correlated with distinct electrical waveforms in the EPG output; therefore, the different stages of feeding can be monitored and recorded in real time with electrical penetration graphs (16, 20, 23, 27–29). Two stages of aphid feeding behavior that can be detected with EPGs and are critical to this study are: secretion of watery saliva into a SE (represented by waveform E1) and ingestion of sap from a SE (represented by waveform E2) (20).
Burning-induced forisome plugging of sieve plates affects aphid (Megoura viciae) feeding behavior (overview Fig. 1a). Shortly after the electrical-potential (45) wave had passed the SE where the aphid was feeding, the aphid's behavior changed from phloem sap ingestion (waveform E2, Fig. 1b) to SE salivation (waveform E1) (Fig. 1c). This suggests that the aphid reacts by secreting watery saliva in the SE lumen to unplug the SE. After ≈8.3 min, following a diffuse waveform intermediate in shape between E2 and E1 (Fig. 1d), the E2 ingestion activity was resumed (Fig. 1e), indicating a restoration of mass flow inside the sieve tube. Ten of 12 aphids showed this change of behavior after leaf tip burning in contrast to controls with no leaf tip burning, where 0 of 12 aphids showed this change (P < 0.001; χ2 test of Fisher's exact test). Based on the time lag between leaf tip burning and the transition from E2 to E1, the electrical-potential wave propagated through the sieve tube was estimated to have a mean velocity of 0.36 cm/sec (n = 10). The standard deviation of 0.25 cm/sec and the median of 0.27 cm/sec reflect a broad range of conductance velocities, possibly because of different levels of burning stimulation. The signal inside the SE that is induced by the electrical-potential wave and leads to the change in aphid behavior is unknown as yet but is likely to depend on a release of calcium into the SE lumen.
Fig. 1.

EPG recordings from sieve tube-related activities of the aphid M. viciae before, during, and after leaf heat shock in V. faba. (a) An overview trace of 1 hour, showing changes in the aphid's activities. (b–e) Four details of 10-sec duration at four different time intervals (time axis arrows b, c, d, and e in a). Auto power spectra present the waveform frequency (Hz) vs. the relative magnitude with a maximum of 1, which provide a major characteristic of waveform identity. Waveform E2 (b) represents ingestion of phloem sap accompanied by rhythmic secretion of small amounts of watery saliva that is ingested together with SE sap through the food canal; the watery saliva secreted during E2 is sucked up along with the sap and is believed to prevent clogging of the proteinaceous food components in the food canal (16, 23, 27, 28). Approximately 16 sec after heat shock is applied to the leaf tip (H in a) 6 cm from the feeding site, waveform E2 changes abruptly to E1 waveform, representing watery salivation into the SE lumen (20, 29) (c). Approximately 414 sec later, waveform E1 changes into a diffuse waveform (d), which may represent an irregular mixture of E1/E2 waveforms. Approximately 8.3 min after the heat shock, the aphid resumed its original feeding behavior (E2; e).
To elucidate the interaction between aphid saliva and forisomes, microscopic observations would be highly desirable. However, direct observations of this interaction in intact plants are hard to achieve. Aphids cannot be trained to puncture a specific SE that the confocal laser scanning microscope (CLSM) has in focus. Furthermore, CLSM observations of events in the sieve tube require cutting a small observation window in the leaf cortex that has to be kept moist. This makes the leaf site inaccessible to an aphid. Therefore, we decided to use an in vitro method to study the interactions between saliva of the aphid (M. viciae) and broad bean (V. faba) forisomes.
The calcium chelator EDTA reverses the calcium-dependent dispersion of forisomes in vivo and in vitro (5, 25). Likewise, saliva might induce a forisome reaction similar to that of EDTA, provided that the saliva contains calcium-binding compounds. To determine whether aphid saliva elicits a similar response of forisomes, salivary proteins of aphids were collected in Parafilm-covered diet chambers and afterward were concentrated by centrifugal filtration. There are a number of reasons to assume that these proteins emanated mainly from watery saliva rather than sheath saliva. (i) After feeding on the diet, gelled sheath saliva remains intact and is attached to the lower side of the Parafilm that covered the collection chamber. (ii) During 20-hour EPG recordings on diet, the frequency and duration of E1 waveforms, characteristic of watery salivation, was found significantly higher than on plants (T.W. and A.J.E.v.B., unpublished data) indicating that a considerable amount of watery saliva was secreted into the diet. (iii) Protein patterns correspondent to watery saliva in SDS/PAGE gels showed little overlap with gelling sheath saliva protein patterns (K. Steckbauer, T.W., and A.J.E.v.B., unpublished data). Therefore, contamination of watery saliva extracts with proteins of gelling sheath saliva is expected to be minimal.
Freshly isolated forisomes (Fig. 2a) readily dispersed in response to 1 mM CaCl2 (Fig. 2 b, d, and f) and contracted in 2 mM EDTA (Fig. 2 c and e). Just as for EDTA treatment, forisomes contracted upon application of concentrated saliva (Fig. 2g).
Fig. 2.

Reaction of an isolated forisome from V. faba sieve-tube to Ca2+, EDTA (a Ca2+ chelator), and watery saliva concentrate. (a) An isolated forisome in 10 μl of 2 mM EDTA extraction medium (25). (b) After application of 4 μl of 1 mM CaCl2, the forisome disperses and contracts again (c) after supplying 2 μl of 2 mM EDTA. (d and e) Repetition of this treatment has the same effect. (f) After the third application of 2 μl of 1 mM Ca2+, the forisome disperses again. (g) Subsequent application of 4 μl of saliva concentrate from M. viciae (from 6,750 aphids) leads to a contraction of the forisome comparable to that in response to addition of EDTA (c and e).
The watery aphid saliva appears to act as a calcium scavenger that sabotages the plugging of sieve plates by reducing the availability of calcium that would normally trigger the dispersion of the forisomes. Direct interaction of salivary proteins with isolated forisomes does not appear to be involved, because abundant application of CaCl2 after saliva-induced contraction of the forisome led to normal dispersion (data not shown). The presence of a nonprotein chelator comparable in function to EDTA is also unlikely in view of the protein concentration procedure, which results in the loss of low molecular compounds through the molecular weight cut-off filter of 3 kDa. Furthermore, we tested the effect of digested salivary protein solution after protease K treatment whereupon saliva no longer influenced the forisome status (data not shown).
Concentrated aphid saliva from M. viciae contained several proteins (Fig. 3a). Twenty-nine proteins, in a weight range from ≈20 kDa to a cluster at 159/164/173 kDa and higher (beyond the marker reach), could be identified with 1D SDS/PAGE separation and silver staining. The number of proteins exceeds by far that reported before (30–32), which we attribute to the higher concentration of the saliva samples collected here.
Fig. 3.

SDS/PAGE of the watery saliva of M. viciae and labeling of calcium-binding proteins with radioactive 45Ca2+ or by staining with ruthenium red on a Western blot nitrocellulose membrane. (a) Saliva concentrate of 1,000 aphids separated on a 10% gel (lane 1). Lane 2 presents marker proteins (kDa; Precision Plus Protein All Blue Standards; Bio-Rad, Hercules, CA). The silver-stained protein bands are marked and numbered by use of Quantity One 1-D Analysis Software (Bio-Rad). (b) Saliva collected from 41,000 aphids and separated on 10% SDS/PAGE and blotted on a nitrocellulose membrane. Lane 1 shows an overview of the separated proteins stained with Ponceau S, whereas the left lane presents marker proteins. In lane 2, after destaining the membrane, calcium-binding proteins are labeled with radioactive 45Ca2+, and radiolabeled proteins are detected by a PhosphorImager. (c) Lane 1 shows an overview of all separated proteins stained with Ponceau S, whereas the left lane presents marker proteins. In lane 2, after destaining the membrane, calcium-binding proteins are identified by ruthenium red staining.
Proteins that bind calcium were detected with radiolabeled calcium and with ruthenium red, which interacts with calcium-binding proteins. Adding [45Ca]Cl2 (33) to watery saliva proteins blotted on a nitrocellulose membrane resulted in a high number of radiolabeled proteins (Fig. 3b). The same proteins were stained on a nitrocellulose membrane by using ruthenium red (34) (Fig. 3c). The importance of calcium binding in aphid–plant interaction on the SE level is reflected by the high number of proteins that gave positive results for calcium binding with both techniques. The proteins 6–9, 16, 26, and 27 (Fig. 3a) were stained/radiolabeled with a high intensity, which suggests a major role of these proteins in the described aphid–plant interaction.
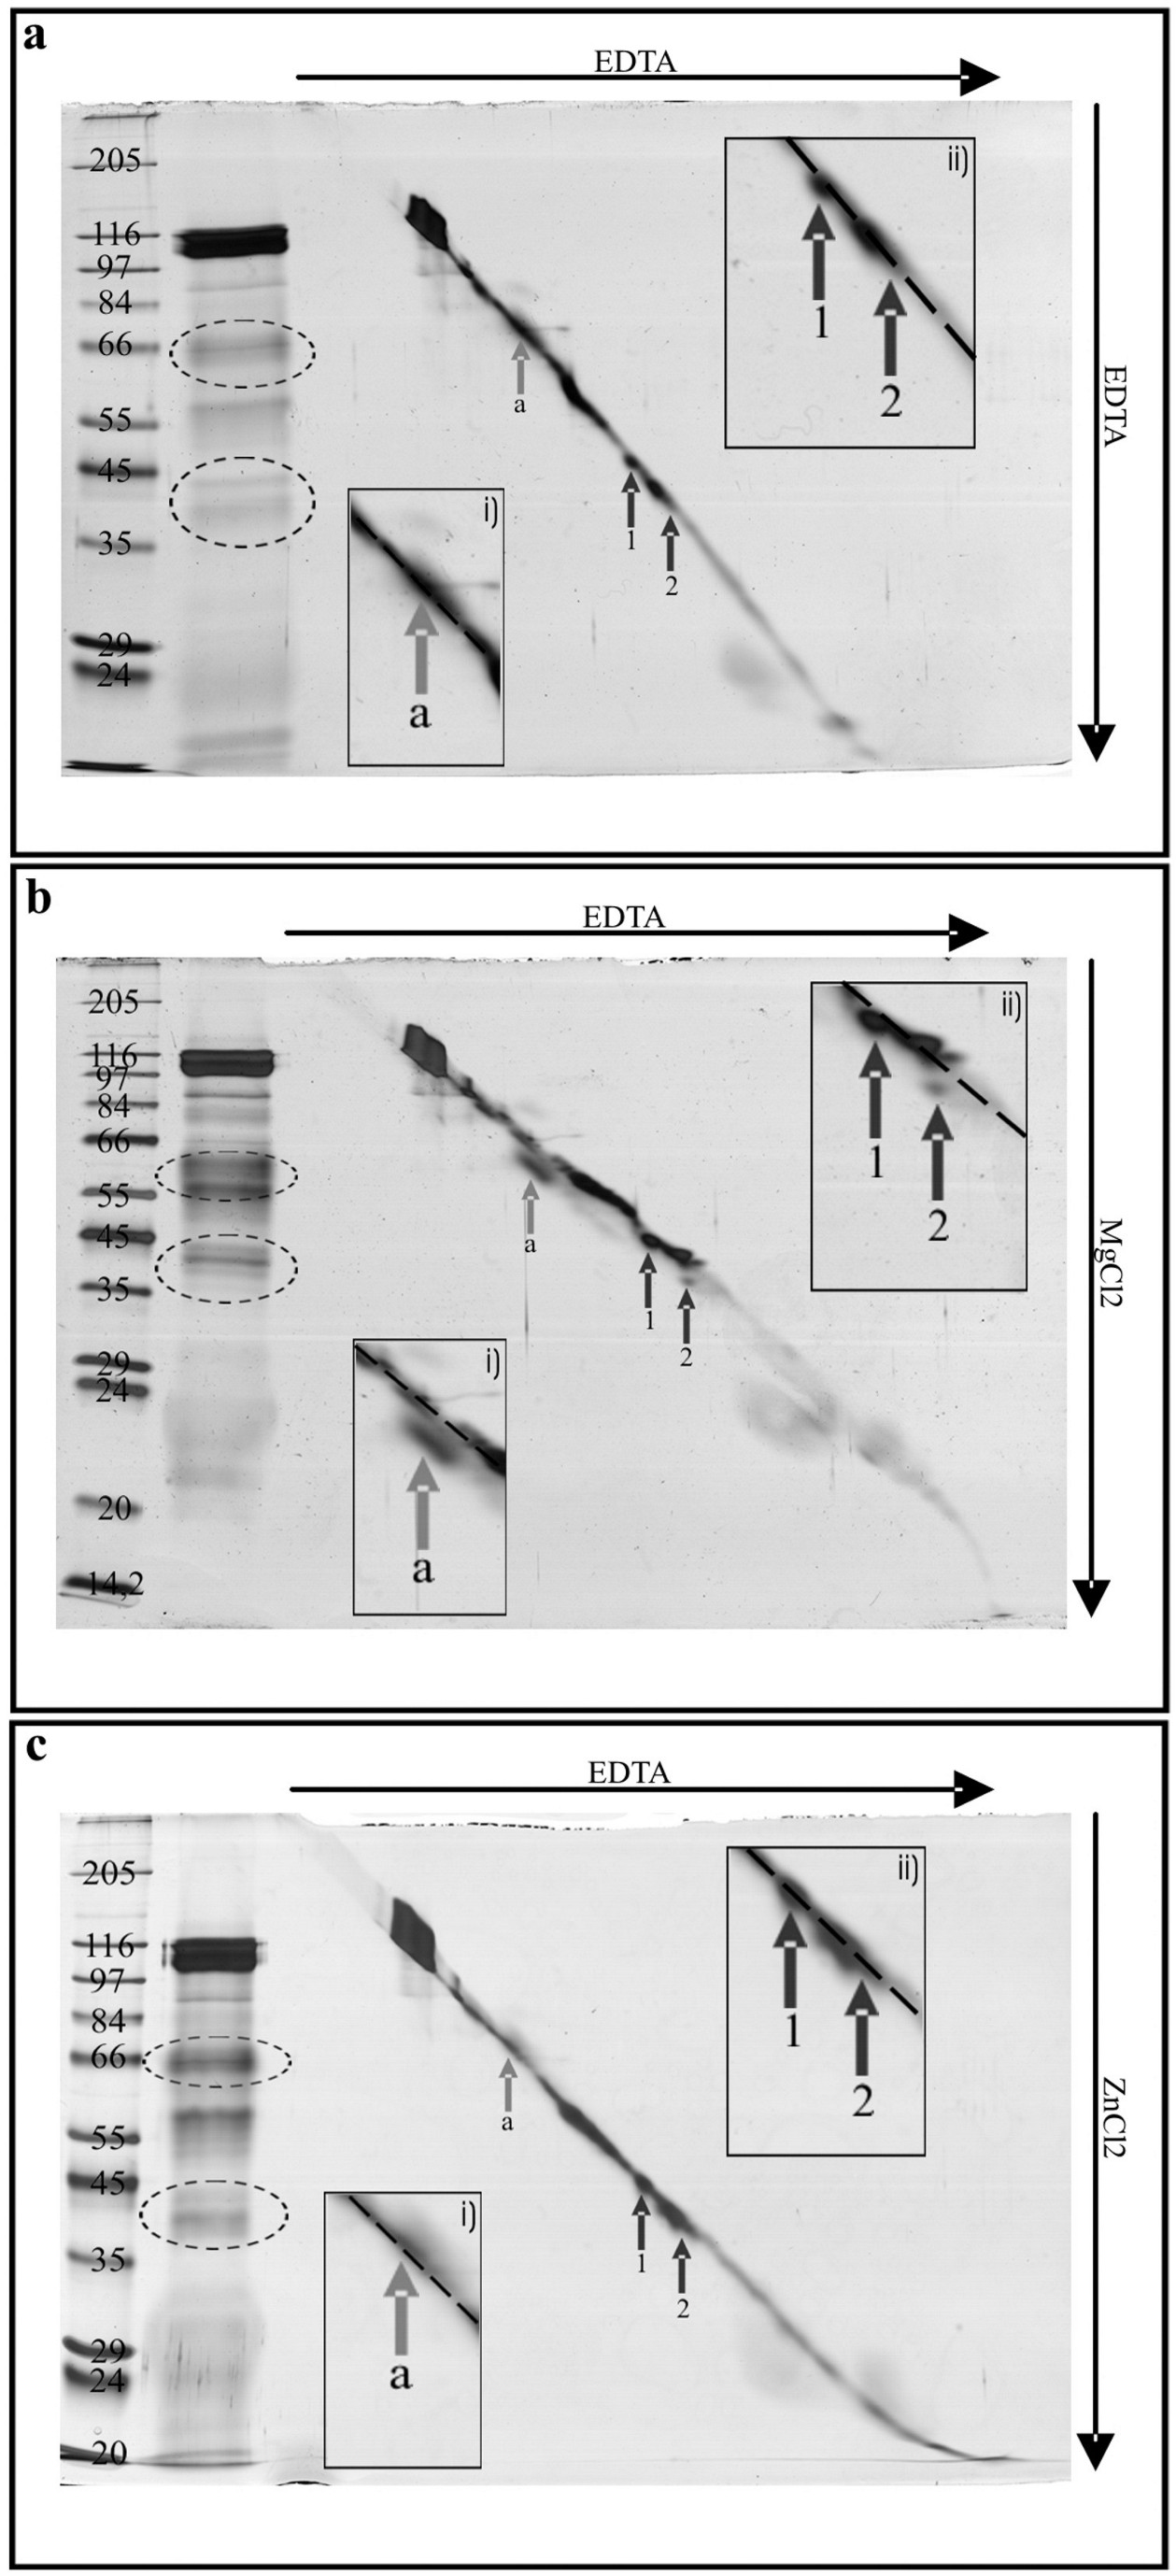
Two-dimensional SDS/PAGE according to Kameshita and Fujisawa (35), was then used to corroborate the conclusion that some of the salivary proteins bind calcium and, in doing so, undergo conformation changes and to determine whether the proteins bound other divalent cations. The 2D SDS/PAGE demonstrated that the 40- and 43-kDa proteins (22 and 20) (Fig. 3a) shifted downwards in reaction to free calcium in the second-dimension gel (Fig. 4b), whereas no shift occurred in the presence of EDTA in both dimensions (Fig. 4a). This is indicative of a calcium-induced conformation change of these proteins. To test potential binding of other divalent cations, MgCl2 and ZnCl2 were also applied to the second dimension in the 2D SDS/PAGE [see supporting information (SI) Fig. 5]. The 40-kDa protein appears to have binding capacity for Mg2+ in addition to Ca2+, whereas the 43-kDa protein displays only calcium binding. The importance of the 40-kDa protein for calcium binding may therefore be limited, given the high magnesium concentrations inside the SEs (36, 37), which would potentially block binding sites for calcium. SI Table 1 summarizes calcium-binding and calcium-reacting proteins detected with the methods used.
Fig. 4.

Two-dimensional SDS/PAGE of watery saliva of M. viciae in 10% separation gels. Saliva concentrate from 3,000 aphids is separated in two dimensions by common SDS/PAGE (no isoelectric focusing in the first dimension, as usual). The lane that contains saliva concentrate and diagonal marker is excised from first-dimension gel and placed perpendicularly to the running direction onto a second gel. Gel a contains EDTA in first and second dimension, whereas gel b contains EDTA in the first and CaCl2 in the second dimension. Proteins 43 kDa (1) and 40 kDa (2), indicated by arrows, shift downwards in the presence of Ca2+. In insets of the zoomed region of interest, the dotted line shows the position of the diagonal marker. Proteins are silver stained. The gel lane on the far left of each figure presents standard weight markers (Marker-Wide molecular weight range; Sigma–Aldrich; left lane, gel a, kDa) for the second-dimension separation. Next to the lane with the markers is a 1D lane of watery saliva proteins (1,000 aphids).
The level of labeling of most salivary proteins was low in calcium-binding assays (Fig. 3 and SI Table 1). An acidic isoelectric point of each of these proteins that would confer unspecific cation binding under the prevalent experimental conditions (34) would provide an explanation for this weak calcium-binding capacity. A less plausible assumption is that several proteins such as, e.g., phenoloxidase and peroxidase (32) may have calcium-binding sites in addition to their main enzyme function. The molecular mode of interaction between Ca2+ ions and watery saliva proteins that prevent sieve plate blocking is not yet clear. In the light of their apparent folding in the presence of Ca2+, the 40- and 43-kDa proteins may possess an EF hand motif as occurs in, e.g., calmodulin, an important signaling protein. Given the calcium-dependence of numerous signaling proteins, our results allow speculation about a possible effect of aphid salivary proteins interacting with plant signaling pathways located in SEs.
Beyond suppression of SE occlusion, the calcium-binding components of watery saliva may also prevent clogging of SE proteins in the food canal of the stylets during phloem sap ingestion (16). After stylectomy (stylet amputation) during phloem sap ingestion, the phloem sap exudes from the stylet stump presumably because of the high turgor pressure in the sieve tubes of V. faba. However, after a period, exudation stops, and it has been suggested that, because stylectomy severs the connection between the salivary glands and the stylets, coagulation of phloem proteins is no longer inhibited. In the absence of saliva, coagulation could then occur in the SEs or in the food canal. Coagulated protein blocking the food canal has been observed in severed stylets (16), and, consequently, watery saliva may be just as important in preventing coagulation in the food canal as it is in preventing coagulation in the SE. Calcium binding by aphid saliva as a universal tool of plugging sabotage in plant–aphid combinations seems plausible, but hard to prove in a direct manner. Unlike forisomes, other proteins involved in SE plugging are more dispersed or even diluted in the phloem sap of other plant families (16). They will probably coagulate because of extraction procedures, high ambient oxygen concentrations (38), or a change of the SE redox potential (14, 15).
In contrast to the forisomes of the Fabaceae, it will be difficult to carry out similar visual tests on these other types of phloem-plugging proteins. A change from E2 ingestion to E1 salivation in response to distant damage appears to be an attempt to suppress sieve-plate plugging by calcium-binding proteins. Therefore, E1 waveform occurrence in general may be regarded as a crucial activity to prevent SE occlusion.
In all aphid–plant combinations studied so far, E1 waveforms have been observed to precede E2 waveforms without exception (20). Moreover, we found E1 responses to leaf-tip heat shocks by Myzus persicae on Brassica napus and by Schizaphis graminum on Hordeum vulgare (T.W., S. Räisänen, S. R. Kornemann, A. C. U. Furch, and A.J.E.v.B., unpublished data). It is likely that similar calcium-binding salivary proteins also occur in other aphid–plant combinations as shown here for M. viciae and V. faba. The Ca2+-binding capacity of aphid saliva may play a role in the compatibility between aphids and plants (18). The success of the salivation essentially depends on the competitiveness between the Ca2+-binding capacities of saliva and SE proteins. Therefore, successful aphid colonization is expected to be prevented in any plant–aphid combination in which the Ca2+-binding by SE proteins surpass that of the aphid saliva. Other mechanisms of controlling SE occlusion [e.g., redox regulation, which induces, e.g., P protein polymerization in Cucurbita pepo (15)] should not be neglected in future studies on aphid–SE-protein interactions. Detailed experiments are needed in other systems to determine how universal the role of calcium binding is in aphid–SE-protein interactions.
Materials and Methods
Aphid and Plant Cultivation.
M. viciae was reared on 14- to 20-day-old plants of V. faba L. cv. Witkiem major (Nunhem Zaden, Haelen, The Netherlands) in a controlled-environment room at 25°C and a 17/7-h light/darkness regime in Perspex cages with large gauze-covered windows.
V. faba plants used in leaf-tip burning experiments were grown in a greenhouse under 20°C with natural lighting plus additional lamp light (SONT Agro 400W; Phillips, Eindhoven, The Netherlands) with a 14/10-h light/dark period and used at the age of 20–25 days, having three to four true leaves. V. faba plants used for forisome isolation were cultured in a controlled-environment room at 20°C and a 14/10 h light/dark period and were used from 5 until 7 weeks after germination.
EPG Recording and Long-Distance Signaling in Plants.
Randomly picked apterous adult aphids (M. viciae) were placed on the petiole base of a mature leaf of V. faba, ≈6 cm from the leaf tip. After aphids showed ingestion from a sieve tube, recognized by the E2 waveform (20), careful burning of the leaf tip (an area of maximum 1 cm2) for 3 seconds was used to trigger phloem-mediated electrical long-distance signals that induce sieve-plate occlusion (45).
Plant penetration behavior of the aphid was monitored by application of the dc EPG technique, and waveforms were displayed and recorded by using Giga hardware and PROBE software (both from Wageningen Agricultural University, Wageningen, The Netherlands) (30, 32, 39, 40). A gold wire electrode (2 cm long and 20 μm in diameter) was attached to the dorsum of each aphid by using electrically conductive silver glue (Electrolube, Swadlincote, U.K.), and the electrode was connected to the input of an EPG amplifier. The plant electrode was inserted in the soil of the potted plant. EPG waveforms were retrieved by using EPG signal analysis software (PROBE analysis module). In leaf-tip burning, as well as in the control experiments, 12 replicates were executed, each with fresh aphids and plants.
Statistical Analysis of EPG Data.
Data from each aphid were scored as “1” if it changed from E2 to E1 and scored as “0” if it remained in E2 during 10 minutes after leaf-tip burning. Statistical analysis was done with the χ2 test of Fisher's exact test and the software SigmaStat 3.0 (SPSS, Chicago, IL).
Aphid Saliva Collection and Saliva Concentration.
Aphids of M. viciae were collected by gently beating the infested plants, resulting in many aphids, mostly adults, falling from the plant. Aphids were weighed to calculate their number (the weight of an adult aphid was ≈1 mg) and ≈1,500–2,000 aphids were poured onto the Parafilm cover of each saliva-collection chamber. This custom-made device is made up of a Perspex block in which a shallow bath of 9-cm radius and a depth of 1 mm had been milled. The bath contained an artificial aphid diet composed of 100 mM serine, 100 mM methionine, 100 mM aspartic acid, and 15% sucrose [modified from Cherqui and Tjallingii (31)], pH 7.2 (KOH). The diet was filtered through a PVDF syringe membrane with a pore diameter of 0.45 μm (Rotilabo; Carl-Roth, Karlsruhe, Germany) under sterile conditions. Sterilized collection chambers were filled with 3 ml of diet under sterile conditions.
Aphids were placed on the Parafilm-covered diet for 24 h, during which time they secreted saliva into the diet solution. The diet/saliva solution was then collected under sterile conditions, and saliva collection chambers were washed with an additional 2 ml of diet that was pooled with the saliva-containing diet. In general, eight saliva collection chambers (with a total of 16,000 aphids) were used simultaneously, and diet/saliva solutions were pooled and stored at −80°C. Only ≈90% of these latter solutions could be recovered, because diet solution was ingested by the aphids, and solute remnants stayed on the covering Parafilm and the surface of the collection chamber.
The diet/saliva mix was concentrated for protein separation from a starting volume of ≈35 ml (16,000 aphids) to an end volume of 160 μl (the saliva of 100 aphids per microliter) for 1D SDS/PAGE. For 2D SDS/PAGE, proteins were further concentrated to the saliva of 250 aphids per microliter. For protein concentration, centrifugal concentrators (Vivaspin 20; 2 and 500 with a 3,000 molecular weight cut-off and polyethersulfon membrane; Sartorius, Goettingen, Germany) were used. The final sample was parted in aliquots of 10 μl and kept frozen at −80°C.
The 1D SDS/PAGE and second-dimension control lane in 2D separation used the saliva of 1,000 aphids (10 μl), whereas for 2D (first-dimension), saliva of 3,000 aphids (12 μl) was used per lane. Protein concentration could not be determined owing to the low sample concentration and the high number of different proteins.
Forisome/saliva interaction experiments as well as labeling experiments needed a higher protein concentration. Therefore, samples of different saliva collection runs were pooled before concentrating and concentrated as mentioned in the respective sections.
Isolation of Forisomes.
Forisomes were isolated from V. faba phloem tissue according to Knoblauch et al. (25). Forisome isolation media with EDTA concentration of 10 and 2 mM were outgassed and covered with argon gas, and 1 mM sodium sulfite was added to quench oxygen (M. Knoblauch and W. S. Peters, personal communication). The cortex of one 5- to 7-week-old V. faba stem was carefully pulled off, and phloem was scratched off with a scalpel. Plant material was transferred to forisome isolation medium containing 10 mM EDTA. After incubation time of 30 min, scratched phloem was homogenized with liquid nitrogen. For solubilization of homogenized plant material containing forisomes, 4 ml of 2 mM EDTA forisome-isolation medium was used to lower the EDTA concentration for subsequent experiments. After filtration of solubilized plant material through a 60 μm mesh filter freshly isolated forisomes were used for in vitro studies on saliva function.
In Vitro Interactions Between Forisomes and Aphid Saliva.
Dispersion and contraction of forisomes in response to various treatments was observed with a bright-field microscope using a ×40 objective (Leica DMLB; Leica, Wetzlar, Germany) and documented with a digital camera (Digital Eyepiece Camera DEC-18; WPI, Sarasota, FL). Solutions were outgassed and covered with argon gas, and 1 mM sodium sulfite was added to quench oxygen (M. Knoblauch and W. S. Peters, personal communication). Four microliters of 1 mM CaCl2 [with 50 mM KCl and 10 mM Tris buffer (pH 7.3)] was pipetted under the coverslip, followed by successive additions of 2 μl of 2 mM EDTA [with 50 mM KCl and 10 mM Tris buffer (pH 7.3)], 2 μl of 1 mM CaCl2, 2 μl of 2 mM EDTA, again 2 μl of CaCl2 and, finally, an aliquot of 4 μl of saliva concentrate (equivalent to watery saliva of 6,750 aphids), all dissolved in the same buffer. All steps were done in a 5-cm-deep custom-made Perspex bath chamber, perfused continuously with argon gas to protect proteins from oxygen attack (M. Knoblauch and W. S. Peters, personal communication).
To test the presence of nonprotein chelators in aphid watery saliva, salivary proteins were digested with proteinase K bound to acrylic beads (Sigma–Aldrich, St. Louis, MO). Proteinase K acrylic beads were used so that the proteinase could be removed easily after digestion. Two and a half milligrams of Proteinase K acrylic beads were activated by incubation in 200 μl of H2O containing 1 mM CaCl2 and 1 mM EDTA (pH 7.5) (KOH) for 30 min at 37°C and 750 rpm in a thermomixer (Thermomixer Comfort; Eppendorf, Hamburg, Germany). Activation solution was removed and replaced with concentrated saliva of ≈30,000 aphids (1,000 aphids per microliter). Digestion was done for 2 h at 37°C and 1,500 rpm. Acrylic beads were removed by centrifugation for 5 min at ≈11,000 × g; the supernatant contained the digested salivary proteins. Digestion was controlled by 1D SDS/PAGE versus a nondigested saliva protein sample. Supernatant with digested salivary proteins was tested against forisomes as described previously for the undigested salivary proteins.
One-Dimensional and 2D SDS/PAGE.
SDS/PAGE of the saliva concentrate was carried out according to Laemmli (41) by using a 4% stacking gel and a 10% separation gel in a MiniProtean 3 Electrophoresis System (Bio-Rad, Hercules, CA). As protein size markers, Precision Plus Protein Standards; All Blue or Kaleidoscope (Bio-Rad Laboratories, Hercules, CA) were used for 1D SDS/PAGE, and Sigma Marker-Wide molecular weight range (Sigma–Aldrich) was used for 2D SDS/PAGE. For 1D SDS/PAGE and the first dimension of 2D SDS/PAGE, fourfold concentrated reducing sample buffer, (Roti-Load 1; Carl-Roth, Karlsruhe, Germany) was added to each saliva sample in the proportion of 1:3. Two-dimensional SDS/PAGE according to ref. 35 was used for detection of calcium-binding saliva proteins. Saliva samples for 2D SDS/PAGE were mixed with a diagonal marker (random polymers of Glu, Lys, and Tyr(6:3:1); Sigma–Aldrich) before separation in the first dimension. All gels contained 2 mM EDTA in the first dimension, whereas the second-dimension separations were carried out with 2 mM CaCl2, MgCl2, or ZnCl2 in the separation gel. Control gels contained 2 mM EDTA in both dimensions. First-dimension lanes excised for the secondary dimension were prepared with equilibration buffer (35) containing the appropriate ions as mentioned above. The SDS/PAGE gels were silver stained (42, 43).
Gels were documented with the Gel Doc XR documentation system (Bio-Rad) and analyzed by using the Quantity One 1-D Analysis Software (Bio-Rad).
Labeling with 45Ca2+.
Concentrated watery saliva proteins of 41,000 aphids (21 μl) separated by 10% SDS/PAGE mini gels, were blotted onto nitrocellulose membrane (Protran BA 85, pore size 0.45 μm; Whatman/Schleicher & Schuell, Dassel, Germany) by using Towbin buffer (44) at 35 V overnight. For protein detection, the blot membrane was stained with Ponceau S (Roche Diagnostic, Mannheim, Germany) and destained with PBS [6.1 mM Na2HPO4/2 mM NaH2PO4/154 mM NaCl (pH 7.2)]. As a protein marker, 7 μl of Precision Plus Protein Kaleidoscope (Bio-Rad) was preferred to control the transfer quality during Western blotting. It showed an affinity to calcium, which was helpful in PhosphorImager (FUJIX BAS 1000; Fuji Photofilm, Tokyo, Japan) analysis.
The blot membrane was washed three times for 20 min each in 40 ml of incubation buffer [5 mM MgCl2/60 mM KCl/10 mM imidazol-HCl (pH 6.8)]. Subsequently, the membrane was incubated for 10 min in 40 ml of buffer containing 1.5 MBq [45Ca]Cl2 (GE Healthcare U.K., Little Chaltfont, U.K.). The membrane was washed two times in 20 ml of Millipore H2O for 5 min each (33). Incubation time of the blot membrane onto the PhosphorImager screen was set to 72 h. The 45Ca2+-labeled proteins were detected by making use of a PhosphorImager (FUJIX BAS 1000; Fuji Photofilm) and the acquisition and analysis software TINA.
Ruthenium Red Staining.
Ruthenium red staining was preceded by Western blotting and Ponceau S staining in a way identical to that for 45Ca2+ labeling. Final staining of calcium-binding proteins with ruthenium red [25 mg/liter of ruthenium red (Sigma–Aldrich) in 60 mM KCl, 5 mM MgCl2, 10 mM Tris·HCl (pH 7.5)] lasted for 48 h (34). Ponceau S (Roche Diagnostic) as well as ruthenium red staining were documented with an Epson Perfection 3490 scanner (Epson, Meerbusch, Germany).
Supplementary Material
Acknowledgments
We thank Michael Knoblauch (Washington State University, Pullman, WA) and Gundula Noll (University of Muenster, Muenster, Germany) for their support in forisome isolation and handling; Martin Hardt, Rupert Schmidt, and Gerd Weigand (Zentrale Biotechnische Betriebseinheit, Justus Liebig University) for supplying [45Ca]Cl2 and assistance in PhosphorImaging; and Gregory P. Walker (University of California, Riverside, CA) and Winfried S. Peters (Indiana University, Fort Wayne, IN) for critical reading of the manuscript.
Abbreviations
- EPG
electrical penetration graph
- SE
sieve element.
Footnotes
The authors declare no conflict of interest.
This article is a PNAS Direct Submission.
This article contains supporting information online at www.pnas.org/cgi/content/full/0703535104/DC1.
References
- 1.King RW, Zeevaart JAD. Plant Physiol. 1974;53:96–103. doi: 10.1104/pp.53.1.96. [DOI] [PMC free article] [PubMed] [Google Scholar]
- 2.van Bel AJE. Plant Cell Environ. 2003;26:125–149. [Google Scholar]
- 3.van Bel AJE. Baluska F, Volkmann D, Barlow PW, editors. Cell–Cell Channels. 2006:1–6. www.Eurekah.com. [Google Scholar]
- 4.Knoblauch M, van Bel AJE. Plant Cell. 1998;10:35–50. [Google Scholar]
- 5.Knoblauch M, Peters WS, Ehlers K, van Bel AJE. Plant Cell. 2001;13:1221–1230. doi: 10.1105/tpc.13.5.1221. [DOI] [PMC free article] [PubMed] [Google Scholar]
- 6.Ehlers K, Knoblauch M, van Bel AJE. Protoplasma. 2000;214:80–92. [Google Scholar]
- 7.Kauss H. In: Membranes: Specialized Functions in Plants. Smallwood M, Knox JP, Bowles DJ, editors. Guildford, UK: BioScientific Publishers; 1990. pp. 77–92. [Google Scholar]
- 8.Eschrich W. In: Encyclopedia of Plant Physiology. Zimmermann MH, Milburn JA, editors. Vol 1. Berlin: Springer; 1975. pp. 39–56. [Google Scholar]
- 9.Sjolund RD. Plant Cell. 1997;9:1137–1146. doi: 10.1105/tpc.9.7.1137. [DOI] [PMC free article] [PubMed] [Google Scholar]
- 10.Will T, van Bel AJE. J Exp Bot. 2006;57:729–737. doi: 10.1093/jxb/erj089. [DOI] [PubMed] [Google Scholar]
- 11.Behnke HD, Sjolund RD. Sieve Elements; Comparative Structure, Induction and Development. Berlin: Springer; 1990. [Google Scholar]
- 12.Behnke HD. IAWA Bull. 1991;12:143–175. [Google Scholar]
- 13.Lawton DM. Protoplasma. 1978;97:1–11. [Google Scholar]
- 14.Read SM, Northcote DH. Eur J Biochem. 1983;134:561–569. doi: 10.1111/j.1432-1033.1983.tb07603.x. [DOI] [PubMed] [Google Scholar]
- 15.Leineweber K, Schulz A, Thompson GA. Aust J Plant Physiol. 2000;27:733–741. [Google Scholar]
- 16.Tjallingii WF, Hogen Esch TH. Physiol Entomol. 1993;18:317–328. [Google Scholar]
- 17.Ding JP, Pickard BG. Plant J. 1993;3:713–720. [PubMed] [Google Scholar]
- 18.Tjallingii WF. J Exp Bot. 2006;57:739–745. doi: 10.1093/jxb/erj088. [DOI] [PubMed] [Google Scholar]
- 19.Miles PW. Biol Reviews. 1999;74:41–85. [Google Scholar]
- 20.Prado E, Tjallingii WF. Entomol Exp Appl. 1994;72:157–165. [Google Scholar]
- 21.Klingler J, Powell G, Thompson GA, Isaacs R. Entomol Exp Appl. 1998;86:79–88. [Google Scholar]
- 22.Chen JQ, Rahbé Y, Delobel B, Sauvion N, Guillaud J, Febvay G. Entomol Exp Appl. 1997;85:33–44. [Google Scholar]
- 23.Tjallingii WF, Cherqui A. In: Procedures, Experiments, and Applications in Entomology. Sommeijer MJ, Meeuwsen FJAJ, editors. Vol 10. Amsterdam: Netherlands Entomological Society; 1999. pp. 169–174. [Google Scholar]
- 24.Miles PW, Oertli JJ. Entomol Exp Appl. 1993;67:275–283. [Google Scholar]
- 25.Knoblauch M, Noll GA, Müller T, Prüfer D, Schneider-Hüther I, Scharner D, van Bel AJE, Peters WS. Nat Mater. 2003;9:600–603. doi: 10.1038/nmat960. [DOI] [PubMed] [Google Scholar]
- 26.Fromm J, Bauer T. J Exp Bot. 1994;45:463–469. [Google Scholar]
- 27.Tjallingii WF. Entomol Exp Appl. 1985;38:187–193. [Google Scholar]
- 28.Tjallingii WF. In: Aphids, Their Biology, Natural Enemies and Control. Minks AK, Harrewijn P, editors. Vol B. Amsterdam: Elsevier; 1988. pp. 95–108. [Google Scholar]
- 29.Martin B, Collar JL, Tjallingii WF, Fereres A. J Gen Virol. 1997;78:2701–2705. doi: 10.1099/0022-1317-78-10-2701. [DOI] [PubMed] [Google Scholar]
- 30.Baumann L, Baumann P. Entomol Exp Appl. 1995;77:56–60. [Google Scholar]
- 31.Cherqui A, Tjallingii WF. J Insect Physiol. 2000;46:1177–1186. doi: 10.1016/s0022-1910(00)00037-8. [DOI] [PubMed] [Google Scholar]
- 32.Madhusudhan VV, Miles PW. Entomol Exp Appl. 1998;86:25–39. [Google Scholar]
- 33.Maruyama K, Mikawa T, Ebashi S. J Biochem. 1984;95:511–519. doi: 10.1093/oxfordjournals.jbchem.a134633. [DOI] [PubMed] [Google Scholar]
- 34.Charuk JHM, Pirraglia CA, Reithmeier RAF. Ann Biochem. 1990;188:123–131. doi: 10.1016/0003-2697(90)90539-l. [DOI] [PubMed] [Google Scholar]
- 35.Kameshita I, Fujisawa H. Anal Biochem. 1997;249:252–255. doi: 10.1006/abio.1997.2185. [DOI] [PubMed] [Google Scholar]
- 36.Hayashi H, Chino M. Plant Cell Physiol. 1986;27:1387–1393. [Google Scholar]
- 37.Ziegler H. In: Encyclopedia of Plant Physiology. Zimmermann MH, Milburn JA, editors. Vol 1. Berlin: Springer; 1975. pp. 59–100. [Google Scholar]
- 38.Alosi MC, Melroy DL, Park RB. Plant Physiol. 1988;86:1089–1094. doi: 10.1104/pp.86.4.1089. [DOI] [PMC free article] [PubMed] [Google Scholar]
- 39.McLean DL, Kinsey MG. Nature. 1964;202:1358–1359. [Google Scholar]
- 40.Tjallingii WF. Entomol Exp Appl. 1978;38:177–186. [Google Scholar]
- 41.Laemmli UK. Nature. 1970;227:680–685. doi: 10.1038/227680a0. [DOI] [PubMed] [Google Scholar]
- 42.Schoenle EJ, Adams LD, Sammons DW. J Biol Chem. 1984;259:12112–12116. [PubMed] [Google Scholar]
- 43.Switzer RC, III, Merril CR. Ann Biochem. 1979;98:231–237. doi: 10.1016/0003-2697(79)90732-2. [DOI] [PubMed] [Google Scholar]
- 44.Towbin H, Staehelin T, Gordon J. Proc Natl Acad Sci USA. 1979;76:4350–4354. doi: 10.1073/pnas.76.9.4350. [DOI] [PMC free article] [PubMed] [Google Scholar]
- 45.Furch ACU, Hafke JB, Schulz A, van Bel AJE. J Exp Bot. 2007 doi: 10.1093/jxb/erm143. in press. [DOI] [PubMed] [Google Scholar]
Associated Data
This section collects any data citations, data availability statements, or supplementary materials included in this article.