Abstract
A number of studies have reported that a high-fat diet induces increases in mitochondrial fatty acid oxidation enzymes in muscle. In contrast, in two recent studies raising plasma free fatty acids (FFA) resulted in a decrease in mitochondria. In this work, we reevaluated the effects of raising FFA on muscle mitochondrial biogenesis and capacity for fat oxidation. Rats were fed a high-fat diet and given daily injections of heparin to raise FFA. This treatment induced an increase in mitochondrial biogenesis in muscle, as evidenced by increases in mitochondrial enzymes of the fatty acid oxidation pathway, citrate cycle, and respiratory chain, with an increase in the capacity to oxidize fat, as well as an increase in mitochondrial DNA copy number. Raising FFA also resulted in an increase in binding of peroxisome proliferator-activated receptor (PPAR) δ to the PPAR response element on the carnitine palmitoyltransferase 1 promoter. We interpret our results as evidence that raising FFA induces an increase in mitochondrial biogenesis in muscle by activating PPARδ.
Keywords: peroxisome proliferator-activated receptor (PPAR)δ, high-fat diet, fatty acid oxidation
It has been reported that high-fat diets induce increased expression of mitochondrial fatty acid oxidation (FAO) enzymes in skeletal muscle, and it has been suggested that this adaptation results in an increase in the capacity to oxidize fatty acids (1–6). Similarly, exposure of cardiac myocytes to moderately high concentrations of fatty acids activates transcription of the muscle carnitine palmitoyltransferase (mCPT) gene (7). The peroxisome proliferator-activated receptors PPARα and PPARβ/δ (PPARδ) are ligand-activated nuclear receptors that activate transcription of genes encoding FAO enzymes as well as the uncoupling proteins (8–11). Both PPARα and PPARδ are expressed in skeletal muscle, with PPARδ being the predominant isoform (12, 13). The PPARs are activated by long-chain fatty acids (14, 15). It, therefore, seemed likely that if raising plasma free fatty acids (FFA) does increase muscle FAO enzymes, this effect is mediated by PPARδ and α. However, in contrast to the earlier reports, two recent studies have reported that raising plasma FFA with a lipid emulsion (16) or a high-fat diet (17) results in decreases in muscle mitochondrial enzymes.
In this context, the present study was undertaken to determine whether raising plasma FFA does induce an increase in expression of FAO enzymes in skeletal muscle and, if it does, to obtain evidence regarding whether the increase in FFA activates PPARδ. A second aim, if raising FFA was found to increase FAO enzymes, was to determine whether an isolated increase in FAO enzymes results in an increase in the capacity to oxidize fatty acids or whether the citrate cycle and respiratory chain are rate-limiting.
Results
Plasma FFA Concentrations.
Plasma FFA were markedly elevated in the rats fed the high-fat diet and given heparin (2.06 ± 0.42 mM; range 1.22–3.84 mM) for six rats given heparin compared with 0.25 ± 0.02 mM for six chow-fed rats.
Raising Plasma FFA Induces Increased Expression of Genes Encoding FAO Enzymes.
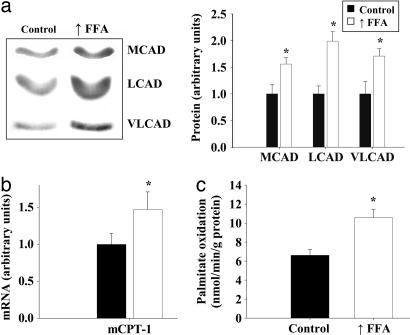
As shown in Fig. 1a, protein levels of three enzymes used as markers for the mitochondrial FAO pathway. Medium-chain acyl-CoA dehydrogenase, long-chain acyl-CoA dehydrogenase, and very long-chain acyl-CoA dehydrogenase were all significantly increased in epitrochlearis muscles of rats in which plasma FFA were raised daily for 4 weeks. mCPT type 1 (mCPT1) mRNA was also significantly increased in triceps muscles in response to elevation of plasma FFA (Fig. 1b). The genes that encode these FAO enzymes are regulated by PPARδ and PPARα (8, 9, 11, 18). Expression of the uncoupling proteins is also regulated by these nuclear receptors (9, 11, 19), and uncoupling protein 3 (UCP3) expression was increased in muscle of rats in which plasma FFA were raised (chow group 1.0 ± 0.16 vs. raised FFA group 2.44 ± 0.39 arbitrary units; P < 0.01).
Fig. 1.
Raising plasma FFA induces increased expression of genes encoding FAO enzymes in skeletal muscle. (a) Representative Western blots and average protein values of three enzymes used as markers for the mitochondrial β-oxidation pathway in epitrochlearis muscles of rats fed either a chow diet (control) or a high-fat diet (n = 7 per group). The rats on the high-fat diet were given daily heparin injections to raise FFA levels (↑FFA). MCAD, medium-chain acyl-CoA dehydrogenase; LCAD, long-chain acyl-CoA dehydrogenase; VLCAD, very long-chain acyl-CoA dehydrogenase. (b) Real time PCR analysis of mCPT-1 mRNA levels in triceps muscles of control and ↑FFA groups (n = 6 per group). (c) Palmitate oxidation by triceps muscles homogenates of the control and ↑FFA groups of rats (n = 7 per group). ∗, P < 0.05, significantly different from control.
The capacity of skeletal muscle to oxidize fatty acids was evaluated by measuring the rate of 14CO2 production from [14C]palmitate by whole homogenates of triceps muscles under conditions in which availability of ADP and Pi are not rate-limiting. As shown in Fig. 1c, the rate of palmitate oxidation was increased ≈60% in triceps muscles of the rats in which plasma FFA were raised.
Raising FFA Induces Increased Expression of Mitochondrial Citrate Cycle and Respiratory Chain Enzymes.
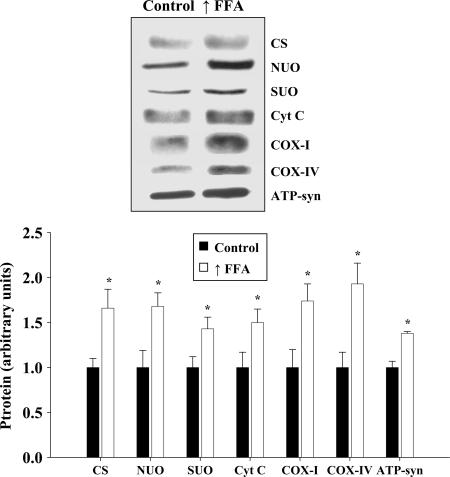
The expression of citrate synthase was increased ≈66% in epitrochlearis muscles of the high-fat diet plus heparin group (Fig. 2). Raising FFA also induced increases in the levels of a number of proteins used as markers for the mitochondrial respiratory chain, including NADH ubiquinol oxidoreductase 39-kDA subunit, succinate-ubiquinone oxidoreductase 70-kDA subunit, cytochrome c, cytochrome oxidase subunit I (COXI), cytochrome oxidase subunit IV (COXIV), and ATP synthase subunit α (Fig. 2). Another mitochondrial enzyme, δ-aminolevulinate synthase (ALAS), which is rate-limiting for heme synthesis, also increased in muscle in response to the high-fat diet (controls, 1.00 ± 0.15 vs. high FFA group, 1.71 ± 0.10, ALAS protein arbitrary units, P < 0.01).
Fig. 2.
Increased expression of a range of mitochondrial enzymes in response to raising plasma FFA levels. Representative Western blots and average protein values for mitochondrial enzymes used as markers for the citrate cycle [citrate synthase (CS)] and respiratory chain [NADH-ubiquinone oxidoreductase (NUO), succinate-ubiquinone oxidoreductase 70-kDa subunit (SUO), cytochrome c (Cyt c), COXI, COXIV], and ATP synthase subunit α (ATP-syn) in epitrochlearis muscles are shown. n = 7 per group. ∗, P < 0.05, significantly different from controls.
Responses of PPARs α and δ and PPARγ Coactivator 1α (PGC-1α) to Elevation of Plasma FFA.
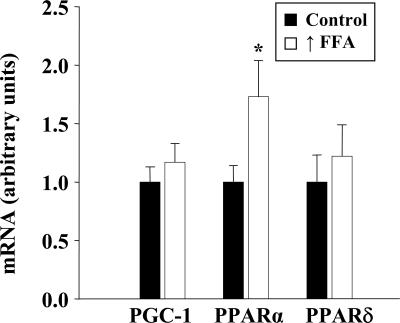
Raising plasma FFA induced a significant increase in PPARα mRNA but had no effect on the level of PPARδ or PGC-1α in skeletal muscle (Fig. 3).
Fig. 3.
Effect of raising FFA on expression of PGC-1α, PPARα, and PPARδ. Real-time PCR analysis of mRNA levels in triceps muscles is shown. Values are means ± SEM for six muscles per group.
Mitochondrial DNA Copy Number.
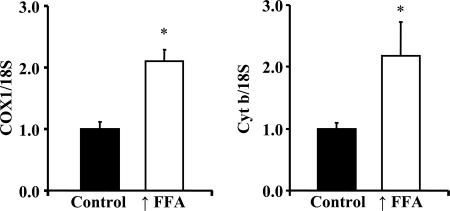
To evaluate further the effect of raising plasma FFA on mitochondrial biogenesis, we obtained information regarding mitochondrial DNA copy number. As shown in Fig. 4, mitochondrial DNA copy number, as reflected in the ratios of COXI DNA to 18S DNA and of cytochrome b DNA to 18S DNA, was significantly increased in triceps muscles of the rats with raised FFA levels.
Fig. 4.
Mitochondrial DNA copy number was evaluated in triceps muscles of rats with raised FFA and control animals by determining the ratios of COX1 DNA to 18S DNA, and of cytochrome b (Cyt b) to 18S DNA. The COX1 and cytochrome b genes are in the mitochondrial genome, and the 18S gene is in the nuclear genome. Values are means ± SE for four rats with ↑FFA and five controls. ∗, P < 0.05.
PPARδ Binding to the mCPT-1 Promoter Is Increased in Muscle of Rats with Raised Plasma FFA.
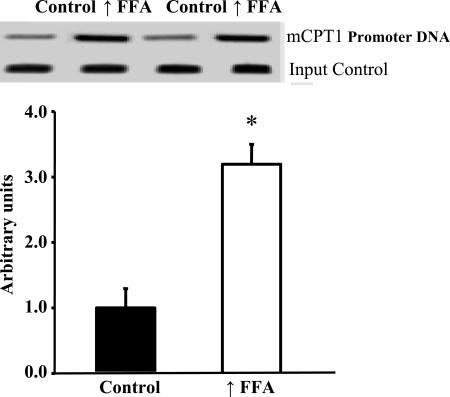
Increased expression or activation of PPARδ in skeletal muscle or myotubes results in increased mitochondrial biogenesis (20–22). Elevation of plasma FFA did not result in increased expression of PPARδ (Fig. 3). However, our finding that raising plasma FFA induces increased expression of mitochondrial FAO enzymes (Fig. 1) and UCP3, which are encoded in PPARδ target genes, suggested that the increase in FFA resulted in activation of PPARδ. To explore this possibility, we used the ChIP assay to measure binding of PPARδ to the PPAR response element on the mCPT-1 promoter. As shown in Fig.5, there was a large increase in PPARδ binding to the mCPT-1 promoter in muscles of the rats with raised plasma FFA. This finding provides evidence that the increase in FFA resulted in activation of PPARδ.
Fig. 5.
PPARδ binding to the mCPT promoter is increased in epitrochlearis muscles of rats in response to raising plasma FFA. Values are means ± SE for six samples per group (two epitrochlearis muscles per sample). ∗, P < 0.002, significantly different from control.
Discussion
High-fat diets have been reported to induce increases in enzymes involved in FAO in skeletal muscle (2–6). These studies, which involved measurement of a few marker enzymes, led to the speculation that increased availability of fatty acids induces an increase in the capacity of muscle to oxidize fat. More recent studies have resulted in the opposite conclusion, that markedly raising plasma FFA (16) or eating a high-fat diet (17) causes a decrease in muscle mitochondria. In the present work, by using a model that raises FFA to higher levels than does a high-fat diet per se, we addressed the question of whether increasing plasma FFA induces an increase in mitochondrial FAO capacity in muscle. There were two reasons for this approach. One was that it seemed likely that if raising plasma FFA induces FAO enzymes, this adaptation would be more readily detected with a larger increase in FFA. The other is that we are interested in the role of FFA in the adaptive increase in mitochondrial biogenesis in muscle in response to exercise (23–25), and therefore, we wanted to raise FFA levels into the range seen with sustained vigorous exercise.
A second aim, if raising FFA did induce an increase in mitochondrial FAO pathway enzymes, was to determine whether the capacity of the citrate cycle and/or mitochondrial respiratory chain limits FAO or whether an isolated increase in mitochondrial FAO enzymes suffices to increase the capacity for fat oxidation. We found that raising plasma FFA does induce increased expression of enzymes involved in fatty acid transport into, and oxidation by, the mitochondria. Fatty acids regulate gene expression through direct interaction with, and activation of, the PPARs (10, 14, 15, 26, 27), and PPARδ and PPARα regulate transcription of the genes encoding the fatty acid β-oxidation enzymes (9, 11, 13, 28, 29). Both PPARδ and PPARα are expressed in skeletal muscle, with PPARδ being the predominant isoform (8, 12, 13, 20). In this context, our finding that markedly raising plasma FFA induces increases in mitochondrial FAO enzymes does not seem surprising (7, 30). However, raising FFA also induced increases in enzymes of the citrate cycle and respiratory chain, so whether an isolated increase in mitochondrial FAO pathway enzymes results in an increased capacity of muscle to oxidize fat is still an open question.
Our finding of increases in a wide range of mitochondrial enzymes and in the capacity to oxidize fatty acids provides evidence that raising plasma FFA results in an increase in mitochondrial biogenesis. This interpretation is supported by the finding that raising plasma FFA induced an increase in mitochondrial DNA copy number in muscle. These findings would be surprising if it were not for the discovery by a number of laboratories that overexpression of PPARδ (20, 22) or PPARα (9) in muscle or activation of PPARδ in muscle or cultured myotubes (21, 22) results in an increase in mitochondrial biogenesis similar to that induced by exercise (24). Our finding that raising plasma FFA resulted in a large increase in PPARδ binding to the PPAR response element on the mCPT-1 promoter provides evidence that the increase in FFA resulted in activation of PPARδ. Therefore, in light of the evidence that an increase in PPARδ activity results in an increase in muscle mitochondria (20–22) and that raising FFA activates PPARδ, it seems probable that similar to the effect of the PPARδ activator GW501516 (11, 21, 22), fatty acids induce increased mitochondrial biogenesis by activating PPARδ. Although PPARδ is the predominant PPAR isoform in skeletal muscle (8, 12, 13, 20), PPARα is also expressed in muscle. Therefore, because PPARα is activated by fatty acids and because its expression in muscle increased in response to raising plasma FFA (Fig. 3), activation of PPARα may also have contributed to the increase in mitochondrial biogenesis induced by raising plasma FFA.
Now that we have shown that markedly raising plasma FFA induces an increase in muscle respiratory capacity, it will be interesting in future studies to determine whether the smaller increases in FFA that occur in response to a high-fat diet induce a similar adaptation, to evaluate the effects of different types of fatty acids, and to determine the role played by elevations of plasma FFA in the adaptive response of muscle to exercise.
In conclusion, this work provides the information that large increases in plasma FFA induce an increase in mitochondrial biogenesis in skeletal muscle, as evidenced by increases in a range of mitochondrial proteins, including enzymes of the FAO pathway, citrate cycle, and respiratory chain. This adaptation results in an increase in functional mitochondria, as evidenced by enhancement of the capacity to oxidize fat. Raising plasma FFA resulted in a large increase in binding of PPARδ to the mCPT-1 promoter, providing evidence that the increase in FFA resulted in activation of PPARδ. In light of the evidence that an increase in PPARδ activity induces increased mitochondrial biogenesis (20–22), we interpret our results as evidence that raising FFA levels brings about an increase in muscle mitochondria by activation of PPARδ.
Materials and Methods
Reagents for SDS/PAGE were from Bio-Rad (Hercules, CA). Reagents for ECL were purchased from Amersham Pharmacia Biotech (Arlington Heights, IL). Mouse anti-human monoclonal antibodies against NADH ubiquinol oxidoreductase 39-kDa subunit, succinate-ubiquinone oxidoreductase 70-kDa subunit, COXI and COXIV, and ATP synthase subunit α were obtained from Molecular Probes (Eugene, OR). Rabbit polyclonal antibodies directed against the 19 carboxyl-terminal amino acids of δ-aminolevulinate synthase and against the 20 carboxyl-terminal amino acids of citrate synthase were generated by Alpha Diagnostic International (San Antonio, TX). A mouse anti-cytochrome c monoclonal antibody was purchased from Phar-Mingen International (San Diego, CA). A rabbit anti-human UCP3 polyclonal antibody was purchased from Chemicon International (Temecula, CA). Polyclonal antibodies specific for medium-chain, long-chain, and very long-chain acyl-CoA dehydrogenase were generated as described previously (31–33). Horseradish peroxidase-conjugated donkey anti-rabbit, donkey anti-goat, and goat anti-mouse IgG were purchased from Jackson ImmunoResearch Laboratories (West Grove, PA). EZ-CHIP kits were obtained from Upstate Biotechnology (Lake Placid, NY). Rat IgG was obtained from Santa Cruz Biotechnology (Santa Cruz, CA). TRIzol reagent for isolation of RNA was purchased from GIBCO (Grand Island, NY). Reagents for isolation of mRNA were obtained from Ambion (Austin, TX). TaqMan reverse transcription and RT-PCR reagents were purchased from Applied Biosystems (Foster City, CA). All other reagents were obtained from Sigma (St. Louis, MO).
Animal Care.
This work was approved by the Animal Studies Committee of Washington University School of Medicine (St. Louis, MO). Male Wistar rats (body mass 51–75 g) were obtained from Charles River Laboratories (Wilmington, MA). After an adaptation period to the new facilities, animals were given either a rodent laboratory chow diet (Purina, St. Louis, MO) or a high-fat diet and water ad libitum during the 4 weeks of the experimental period. The high-fat diet contained, as percent of calories, 40% flax seed oil, 20% olive oil, 13.3% cornstarch, 6.6% sucrose, and 20% casein. The diet was supplemented with 50 g/kg bran, 22 g/kg premier vitamin mix 40077 (AIN mix 76A), 51 g/kg premier mineral mix 170915 (AIN mix 76), and 4.4 g/kg premier methionine 10850 (all from Harlan Teklad, Madison, WI). Every morning, when their blood was lipemic from eating the high-fat diet during the night, the animals were given 50 units of heparin per 100 g of body weight to raise the plasma FFA level.
Muscle and Dissection.
Rats were anesthetized with an i.p. injection of pentobarbital sodium (5 mg/100 g of body mass), and the epitrochlearis and triceps muscles were removed.
Palmitate Oxidation.
Triceps muscles were homogenized in ice-cold 300 mM sucrose containing 10 mM Tris·HCl and 2 mM EDTA. The capacity of whole homogenates of triceps muscles to oxidize [14C]palmitate was assessed by measuring the rate of 14CO2 production as described previously (34, 35). The reaction mixture consisted of homogenate equivalent to 50 mg of wet weight muscle/5 mM MgCl2/30 mM KCl/30 mM potassium phosphate buffer/150 mM sucrose/2 mM EDTA/2 mM ADP/15 mM Tris·HCl/1 mM carnitine/0.025 mM CoA/1% BSA/0.75 mM palmitate containing 0.25 μCi of [1-14C]palmitate in a final volume of 2 ml. The reaction mixture was placed in flasks fitted with serum caps and hanging center wells containing 0.4 ml of hyamine hydroxide. The flasks were incubated in Dubnoff shaking incubators. The 14CO2 produced was trapped, and radioactivity was measured with a scintillation counter. Results are expressed per gram of wet muscle weight.
Western Blotting.
Epitrochlearis muscles were homogenized in ice-cold 250 mM sucrose containing 10 mM Hepes/1 mM EDTA, pH 7.4. Whole-muscle homogenates were subjected to three freeze and thaw cycles to disrupt the mitochondria. The samples were then centrifuged at 800 × g for 15 min at 4°C, and the supernatant was collected. Protein concentrations were measured with a BCA protein assay kit, and sample volumes were adjusted to give the same protein concentration. Aliquots of homogenates were solubilized in Laemmli buffer, subjected to SDS/PAGE, and transferred to PVDF membranes. The membranes were blocked overnight at 4°C with 5% nonfat dry milk in PBS containing 0.1% Tween 20. The blots were probed with the primary antibodies followed by incubation with the appropriate horseradish peroxidase-conjugated anti-IgG antibody. Antibody-bound protein was detected with enhanced chemiluminescence and quantified by densitometry.
Real-Time Quantitative RT-PCR.
Real-time PCR was performed as described previously (36, 37). Total RNA isolated from triceps muscle was reverse transcribed with TaqMan reverse transcription reagents (Applied Biosystems) using oligo(dT) and random hexamers (1:1 ratio). Reactions were performed in triplicate in a 96-well format with TaqMan core reagents and a Prism 7700 Sequence Detector (Applied Biosystems). Rat-specific primer/probe sets used to detect specific gene expression were selected by using PRIMER EXPRESS (Applied Biosystems) and are listed in Table 1. A GAPDH RNA (VIC) probe set was included in all reactions as an internal correction control, and corrected data were normalized to β-actin expression (Applied Biosystems).
Table 1.
Rat-specific primer/probe sets used to detect specific gene expression
| Primer/probe | Sequence |
|---|---|
| mCPT-1 | |
| Forward | 5′-ATCATGTATCGCCGCAAACT-3′ |
| Reverse | 5′-ATCTGGTAGGAGCACATGGGT-3′ |
| Probe | 5′-TCAAGCCGGTAATGGCACTGGG-3′ |
| PGC-1α | |
| Forward | 5′-GTGCAGCCAAGACTCTGTATGG-3′ |
| Reverse | 5′-GTCCAGGTCATTCACATCAAGTTC-3′ |
| Probe | 5′-AGTGACATAGAGTGRGCTGCC-3′ |
| PPARα | |
| Forward | 5′-ACTATGGAGTCCACGCATGRG-3′ |
| Reverse | 5′-TTGTCGTACGCCAGCTTTAGC-3′ |
| Probe | 5′-AAGGCTGTAAGGGCTTCTTTCGGCG-3′ |
| PPARδ | |
| Forward | 5′-TCACTGGCAAGTCCAGCCA-3′ |
| Reverse | 5′-ACACCAGGCCCTTCTCTGCCT-3′ |
| Probe | 5′-AACGCACCCTTCATCATCCACGA-3′ |
All probes are 5′ FAM- and 3′ TAMRA-modified.
Mitochondrial DNA Copy Number.
Total DNA was isolated from triceps muscle samples by using standard organic extraction (38). DNA was resuspended in 100 ml of TE buffer (10 mM Tris, pH 8.1/1 mM EDTA). PCR was done using 18S primers for a nuclear target sequence (Ambion catalog no.1718) and primers for two separate mitochondrial DNA targets, cytochrome b (forward, acaaaatcccattccatcca; reverse, gttgggaatggagcgtagaa) and COXI (forward, ggagcagtattcgccatcat; reverse, cggccgtaagtgagatgaat). The cycling conditions used were 95°C for 2 min followed by 27 30-sec cycles at 95°C, 27 60-sec cycles at 56°C, and 27 60-sec cycles at 72°C. The PCRs were performed with a master mix (Promega, Madison, WI) containing Taq polymerase, dNTPs, MgC12, reaction buffers at optimal concentrations for efficient amplification of DNA templates by PCR. For reactions with COXI and 18S, 0.1 μg of sample DNA was used, and for cytochrome b and 18S, 0.25 μg of DNA was used. PCR products were separated by electrophoresis on 2% agarose and stained with SYBR Green (Molecular Probes), photographed, and analyzed by densitometry. The ratio of COXI to 18S and the ratio of cytochrome b to 18S were then calculated.
ChIP Assay.
ChIP assays were performed with an EZ-CHIP kit from Upstate Biotechnology. Two epitrochlearis muscles were pooled for each sample and cross-linked in 10 ml of PBS containing 1% formaldehyde for 10 min at room temperature. One milliliter of 10× glycine (Upstate Biotechnology) was added to stop fixation. Muscles were homogenized in 1 ml of SDS/lysis buffer containing 5 μl of Protease Inhibitor Mixture II (Upstate Biotechnology) in glass grinding tubes (Kontes, Vineland, NJ). Chromatin was sheared by sonicating each sample for four times for 10 sec on ice. After centrifugation at 10,000 × g at 4°C for 10 min, supernatant containing 1 mg of protein was diluted to 1 ml with dilution buffer (Upstate Biotechnology). Five micrograms of PPARδ antibody was added per sample and incubated overnight at 4°C. Normal rat IgG was used as a nonspecific control. The next morning, 60 μl of protein G–agarose was added, and the sample was mixed for 1 h at 4°C with rotation. Precipitated complexes were eluted in 100 μl of elution buffer (Upstate Biotechnology), and cross-linking was reversed by the addition of 8 μl of 5 M NaCl per sample followed by incubation at 65°C overnight. Coimmunoprecipitated DNA was purified according to the manufacturer's directions. Primers were designed to amplify the PPARδ-binding region of the mCPT-1promoter. The following specific primers were used: forward, 5′-gactggagaggaatgggaca-3′; reverse, 5′-cctagggagggtgggtagag-3′. PCR conditions were as follows: 94°C for 2 min followed by 36 30-sec cycles at 94°C, 36 30-sec cycles at 59°C, and 36 60-sec cycles at 72°C. Fifty microliters of PCR product was loaded onto a 2% agarose gel and electrophoretically separated, and the densities of the bands were quantified. Purified DNA from the input sample that did not undergo immunoprecipitation was PCR amplified and used to normalize signals from ChIP assays.
Statistical Analysis.
Values are expressed as means ± SE. Statistically significant differences were determined by using unpaired Student's t tests.
Acknowledgments
We thank Victoria Reckamp for expert assistance with the preparation of this paper. This work was supported by National Institutes of Health Grants AG00425 (to J.O.H.), K01 DK063051 (to J.M.H.), and Diabetes Research and Training Grant P60 DK20579-28. P.G.-R. was supported by an American Diabetes Association Mentor-Based Postdoctoral Fellowship. C.H. was initially supported by an American Diabetes Association Mentor-Based Postdoctoral Fellowship and subsequently by National Institutes of Health Individual National Research Service Award 1F32DK076410.
Abbreviations
- COXI
cytochrome oxidase subunit I
- COXIV
cytochrome oxidase subunit IV
- FAO
fatty acid oxidation
- FFA
free fatty acids
- mCPT
muscle carnitine palmitoyltransferase
- PGC-1α
PPARγ coactivator 1α
- PPAR
peroxisome proliferator-activated receptor
- UCP3
uncoupling protein 3.
Footnotes
The authors declare no conflict of interest.
References
- 1.Iossa S, Mollica MP, Lionetti L, Crescenzo R, Botta M, Liverini G. Int J Obes. 2002;26:65–72. doi: 10.1038/sj.ijo.0801844. [DOI] [PubMed] [Google Scholar]
- 2.Lapachet RAB, Miller WC, Arnall DA. J Appl Physiol. 1996;80:1173–1179. doi: 10.1152/jappl.1996.80.4.1173. [DOI] [PubMed] [Google Scholar]
- 3.McAinch AJ, Lee J-S, Bruce CR, Tunstall RJ, Hawley JA, Cameron-Smith D. Obes Res. 2003;11:1471–1479. doi: 10.1038/oby.2003.197. [DOI] [PubMed] [Google Scholar]
- 4.Miller WC, Bryce GR, Conlee RK. J Appl Physiol. 1984;56:78–83. doi: 10.1152/jappl.1984.56.1.78. [DOI] [PubMed] [Google Scholar]
- 5.Nemeth PM, Rosser BWC, Choksi RM, Norris BJ, Baker KM. Am J Physiol. 1992;262:C282–C286. doi: 10.1152/ajpcell.1992.262.2.C282. [DOI] [PubMed] [Google Scholar]
- 6.Simi B, Sempore B, Mayet M-H, Favier RJ. J Appl Physiol. 1991;71:197–203. doi: 10.1152/jappl.1991.71.1.197. [DOI] [PubMed] [Google Scholar]
- 7.Brandt JM, Djouadi F, Kelly DP. J Biol Chem. 1998;273:23786–23792. doi: 10.1074/jbc.273.37.23786. [DOI] [PubMed] [Google Scholar]
- 8.Evans RM, Barish GD, Wang Y-X. Nat Med. 2004;10:1–7. doi: 10.1038/nm1025. [DOI] [PubMed] [Google Scholar]
- 9.Finck BN, Bernal-Mizrachi C, Han D-H, Coleman T, Sambandam N, LaRiviere L, Holloszy JO, Semenkovich C, Kelly DP. Cell Metab. 2005;1:133–144. doi: 10.1016/j.cmet.2005.01.006. [DOI] [PubMed] [Google Scholar]
- 10.Gulick T, Cresci S, Caira T, Moore DD, Kelly DP. Proc Natl Acad Sci USA. 1994;91:11012–11016. doi: 10.1073/pnas.91.23.11012. [DOI] [PMC free article] [PubMed] [Google Scholar]
- 11.Wang Y-X, Lee C-H, Tiep S, Yu RT, Ham J, Kang H, Evans RM. Cell. 2003;113:159–170. doi: 10.1016/s0092-8674(03)00269-1. [DOI] [PubMed] [Google Scholar]
- 12.Dressel U, Allen TL, Pippal JB, Rohde PR, Lau P, Muscat GEO. Mol Endocrinol. 2003;17:2477–2493. doi: 10.1210/me.2003-0151. [DOI] [PubMed] [Google Scholar]
- 13.Muoio DM, MacLean PS, Lang DB, Li S, Houmard JA, Way JM, Winegar DA, Corton JC, Dohm GL, Kraus WE. J Biol Chem. 2002;277:26089–26097. doi: 10.1074/jbc.M203997200. [DOI] [PubMed] [Google Scholar]
- 14.Forman BM, Chen J, Evans RM. Proc Natl Acad Sci USA. 1997;94:4312–4317. doi: 10.1073/pnas.94.9.4312. [DOI] [PMC free article] [PubMed] [Google Scholar]
- 15.Xu HE, Lambert MH, Montana VG, Parks DJ, Blanchard SG, Borwn PJ, Sternbach DD, Lehmann JM, Wisely GB, Willson TM, et al. Mol Cell. 1999;3:397–403. doi: 10.1016/s1097-2765(00)80467-0. [DOI] [PubMed] [Google Scholar]
- 16.Richardson DK, Kashyap S, Bajaj M, Cusi K, Mandarino SJ, Finlayson J, DeFronzo RA, Jenkinson CP, Mandarino LJ. J Biol Chem. 2005;280:10290–10297. doi: 10.1074/jbc.M408985200. [DOI] [PubMed] [Google Scholar]
- 17.Sparks LM, Xie H, Koza RA, Mynatt R, Hulver MW, Bray GA, Smith SR. Diabetes. 2005;54:1926–1933. doi: 10.2337/diabetes.54.7.1926. [DOI] [PubMed] [Google Scholar]
- 18.Muoio DM, Way JM, Tanner CJ, Winegar DA, Kliewer SA, Houmard JA, Kraus WE, Dohm GL. Diabetes. 2002;51:901–909. doi: 10.2337/diabetes.51.4.901. [DOI] [PubMed] [Google Scholar]
- 19.Young ME, Patil S, Ying J, Depre C, Ahuja HS, Shipley GL, Stepkowski SM, Davies PJA, Taegtmeyer H. FASEB J. 2001;15:833–845. doi: 10.1096/fj.00-0351com. [DOI] [PubMed] [Google Scholar]
- 20.Luquet S, Lopez-Soriano J, Holst D, Fredenrich A, Melki J, Rassoulzadegan M, Grimaldi PA. FASEB J. 2003;17:2299–2301. doi: 10.1096/fj.03-0269fje. [DOI] [PubMed] [Google Scholar]
- 21.Tanaka T, Yamamoto J, Iwasaki S, Asaba H, Hamura H, Ikeda Y, Watanabe M, Magoori K, Ioka RX, Tachibana K, et al. Proc Natl Acad Sci USA. 2003;100:15924–15929. doi: 10.1073/pnas.0306981100. [DOI] [PMC free article] [PubMed] [Google Scholar]
- 22.Wang Y-X, Zhang C-L, Yu RT, Cho HK, Nelson MC, Bayuga-Ocampo CR, Ham J, Kang H, Evans RM. PLOS Biol. 2004;2:1532–1539. doi: 10.1371/journal.pbio.0020294. [DOI] [PMC free article] [PubMed] [Google Scholar]
- 23.Baar K, Wende AR, Jones TE, Marison M, Nolte LA, Chen M, Kelly DP, Holloszy JO. FASEB J. 2002;16:1879–1886. doi: 10.1096/fj.02-0367com. [DOI] [PubMed] [Google Scholar]
- 24.Holloszy JO, Booth FW. Annu Rev Physiol. 1976;38:273–291. doi: 10.1146/annurev.ph.38.030176.001421. [DOI] [PubMed] [Google Scholar]
- 25.Wright DC, Han DH, Garcia-Roves PM, Geiger PC, Jones TE, Holloszy JO. J Biol Chem. 2007;282:194–199. doi: 10.1074/jbc.M606116200. [DOI] [PubMed] [Google Scholar]
- 26.Huss JM, Kelly DP. Circ Res. 2004;95:568–578. doi: 10.1161/01.RES.0000141774.29937.e3. [DOI] [PubMed] [Google Scholar]
- 27.Kliewer SA, Sundseth SS, Jones SA, Brown PJ, Wisely GB, Koble CS, Devchand P, Wahli W, Willson TM, Lenhard JM, et al. Proc Natl Acad Sci USA. 1997;94:4318–4323. doi: 10.1073/pnas.94.9.4318. [DOI] [PMC free article] [PubMed] [Google Scholar]
- 28.Barger PM, Kelly DP. Trends Cardiovasc Med. 2000;10:238–245. doi: 10.1016/s1050-1738(00)00077-3. [DOI] [PubMed] [Google Scholar]
- 29.Mascaró C, Acosta E, Ortiz JA, Marrero PF, Hegardt FG, Haro D. J Biol Chem. 1998;273:8560–8563. doi: 10.1074/jbc.273.15.8560. [DOI] [PubMed] [Google Scholar]
- 30.Chevillotte E, Rieusset J, Roques M, Desage M, Vidal H. J Biol Chem. 2001;276:10853–10860. doi: 10.1074/jbc.M008010200. [DOI] [PubMed] [Google Scholar]
- 31.Exil VJ, Roberts RL, Sims H, McLaughlin JE, Malkin RA, Gardner CD, Ni G, Rottman JN, Strauss AW. Circ Res. 2003;93:448–455. doi: 10.1161/01.RES.0000088786.19197.E4. [DOI] [PubMed] [Google Scholar]
- 32.Kelly DP, Kim JJ, Billadello JJ, Hainline BE, Chu TW, Strauss AW. Proc Natl Acad Sci USA. 1987;84:4068–4072. doi: 10.1073/pnas.84.12.4068. [DOI] [PMC free article] [PubMed] [Google Scholar]
- 33.Kurtz DM, Rinaldo P, Rhead WJ, Tian L, Millington DS, Vockley J, Hamm DA, Brix AE, Lindsey JR, Pinkert CA, et al. Proc Natl Acad Sci USA. 1998;95:15592–15597. doi: 10.1073/pnas.95.26.15592. [DOI] [PMC free article] [PubMed] [Google Scholar]
- 34.Baldwin KM, Klinkerfuss GH, Terjung RL, Molé PA, Holloszy JO. Am J Physiol. 1972;222:373–378. doi: 10.1152/ajplegacy.1972.222.2.373. [DOI] [PubMed] [Google Scholar]
- 35.Molé PA, Oscai LB, Holloszy JO. J Clin Invest. 1971;50:2323–2330. doi: 10.1172/JCI106730. [DOI] [PMC free article] [PubMed] [Google Scholar]
- 36.Garcia-Roves PM, Huss J, Holloszy JO. Am J Physiol. 2006;290:E1172–E1179. doi: 10.1152/ajpendo.00633.2005. [DOI] [PubMed] [Google Scholar]
- 37.Schoenfeld JR, Vasser M, Jhurani P, Ng P, Hunter JJ, Ross J, Chien KR, Lowe DG. J Mol Cell Cardiol. 1998;30:2269–2280. doi: 10.1006/jmcc.1998.0787. [DOI] [PubMed] [Google Scholar]
- 38.Strauss WM. In: Current Protocols in Molecular Biology. Ausubel FM, editor. New York: Wiley; 1998. pp. 2.2.1–2.2.3. [Google Scholar]


